XAU/USD (Gold) - Trendline Breakout (US - CPI Data) (11.09.2025)The XAU/USD Pair on the M30 timeframe presents a Potential Selling Opportunity due to a recent Formation of a Trendline Breakout Pattern.
This suggests a shift in momentum towards the downside in the coming hours.
Possible Short Trade:
Entry: Consider Entering A Short Position around Trendline Of The Pattern.
Target Levels:
1st Support – 3583
2nd Support – 3546
🎁 Please hit the like button and
🎁 Leave a comment to support for My Post !
Your likes and comments are incredibly motivating and will encourage me to share more analysis with you.
DXY

GBP/USD - Breakout (US - CPI Data) (11.09.2025)The GBP/USD Pair on the M30 timeframe presents a Potential Selling Opportunity due to a recent Formation of a Breakout Pattern.
This suggests a shift in momentum towards the downside in the coming hours.
Possible Short Trade:
Entry: Consider Entering A Short Position around Trendline Of The Pattern.
Target Levels:
1st Support – 1.3475
2nd Support – 1.3441
🎁 Please hit the like button and
🎁 Leave a comment to support for My Post !
Your likes and comments are incredibly motivating and will encourage me to share more analysis with you.

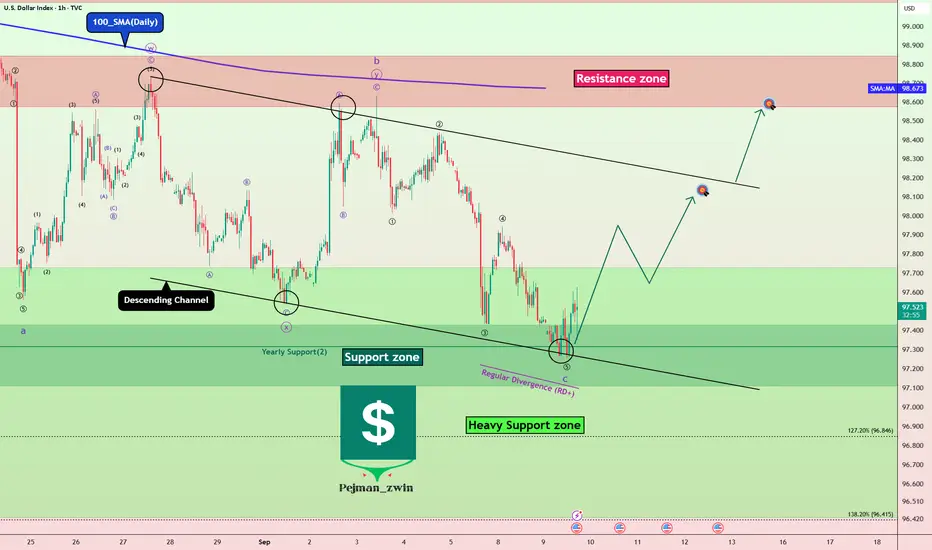
DXY at Major Support – Dollar Ready to Rebound?Today, I want to analyze the DXY index ( TVC:DXY ) for you. First, I must say that this week, US indexes can have an impact on the DXY index trend .
US indexes to be released this week:
Core PPI m/m: Tomorrow
PPI m/m: Tomorrow
Core CPI m/m: Thursday
CPI m/m: Thursday
CPI y/y: Thursday
Unemployment Claims: Thursday
Prelim UoM Consumer Sentiment: Friday
Prelim UoM Inflation Expectations: Friday
The DXY Index is currently moving near the Support zone($97.989-$97.834) , Yearly Support(2) , and the lower line of the descending channel .
In terms of Elliott Wave theory , it seems that the DXY index has managed to complete microwave 5 of the main wave C . The corrective structure is of the Zigzag Correction(ABC/5-3-5) type.
Also, we can see the Regular Divergence (RD+) between consecutive valleys .
I expect the DXY index to rise to at least $98.07(First Target) before the US indexes are announced.
Second Target: $98.56
Stop Loss(SL): $96.997
Note: With the DXY index rising, we can expect a correction in Gold( OANDA:XAUUSD ), Bitcoin( BINANCE:BTCUSDT ), and major Forex pairs (dollar strength).
Please respect each other's ideas and express them politely if you agree or disagree.
U.S. Dollar Index Analyze (DXYUSD), 1-hour time frame.
Be sure to follow the updated ideas.
Do not forget to put a Stop loss for your positions (For every position you want to open).
Please follow your strategy and updates; this is just my Idea, and I will gladly see your ideas in this post.
Please do not forget the ✅' like '✅ button 🙏😊 & Share it with your friends; thanks, and Trade safe.
Gold Setting Up for Weekly Low Sweep – Watching 3650sGold has stalled out at the highs this week and is showing signs of exhaustion after a strong 2-week bullish run. Thursday’s close left us hovering just above key support in the 3650s.
For Friday, I’m watching for a break and close below yesterday’s low on the 1H chart. If we get that confirmation, I’ll be looking for continuation shorts targeting Monday’s low and potentially the 8HR FVG around 3600–3620 to close out the week.
If bulls defend this level again, then the range may extend — but the cleaner move is down into untested imbalances below.
This sets up Friday as a key day:
✅ Break yesterday’s low = downside liquidity run in play
❌ Hold support again = chop/range into next week

Trade Insight BTC, ETH & GOLD📢 NFX Market Update – BITSTAMP:BTCUSD BTC, BINANCE:ETHUSD & FX:XAUUSD
Similar to Ethereum, Bitcoin (BTCUSD.r) is facing a potential heavy block order between 114,750 – 115,000. On the H1 chart, a divergence formation is signaling the risk of a short-term retracement. Price is consolidating, and I expect a pullback toward the ascending triangle breakout zone, which now acts as support.
Given current volatility and conflicting signals, I strongly recommend staying off trading on Ethereum, Bitcoin, and Gold until the market cools off and provides a clearer direction.
Patience here is key - let the market reveal its next move before stepping in.💚

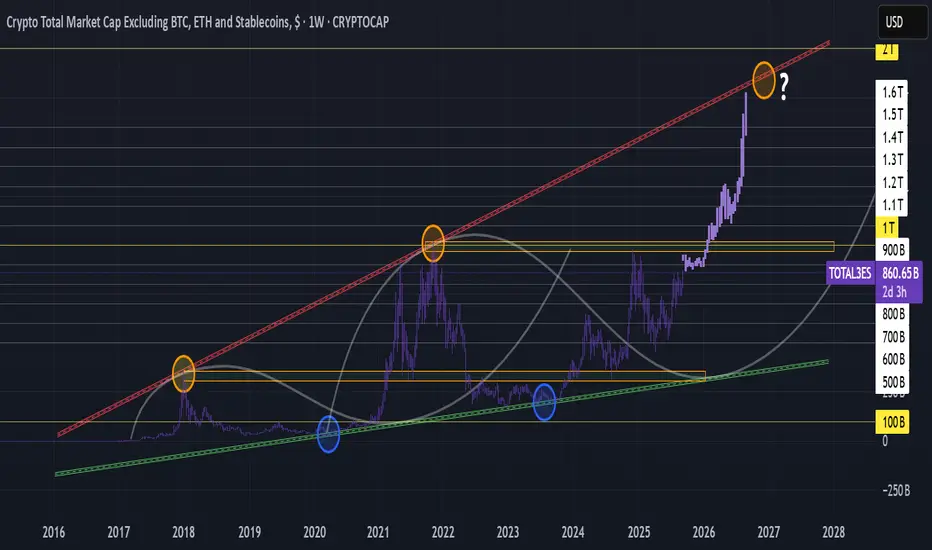
TOTAL3ES (Excluding BTC/ETH/stables) is coiled up."History doesn't repeat itself, but it often rhymes"
$1T is the line in the sand - reclaim & retest and the runway opens.
DXY rolling over (see previous post) = perfect fuel.
Alt season & beyond may almost be here.
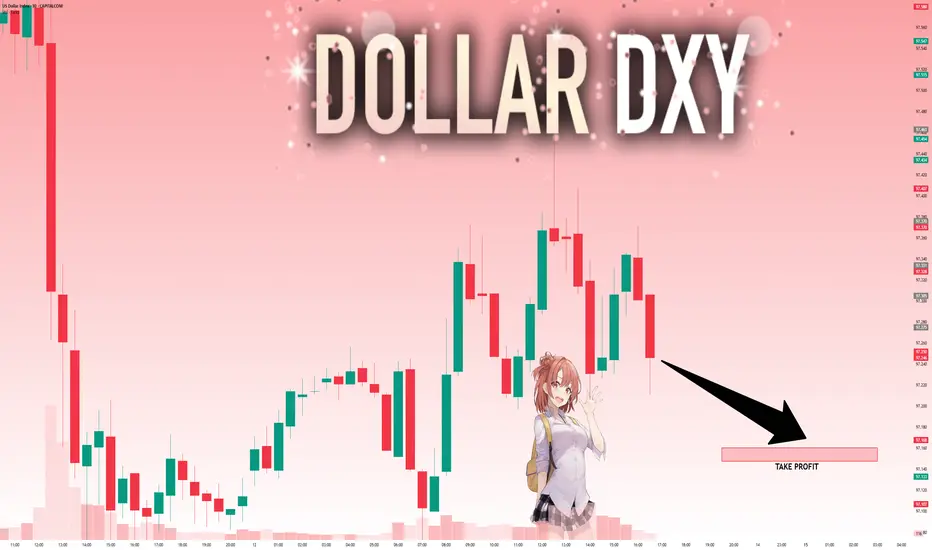
DXY: Target Is Down! Short!
My dear friends,
Today we will analyse DXY together☺️
The recent price action suggests a shift in mid-term momentum. A break below the current local range around 97.216 will confirm the new direction downwards with the target being the next key level of 97.160 and a reconvened placement of a stop-loss beyond the range.
❤️Sending you lots of Love and Hugs❤️
Bearish reversal off 61.8% Fibonacci resistance?The US Dollar Index (DXY) is rising towards the pivot which aligns with the 61.8% Fibonacci retracement, and could reverse to the 1st support.
Pivot: 98.11
1st Support: 97.36
1st Resistance: 98.47
Disclaimer:
The above opinions given constitute general market commentary, and do not constitute the opinion or advice of IC Markets or any form of personal or investment advice.
Any opinions, news, research, analyses, prices, other information, or links to third-party sites contained on this website are provided on an "as-is" basis, are intended only to be informative, is not an advice nor a recommendation, nor research, or a record of our trading prices, or an offer of, or solicitation for a transaction in any financial instrument and thus should not be treated as such. The information provided does not involve any specific investment objectives, financial situation and needs of any specific person who may receive it. Please be aware, that past performance is not a reliable indicator of future performance and/or results. Past Performance or Forward-looking scenarios based upon the reasonable beliefs of the third-party provider are not a guarantee of future performance. Actual results may differ materially from those anticipated in forward-looking or past performance statements. IC Markets makes no representation or warranty and assumes no liability as to the accuracy or completeness of the information provided, nor any loss arising from any investment based on a recommendation, forecast or any information supplied by any third-party.

AUD/USD - Bullish Channel (10.09.2025) The AUD/USD pair on the M30 timeframe presents a Potential Buying Opportunity due to a recent Formation of a Bullish Channel Pattern.
This suggests a shift in momentum towards the upside and a higher likelihood of further advances in the coming hours.
Possible Long Trade:
Entry: Consider Entering A Long Position around Trendline Of The Pattern.
Target Levels:
1st Resistance – 0.6636
2nd Resistance – 0.6658
🎁 Please hit the like button and
🎁 Leave a comment to support for My Post !
Your likes and comments are incredibly motivating and will encourage me to share more analysis with you.
Best Regards, KABHI_TA_TRADING
Thank you.
Disclosure: I am part of Trade Nation's Influencer program and receive a monthly fee for using their TradingView charts in my analysis.

GOLD - BEARISH TO $3,588 (1H UPDATE)Like I said on yesterday’s update, we’re yet to see ‘Minor Wave 4’ correction on Gold, as part of the bigger Wave 3 bullish cycle.
We’ve seen a ‘Break of Structure’ as price broke below previous ‘Wave IV’ yesterday. I’ve placed a ‘Sell Stop’ order at $3,629. If this activates, I’ll be targeting $3,588📉
If this doesn’t activate, then our buy positions keep pushing higher into profit!

EURUSDHello Hello Traders! 👋
What are your thoughts on EURUSD?
EUR/USD has been trapped in a sideways range for the past few weeks, showing choppy back-and-forth movements.
However, the recent break above the descending trendline suggests that a potential bullish breakout could be underway.
After some short-term consolidation, the pair could gain bullish momentum and head toward the next resistance levels.
Thursday’s U.S. CPI data will be a key catalyst that may drive volatility and determine the pair's next direction.
Don’t forget to like and share your thoughts in the comments! ❤️

DXY ready to resume downtrend!97.94 Level on DXY is a high liquidity zone as in the falling market there is bounce off to 97.937. Price grabbed liquidity and started to drop again to the major direction of the trend. As it is a long term down trend and price just rejected from a high liquidity zone, it is a high probability price may continue to drop to this support level as multiple timeframe trend is bearish.

EURUSD – Weakness Ahead?For over a month, EURUSD has been stuck in a choppy range:
• Support: 1.1580 zone
• Resistance: just above 1.1700
As always, such tight consolidations usually precede strong moves. The question is: which way?
🔑 Factors pointing lower:
1. On the DXY, I expect a potential upside reversal – most bad news is already priced in.
2. Yesterday’s reaction to the NFP revision → USD strength, not weakness, which confirms the shift in sentiment.
3. A false break above resistance on EURUSD adds to the bearish case.
📌 Conclusion:
I expect further EURUSD weakness, with confirmation if the price breaks below 1.1650.

GBP/USD - Bullish Channel - All Eyes on USD Inflation ReportBuy GBP/USD - Bullish Channel Patterns makes bullish movement Today
Fundaments Updates :
All Eyes on USD Inflation Report, this week give scope of Interest Rate Cute.
Expecting strong movement in upcoming PPI & CPI data for US.. USD Weak in upcoming days.
Thank you. Support buy Likes and Comments

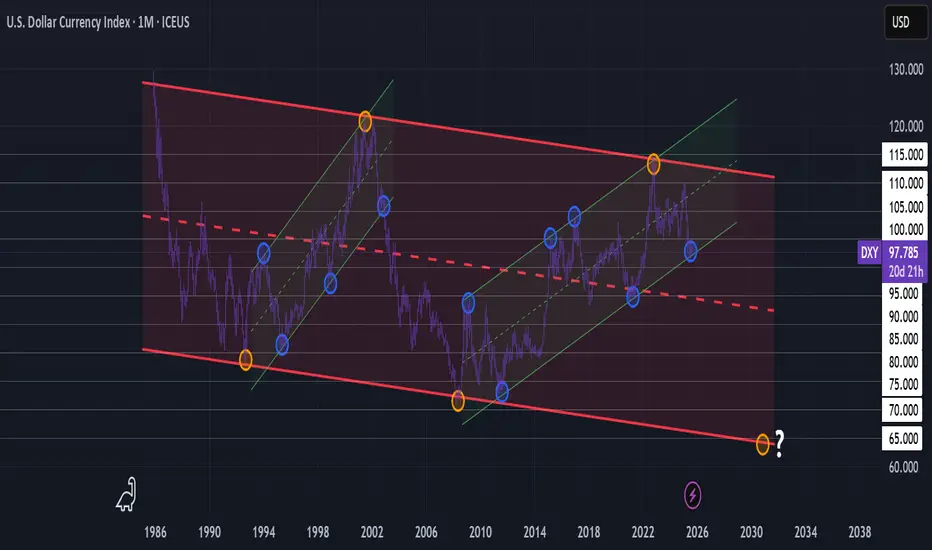
Implausible until it's not? Zoom out $DXY.On the high time frames, the dollar is trading inside a long-term descending channel that dates back decades. The rally into a rising channel has been previously followed by a decline 2002-2008. The most recent rejection from the channel’s upper trend in 2022–2023 suggests that momentum could shift toward the downside, with our next macro target lying near the bottom of the range. We've already broken below our major whole of 1.00 and retested.
Recent NFP data shows a cooling labor market. Slowing job growth and downward revisions might point to a break in momentum. A softer labor market reduces the Fed’s ability to maintain higher rates, undermining DXY strength. Beyond employment, consumer spending is showing cracks while business investment is being pressured by higher borrowing costs. If growth becomes stagnant, the immediate appeal of the economy could weaken, reducing foreign capital that support the dollar. Other factors may include tariffs, policy shifts, or deficits.
When both macro fundamentals and technical structure align, the case for a dollar decline strengthens. While near-term volatility is always expected around Fed shifts and global risk, the high-time-frame view points to the possibility of a downtrend that could extend into the months or possibly years to come.
Eyes peeled for an inverse crypto-winter.
Gold is Finally giving a pullback! I have been looking for this move to happen for 2 weeks and they have been so aggressively bullish. If we can get a close below yesterdays high before we come into the killzone i think they will continue to drop at least till news during NY session in the morning.

DXY: Target Is Up! Long!
My dear friends,
Today we will analyse DXY together☺️
The price is near a wide key level
and the pair is approaching a significant decision level of 97.331 Therefore, a strong bullish reaction here could determine the next move up.We will watch for a confirmation candle, and then target the next key level of 97.458.Recommend Stop-loss is beyond the current level.
❤️Sending you lots of Love and Hugs❤️

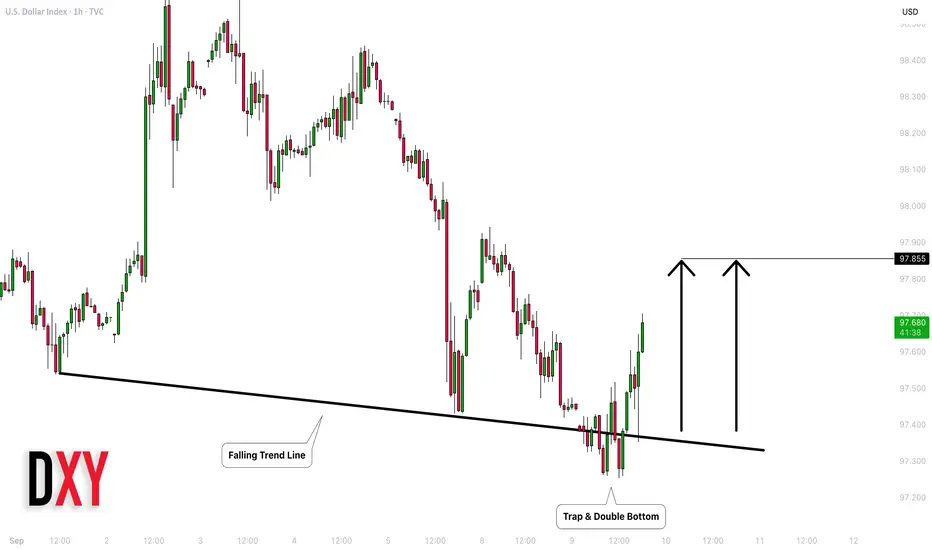
DOLLAR INDEX (DXY): Time to Recover
US Dollar finally shows a strength after a false violation
of a trend line and a formation of a double bottom pattern.
The index will most likely reach 97.85 level soon.
❤️Please, support my work with like, thank you!❤️
SELL XAUUSDIn todays session we are monitoring GOLD for bearish opportunities. Our entry is at 3607, London has made a high above Asia and we expect a drop towards Asia low and 3550 zone. Stops are above 3627.53. Use proper risk management.

BUY DXYIn todays session we will be taking buys on the dollar. Our entry is at 97.677 and stops are below 97.480 targets are above 98.40. Use proper risk management.

EURUSD, GBPUSD and DXY Analysis todayHello traders, this is a complete multiple timeframe analysis of this pair. We see could find significant trading opportunities as per analysis upon price action confirmation we may take this trade. Smash the like button if you find value in this analysis and drop a comment if you have any questions or let me know which pair to cover in my next analysis.

Fibonacci confluence signals bullish reversalUS Dollar Index (DXY) is falling towards the pivot and could bounce to the 1st resistance.
Pivot: 97.17
1st Support: 96.75
1st Resistance: 97.86
Disclaimer:
The above opinions given constitute general market commentary, and do not constitute the opinion or advice of IC Markets or any form of personal or investment advice.
Any opinions, news, research, analyses, prices, other information, or links to third-party sites contained on this website are provided on an "as-is" basis, are intended only to be informative, is not an advice nor a recommendation, nor research, or a record of our trading prices, or an offer of, or solicitation for a transaction in any financial instrument and thus should not be treated as such. The information provided does not involve any specific investment objectives, financial situation and needs of any specific person who may receive it. Please be aware, that past performance is not a reliable indicator of future performance and/or results. Past Performance or Forward-looking scenarios based upon the reasonable beliefs of the third-party provider are not a guarantee of future performance. Actual results may differ materially from those anticipated in forward-looking or past performance statements. IC Markets makes no representation or warranty and assumes no liability as to the accuracy or completeness of the information provided, nor any loss arising from any investment based on a recommendation, forecast or any information supplied by any third-party.

BTCUSD outlook and walkthrough. 9/9/2025, MondayBITSTAMP:BTCUSD
CSD model. Expansion. Retracement Market Profile
