The Dollar's Descent: Understanding Historic WeaknessThe U.S. dollar, long considered the world's premier reserve currency and a symbol of American economic might, finds itself in unprecedented territory as it continues to hover near all-time lows against a basket of major currencies. This sustained weakness represents more than just a numerical decline on foreign exchange charts; it signals a fundamental shift in global economic dynamics, monetary policy effectiveness, and international confidence in American fiscal management. The implications of this historic depreciation extend far beyond currency traders and central banks, touching everything from household purchasing power to geopolitical relationships and the future architecture of the global financial system.
The current situation represents a culmination of multiple converging factors that have been building over several years. The dollar's decline hasn't occurred in isolation but rather as part of a complex interplay between domestic fiscal policies, international trade dynamics, shifting reserve currency preferences, and evolving global economic power structures. Understanding this phenomenon requires examining not just the immediate catalysts but also the deeper structural changes that have eroded the dollar's traditional sources of strength.
The Anatomy of the Dollar's Decline
The measurement of the dollar's value against other currencies typically relies on the U.S. Dollar Index (DXY), which tracks the greenback against a weighted basket of six major currencies: the euro, Japanese yen, British pound, Canadian dollar, Swedish krona, and Swiss franc. When analysts refer to the dollar approaching all-time lows, they're observing a sustained depreciation that has pushed this index to levels not seen in decades, with some bilateral exchange rates reaching historic extremes.
The technical aspects of this decline reveal a currency under persistent selling pressure. Foreign exchange markets, which trade over six trillion dollars daily, have witnessed consistent dollar weakness across multiple timeframes and against virtually all major and emerging market currencies. This broad-based depreciation suggests that the issue isn't merely tactical positioning by traders but reflects fundamental concerns about the dollar's intrinsic value and future trajectory.
Several immediate factors have contributed to this weakness. The Federal Reserve's monetary policy stance, particularly its approach to interest rates and quantitative easing, has played a crucial role. While other central banks have moved more aggressively to combat inflation or support their currencies, the Fed's policies have often prioritized domestic economic stability over currency strength. This divergence in monetary policy has created interest rate differentials that make holding dollars less attractive relative to other currencies offering higher yields.
The massive fiscal stimulus measures implemented in recent years have also weighed heavily on the dollar. The expansion of the federal deficit and the dramatic increase in the national debt have raised questions about the long-term sustainability of American fiscal policy. International investors, who must consider currency risk when purchasing U.S. assets, have grown increasingly concerned about the potential for future dollar depreciation as a means of reducing the real burden of this debt.
Trade dynamics have further complicated the dollar's position. The persistent U.S. trade deficit means that more dollars flow out of the country to purchase foreign goods than flow in from exports. This structural imbalance creates constant selling pressure on the dollar as these funds are converted into other currencies. Additionally, the weaponization of the dollar through sanctions and financial restrictions has prompted some nations to seek alternatives for international trade settlement, reducing demand for dollars in global commerce.
Historical Context and Precedents
To fully appreciate the significance of the dollar's current weakness, it's essential to examine historical precedents and the evolution of the dollar's role in the global economy. The Bretton Woods system, established in 1944, positioned the dollar as the world's primary reserve currency, backed by gold and serving as the anchor for international monetary stability. When this system collapsed in 1971, the dollar transitioned to a fiat currency, deriving its value from the strength of the U.S. economy and the confidence of global markets rather than gold reserves.
Throughout its modern history, the dollar has experienced several significant periods of weakness. The stagflation of the 1970s saw the dollar lose considerable value as inflation soared and economic growth stagnated. The Plaza Accord of 1985 deliberately weakened the dollar to address trade imbalances, demonstrating that currency depreciation could be a policy tool rather than merely a market outcome. The financial crisis of 2008 triggered another period of dollar weakness as the Federal Reserve implemented unprecedented monetary easing.
However, the current situation differs from these historical episodes in several important ways. Previous periods of dollar weakness often occurred within a framework where the dollar's fundamental role as the global reserve currency remained unchallenged. Today, that supremacy faces genuine competition from alternative currencies and payment systems. The rise of the euro, the internationalization of the Chinese yuan, and the emergence of digital currencies all represent potential challenges to dollar hegemony that didn't exist during previous cycles of weakness.
The geopolitical context has also shifted dramatically. During past periods of dollar weakness, the United States maintained relatively stable relationships with its major trading partners and allies. Current tensions, trade disputes, and the fragmentation of the global economy into competing blocs have created an environment where dollar alternatives are not just economically viable but politically desirable for some nations. This represents a structural change that could make the current period of weakness more persistent and potentially irreversible in some respects.
Global Economic Implications
The ramifications of the dollar's sustained weakness extend throughout the global economy, creating both opportunities and challenges for different stakeholders. For American consumers, a weaker dollar translates directly into reduced purchasing power for imported goods. Everything from electronics to clothing to automobiles becomes more expensive as the dollar's depreciation increases the cost of foreign-produced items. This imported inflation adds to domestic price pressures, potentially eroding living standards and complicating monetary policy decisions.
American businesses face a mixed picture. Exporters benefit from a competitive advantage as their goods become relatively cheaper in foreign markets, potentially boosting sales and market share. Multinational corporations with significant overseas earnings see those profits translate into more dollars when repatriated, improving their financial results. However, companies reliant on imported inputs face higher costs, and those with international supply chains must navigate increased complexity and currency risk.
The impact on financial markets has been profound and multifaceted. Equity markets have shown remarkable resilience, with some sectors benefiting from the currency tailwind to earnings. However, bond markets face challenges as foreign investors demand higher yields to compensate for currency risk, potentially increasing borrowing costs for the U.S. government and corporate issuers. Commodity markets, traditionally priced in dollars, have seen significant price increases as the weakening currency makes raw materials more expensive in dollar terms.
For emerging markets, the dollar's weakness presents both opportunities and risks. Countries with dollar-denominated debt benefit from the reduced real burden of their obligations, providing fiscal relief and potentially enabling increased domestic investment. However, those nations that have traditionally relied on dollar stability for their own monetary frameworks face uncertainty and potential instability. The shift away from dollar dependence requires careful management and potentially painful adjustments to monetary and fiscal policies.
Developed economies have responded to the dollar's weakness in various ways. The European Union has seen the euro strengthen significantly, creating challenges for European exporters but providing relief from imported inflation. Japan faces particular difficulties as yen strength threatens its export-dependent economy, prompting potential intervention in currency markets. These dynamics have strained international cooperation and raised the specter of competitive devaluations reminiscent of the 1930s.
The Reserve Currency Question
Perhaps the most significant long-term implication of the dollar's sustained weakness concerns its status as the world's primary reserve currency. This privileged position has provided the United States with what former French Finance Minister Valéry Giscard d'Estaing called an "exorbitant privilege" – the ability to borrow in its own currency, maintain persistent trade deficits, and exercise significant influence over global financial conditions.
The erosion of confidence in the dollar threatens this special status. Central banks worldwide have been gradually diversifying their reserves away from dollars, increasing holdings of gold, euros, yuan, and other assets. While the dollar still accounts for the majority of global reserves, its share has been declining steadily. This trend, if it continues, could fundamentally alter the global financial architecture and reduce American influence over international economic affairs.
The search for alternatives has accelerated in recent years. The Chinese yuan's inclusion in the International Monetary Fund's Special Drawing Rights basket marked a significant milestone in its internationalization. Digital currencies, both central bank digital currencies and cryptocurrencies, offer potential alternatives for international trade settlement and value storage. Regional payment systems and bilateral currency swap agreements have proliferated, creating pathways for trade that bypass the dollar entirely.
However, the transition away from dollar dominance faces significant obstacles. The depth and liquidity of U.S. financial markets remain unmatched, providing essential infrastructure for global finance. The rule of law, property rights protection, and regulatory framework in the United States continue to attract international investment despite currency concerns. No single alternative currency currently possesses all the attributes necessary to fully replace the dollar's multifaceted role in the global economy.
Policy Responses and Future Scenarios
Policymakers face difficult choices in responding to the dollar's weakness. Traditional approaches to currency support, such as raising interest rates or intervening in foreign exchange markets, carry significant economic costs and may prove ineffective against structural pressures. The Federal Reserve must balance its domestic mandate for price stability and full employment with the international implications of its policies, a task made more complex by the dollar's global role.
Fiscal policy presents another set of challenges and opportunities. Addressing the structural factors undermining dollar confidence would require difficult decisions about spending, taxation, and debt management. Political polarization and competing economic priorities make comprehensive fiscal reform challenging, yet the consequences of inaction could be severe. The possibility of a dollar crisis, while still remote, has moved from the realm of theoretical speculation to a risk requiring serious contingency planning.
International cooperation could play a crucial role in managing the transition to a new monetary order. Multilateral agreements on exchange rate management, similar to but more flexible than the Bretton Woods system, might provide stability during a period of adjustment. However, the current geopolitical climate makes such cooperation difficult to achieve. The fragmentation of the global economy into competing blocs may accelerate the development of alternative currency systems, further undermining the dollar's position.
Looking ahead, several scenarios could unfold. A gradual, managed decline in the dollar's dominance might allow for smooth adjustment to a multipolar currency system, with several major currencies sharing reserve status. This outcome would require careful coordination and policy discipline from major economies. Alternatively, a more chaotic transition could occur if confidence in the dollar erodes rapidly, potentially triggering financial instability and economic disruption.
The technological revolution in finance adds another dimension of uncertainty. Central bank digital currencies could reshape international monetary relations in ways that are difficult to predict. The adoption of blockchain technology and smart contracts might enable new forms of international trade settlement that don't require traditional reserve currencies. These innovations could either accelerate the dollar's decline or, if led by the United States, potentially reinforce its position through digital dominance.
Conclusion: Navigating Uncharted Waters
The dollar's hover near all-time lows represents more than a cyclical fluctuation in currency markets; it signals a potential inflection point in the global economic order. The convergence of fiscal pressures, monetary policy challenges, geopolitical tensions, and technological disruption has created conditions unlike any previously experienced in the modern era of fiat currencies. The implications extend beyond exchange rates to encompass fundamental questions about economic governance, international cooperation, and the distribution of global economic power.
For investors, businesses, and policymakers, navigating this environment requires careful consideration of both immediate risks and long-term structural changes. Hedging strategies, diversification approaches, and policy frameworks developed during periods of dollar strength may prove inadequate in a world where the greenback's supremacy can no longer be assumed. The ability to adapt to multiple possible futures, rather than betting on a single outcome, becomes essential for managing risk and capturing opportunities.
The social and political implications of the dollar's decline deserve equal attention to the economic aspects. Currency strength has long been intertwined with national prestige and political power. A sustained period of dollar weakness could reshape domestic politics, alter international alliances, and influence the trajectory of globalization itself. The psychological impact of losing reserve currency status, should it occur, would reverberate through American society in ways that extend far beyond financial markets.
As the world watches the dollar's trajectory with a mixture of concern and opportunism, the need for thoughtful analysis and measured response becomes paramount. The current situation demands neither panic nor complacency but rather a clear-eyed assessment of changing realities and proactive adaptation to new circumstances. The dollar's decline may mark the end of one era and the beginning of another, but the nature of that new era remains to be written by the collective actions of governments, markets, and societies worldwide.
The path forward will likely be characterized by increased volatility, structural adjustments, and the gradual emergence of new monetary arrangements. Whether this transition enhances global economic stability or triggers periodic crises will depend largely on the wisdom and cooperation of global leaders. The dollar's current weakness serves as both a warning and an opportunity – a signal that the old order is passing and a chance to build something better in its place. The challenge lies in managing this transition while maintaining the stability and prosperity that the dollar-based system, despite its flaws, has helped facilitate for decades.
In this context, the dollar's hover near all-time lows should be understood not as an isolated phenomenon but as part of a broader transformation of the global economy. The outcomes of this transformation remain uncertain, but its importance cannot be overstated. The decisions made in response to the dollar's weakness will shape international economic relations for generations to come, making this one of the most consequential periods in modern monetary history.
Dxyforecast
DXY ready to drop ?DXY trade setup for today :
Before we look at potential entry in this pair first let’s look at multiple timeframe analysis in this market.
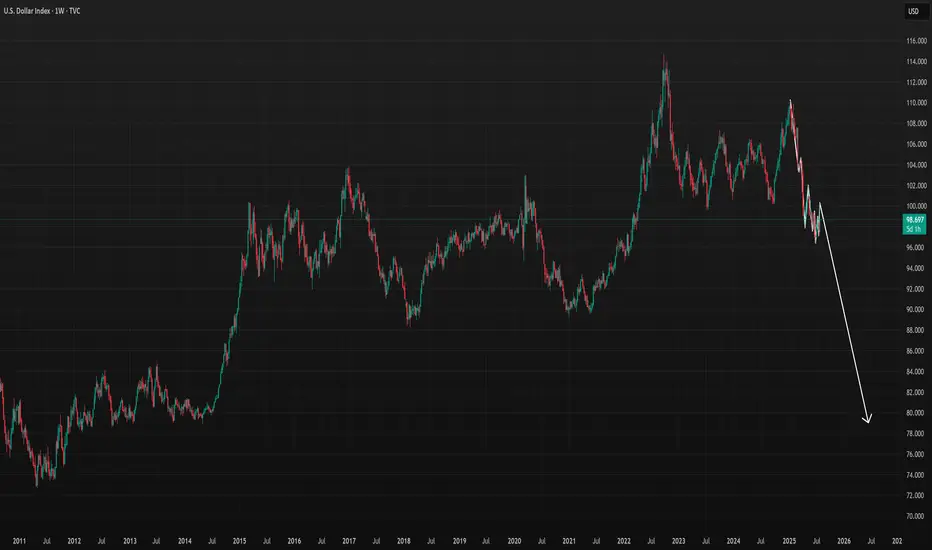
Monthly: 100.24 Monthly resistance price has got rejection strongly from the top
Weekly: Bearish engulfed formation with strong liquidity grab
Daily: A sharp rejection with liquidity grab from the resistance
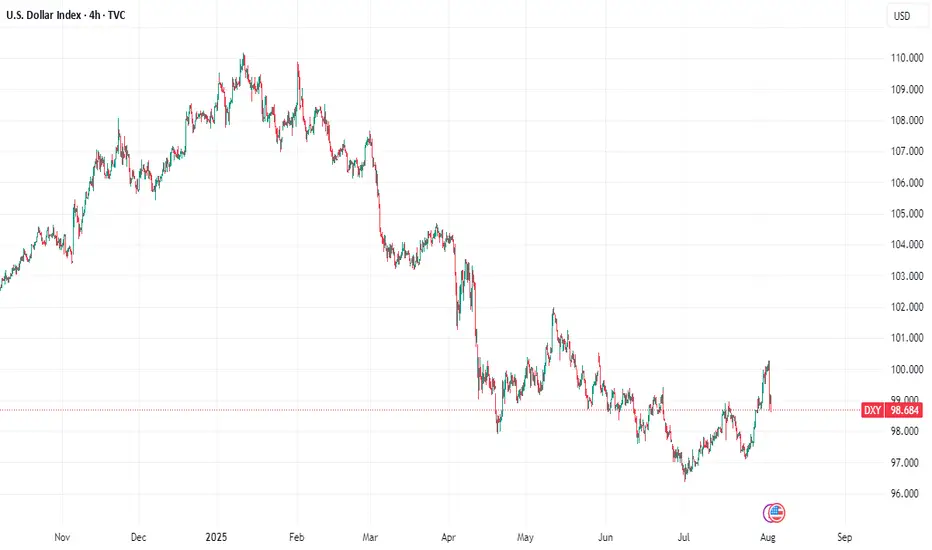
Entry timeframe 4H : Upon retest of the order block, market has got rejected and potentially breaking out of the market structure to continue to drop to support level.
Possible trade recommendation : Bearish entry with SL above sessions high

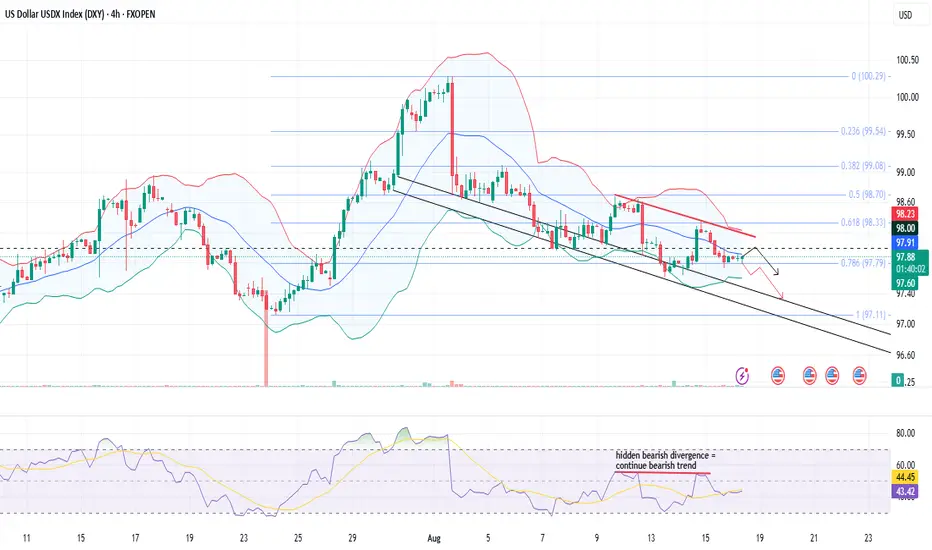
DXY Comprehensive AnalysisThe US Dollar Index (DXY) on the 4H chart remains under pressure, trading near 97.71 and holding below the key resistance zone of 98.20–98.30, aligned with the 20 SMA (middle Bollinger band) and 0.786 Fibonacci retracement (97.78), signaling a firm bearish bias.
Price action might continue to respect the descending trend, with recent candles showing rejection from the upper boundary and pointing toward a possible retest of 97.50–97.10 support levels. However, it will be crucial for prices to breach the fib level 0.786 and sustain lower.
Bollinger Bands are moderately compressed, suggesting controlled volatility, while RSI at 42 indicates weak momentum with a hidden bearish divergence (prices making lower highs and RSI making constant highs), reinforcing downside potential.
Unless the index reclaims 98.30 on strong buying, intraday traders may look for short opportunities on pullbacks, targeting 97.50 and then 97.10.
With no major data releases today, technical levels are likely to drive moves, and continued dollar weakness could support risk assets like equities and commodities, particularly gold and emerging market currencies.
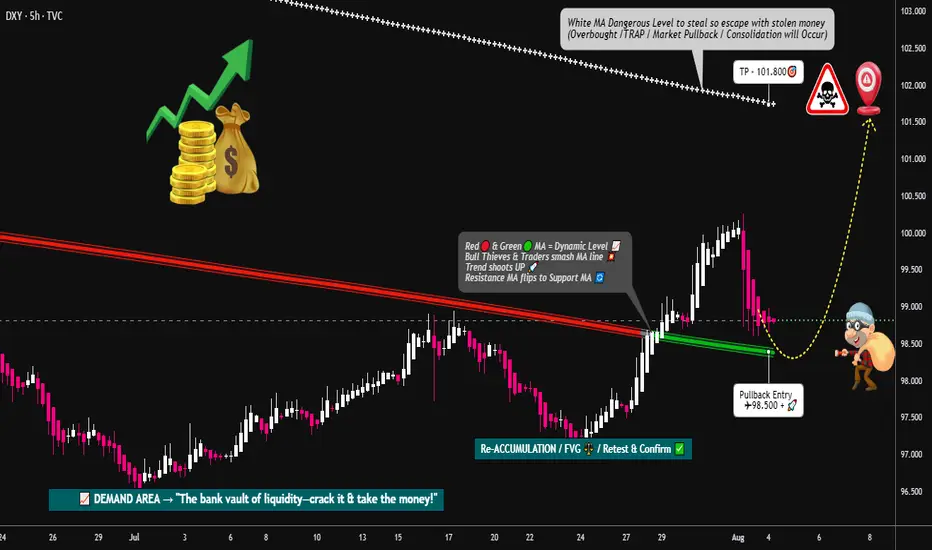
DXY Locked & Loaded: Robber's Gameplan for Profit Pullout💸💼 "DXY Market Heist Blueprint – The Thief's Bullish Escape Plan" 💼💸
Rob the Market, Not the Rules – Trade Smart, Trade Sharp, Trade Thief Style™
🌍 Hey Money Makers, Risk Takers & Market Robbers!
Hola! Ola! Bonjour! Hallo! Marhaba! 🙌
Let’s break into the DXY vault and swipe those profits with precision. 💼💸
🧠💡This Thief Trading Style™ Master Plan is a high-stakes operation backed by technical setups, macro-fundamentals, and robbery-level insights. Follow the blueprint laid out on the chart. Our target? The High-Risk Yellow ATR Zone – where the real treasure is buried.
💼 ENTRY: "The Vault Is Open – Grab the Bullish Bags!"
Enter long as price approaches key pullback levels within a 15–30 min timeframe. Use the most recent candle wick’s swing low/high for sniper-style DCA entries.
🔑 Layer multiple limit orders like a thief stacking getaway bags (aka the DCA / Layering Method). Be patient and precise.
🛑 STOP LOSS: "Don’t Get Caught by the Market Police"
📍 Place SL just below the nearest 4H swing low (example: 97.300) depending on your strategy (scalping/swing).
⚖️ Your SL should reflect your risk appetite, lot size, and how many limit orders you’re running. Thieves don’t risk it all on one job. 🎭
🎯 TARGET: 101.800 (or Escape Before the Sirens)
Once the target zone nears, decide whether to collect full loot or exit before resistance hits. We trade smart, not greedy. 🧠💰
📈 Why This Heist Makes Sense: Market Conditions Breakdown
Bullish momentum supported by macro drivers and intermarket forces
COT report and sentiment leaning in favor of USD
Dollar Index structure showing signs of reversal + trend confirmation
Consolidation trap zones hinting at institutional accumulation
💡 This is not just a blind entry—it's a well-researched and time-tested plan. Check the chart details and refer to:
🔗 Fundamentals | COT Reports | Sentiment Score | Quantitative Outlook
🚨 NEWS & POSITION MANAGEMENT ALERT
Before jumping in, beware of high-impact news!
🗞️ To keep your trades safe and stress-free:
Avoid opening new positions during major news releases
Use trailing SLs to protect gains
Monitor volatility triggers (economic calendar is your best friend!)
🏴☠️💥 BOOST THE ROBBERY – Hit That Like/Boost Button
The more you boost, the stronger the heist crew becomes! 💪🚀
Help fellow traders steal opportunities with the Thief Trading Style™ – calculated, bold, and sharp.
🔥 Let's continue to outsmart the markets and make each trade count. Stay tuned for the next heist update – fresh trades, deeper insights, and bigger bags. 🤑💼
🔔 Disclaimer: This plan is not financial advice. Use it for educational and entertainment purposes. Always conduct your own analysis and manage risk accordingly.
📌 Markets shift quickly. Stay adaptable, informed, and always ready to pivot.
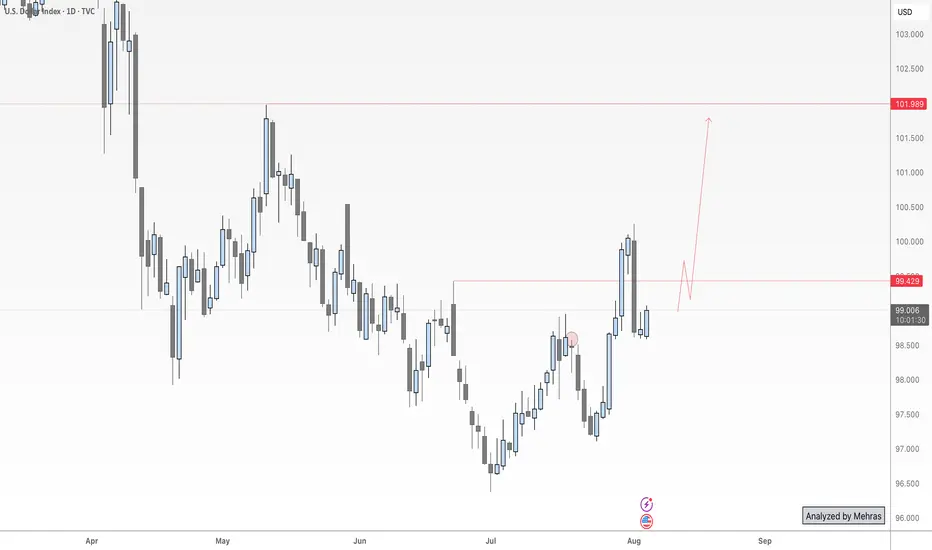
Dollar Index Update – Holding Gains After NFP Data📈 DXY Outlook – Ready for the Next Leg Up?
Last Friday, as NFP data hit the market, I published an analysis highlighting this exact move—and so far, price has respected the roadmap perfectly.
Now, with momentum building and structure aligning, the Dollar Index looks poised to continue its bullish run—first toward the 101 zone and potentially higher toward 102.
But here’s the key point for swing traders and risk-conscious setups:
🔍 If we’re aiming for higher targets with minimal drawdown, tonight’s daily candle close will be crucial.
A bullish close above yesterday’s high would not only confirm strength, but significantly reduce entry risk for long positions.
So, whether you’re already in the trade or waiting for confirmation, patience tonight could pay off.
Let’s see if the bulls can seal the deal with a strong daily close.
🔁 This analysis will be updated whenever necessary.
Disclaimer: This is not financial advice. Just my personal opinion.
DXY to go extremely low due to Tariffs and Market ManipulationDXY to go extremely low due to Tariffs and Market Manipulation Reports
- The US Debt is almost over $38 Trillion in under 3 months
- Continue to monitor for weekly bearish signals on the chart
TVC:DXY
OANDA:USDCAD
OANDA:NZDUSD
DXY Analysis todayHello traders, this is a complete multiple timeframe analysis of this pair. We see could find significant trading opportunities as per analysis upon price action confirmation we may take this trade. Smash the like button if you find value in this analysis and drop a comment if you have any questions or let me know which pair to cover in my next analysis.

Dollar Falls as Traders Price In Two 2025 Rate Cuts on Weak JobsDollar Falls as Traders Price In Two 2025 Rate Cuts on Weak Jobs Data
Introduction
In a significant turn of events for the global currency markets, the U.S. dollar has taken a sharp tumble as traders brace for a more dovish Federal Reserve. A weaker-than-expected U.S. employment report for July 2025 has prompted market participants to price in two interest-rate cuts by the Fed before the end of the year. This shift in monetary policy expectations comes during a time of heightened global uncertainty, much of it triggered by President Donald Trump's aggressive trade policies, which have already disrupted the $7.5 trillion-a-day foreign exchange market.
The Bloomberg Dollar Spot Index, a key gauge of the dollar’s strength against major currencies, plunged as much as 1%—marking its worst single-day performance since April 21, 2025. The greenback’s decline was mirrored by strong gains in rival currencies, with the Japanese yen appreciating 2.2% and the euro climbing more than 1% against the dollar.
This article delves into the recent developments surrounding the U.S. dollar, the implications of weak jobs data, the Federal Reserve’s likely response, and how Trump’s trade policies are shaping the broader economic landscape.
________________________________________
Weak Jobs Data Sparks Policy Shift
The July 2025 employment report came in well below expectations. Non-farm payrolls growth fell short, and revisions for May and June showed fewer jobs were added than previously reported. These figures suggest that the U.S. labor market is cooling more rapidly than anticipated, raising concerns about the sustainability of the post-pandemic economic recovery.
According to Helen Given, a foreign exchange trader at Monex Inc., “It’s now clear that the U.S. labor market is cooling fairly sharply. There’s a good chance that Trump’s crusade against Chair Powell ratchets up further in the coming days, and there could be further losses for the dollar to come as a result.”
The disappointing employment data has led traders to adjust their expectations for U.S. monetary policy. Futures markets are now pricing in two 25-basis-point rate cuts by the end of 2025, a stark reversal from the earlier outlook that suggested the Fed would remain on hold or even consider tightening if inflation remained sticky.
________________________________________
The Federal Reserve’s Dilemma
The Federal Reserve now finds itself in a precarious position. On one hand, inflation has moderated in recent months, giving the central bank more room to maneuver. On the other hand, a weakening labor market could indicate a broader slowdown that might require immediate action to prevent a recession.
Fed Chair Jerome Powell has come under increasing political pressure from President Trump, who has publicly criticized the Fed for keeping rates too high. Trump argues that rate cuts are necessary to support U.S. exporters and counteract the negative effects of his own tariffs and trade restrictions.
Historically, the Fed has maintained its independence from political influence, but in an election year, the pressure to act can become intense. If the Fed moves to cut rates, it will be seen as responding to both economic data and political dynamics—a delicate balancing act.
________________________________________
The Global Currency Market Reacts
The ripple effects of the dollar’s decline are being felt across the globe. The $7.5 trillion-a-day foreign exchange market, already under strain from geopolitical uncertainty and shifting central bank policies, has seen increased volatility in recent weeks.
The Japanese yen, often viewed as a safe-haven currency, surged 2.2% against the dollar following the release of the jobs data. Meanwhile, the euro gained over 1%, reflecting investor sentiment that the greenback’s era of dominance may be waning—at least for now.
Emerging market currencies also found some relief, as a weaker dollar generally eases pressure on countries with large dollar-denominated debts. However, the overall picture remains complex, as trade tensions and capital flow volatility continue to weigh on risk sentiment.
________________________________________
Trump’s Trade Policies: A Double-Edged Sword
President Trump’s trade strategies have been a central feature of his second term in office. From imposing tariffs on Chinese imports to renegotiating trade agreements with the European Union and Canada, Trump has sought to reshape the global trading system in favor of American manufacturers.
Yet these policies have produced mixed results. While some sectors have benefited from protectionist measures, others—particularly those reliant on global supply chains—have suffered from rising costs and retaliatory tariffs. The uncertainty generated by these policies has also dampened business investment, slowed global trade, and disrupted financial markets.
“The dollar had tumbled this year as Trump’s aggressive trade policies rocked the $7.5 trillion-a-day currency market, weighing on global growth outlook,” Bloomberg reported.
Investors are increasingly concerned that continued trade friction, combined with growing political pressure on the Fed, could lead to policy missteps that undermine the U.S. economy and erode confidence in the dollar.
________________________________________
Market Implications
The dollar’s recent decline has far-reaching implications for various asset classes:
1. Equities
U.S. equities have shown mixed reactions. While lower interest rates are typically supportive of stock prices, the underlying reason—economic weakness—has investors on edge. Sectors such as technology and consumer discretionary are expected to benefit from cheaper borrowing costs, but cyclical sectors may struggle if growth slows further.
2. Bonds
Treasury yields have fallen sharply as traders anticipate rate cuts. The 10-year yield dropped below 3.8%, its lowest level in months. The yield curve has also flattened, a potential warning sign of slowing economic momentum.
3. Commodities
A weaker dollar typically supports commodity prices, as most are priced in dollars. Gold, oil, and industrial metals all saw gains in the wake of the jobs report. However, demand-side concerns stemming from a global slowdown could limit the upside.
4. Emerging Markets
For emerging markets, a softer dollar offers both relief and risk. On the positive side, it reduces debt servicing costs and can attract capital flows. On the negative side, if the dollar’s weakness reflects a broader global slowdown, risk appetite could remain subdued.
________________________________________
Looking Ahead: What to Watch
As markets digest the latest economic data and policy signals, several key developments will be closely monitored:
1. Upcoming Fed Meetings
The Federal Open Market Committee (FOMC) will meet again in September. Markets will be keenly watching for any changes in tone or new forward guidance. A rate cut in September now appears increasingly likely, especially if subsequent data confirms a labor market slowdown.
2. Inflation Trends
While inflation has moderated, it remains a key concern for policymakers. If inflation rebounds unexpectedly, it could complicate the Fed’s ability to cut rates without stoking price pressures.
3. Geopolitical Risks
Trade tensions, particularly with China and the EU, remain unresolved. Any escalation could further destabilize markets and weigh on the dollar. Additionally, developments in the Middle East, Eastern Europe, and Southeast Asia could add to the uncertainty.
4. U.S. Presidential Politics
With the 2026 presidential election campaign already underway, Trump’s rhetoric and policy decisions will continue to influence market sentiment. His ongoing criticism of the Fed could erode confidence in U.S. institutions, particularly if it leads to perceived politicization of monetary policy.
________________________________________
Conclusion
The sharp fall in the U.S. dollar following weak July jobs data marks a pivotal moment in 2025’s economic narrative. With traders now pricing in two Federal Reserve rate cuts by year-end, the stakes have never been higher for policymakers, investors, and political leaders.
While a softer dollar can provide some temporary relief to exporters and boost inflation expectations, it also reflects deeper concerns about the strength of the U.S. economy and the unintended consequences of aggressive trade policies. President Trump’s confrontational approach to global trade, combined with mounting pressure on the Fed, is creating a complex and potentially volatile environment for markets.
As the year progresses, all eyes will be on the Federal Reserve’s response, the resilience of the U.S. labor market, and the evolving political landscape. In a world where headlines can move markets in seconds, clarity, stability, and sound policy have never been more critical.
________________________________________
Disclaimer: This article is for informational purposes only and does not constitute financial or investment advice.
DXY - Possible Down Swing to continue furtherTVC:DXY
CMCMARKETS:USDCAD
OANDA:NZDUSD
CMCMARKETS:EURUSD
We may have a further down swing pattern forming let's continue to see if it passes the resistance area.
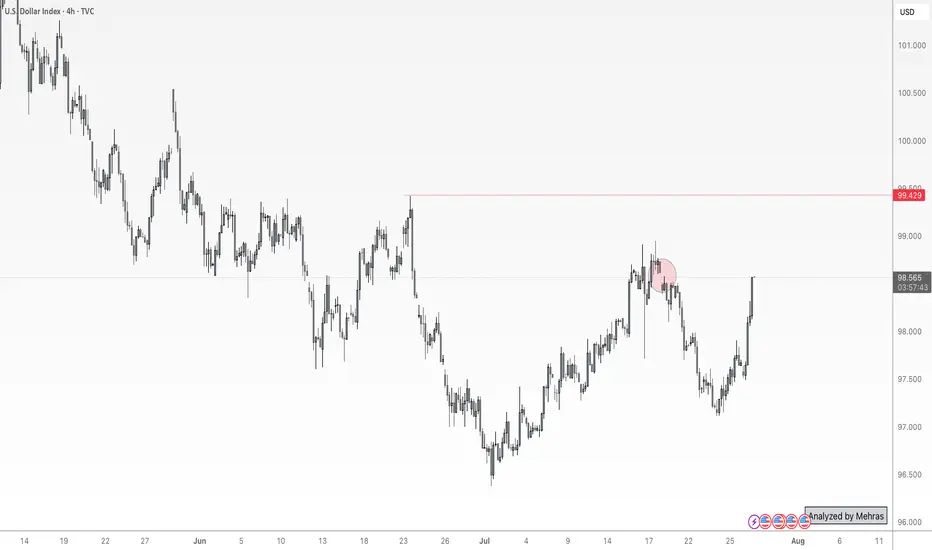
DXY Bulls Ready — Can Powell Spark the Rally?📊 DXY Pre-FOMC Outlook
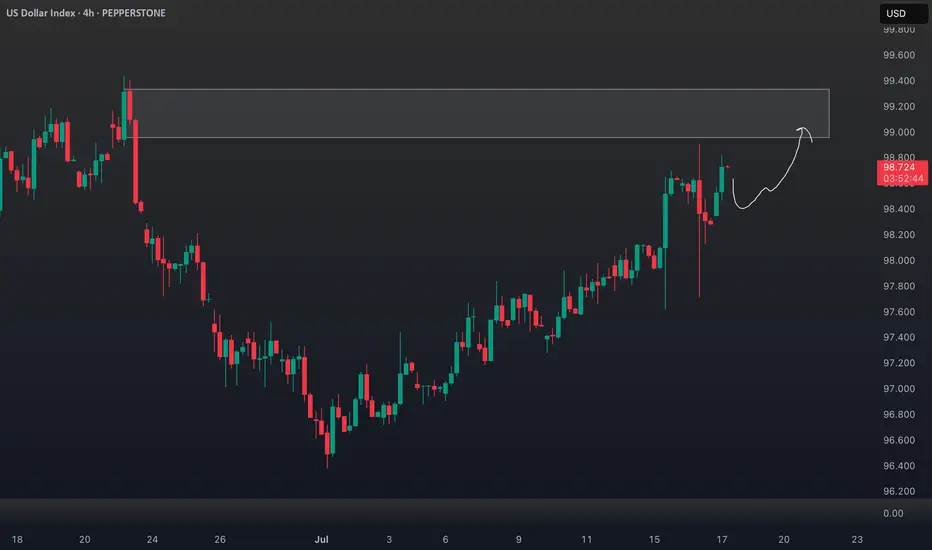
In my previous analysis released on Monday, I expected the Dollar Index to fill the gap around the 98.60 zone and range below the key red line at 99.429.
Now, with less than 8 hours left until the highly anticipated FOMC rate decision, it’s time to take a closer look at tonight’s event and what it could mean for the markets.
From a purely technical perspective — setting the news aside — the Dollar Index looks ready to break through the crucial 100 level and kick off a strong bullish rally.
However, recent political pressure from Trump urging rate cuts, along with visible tension between him and Fed Chair Jerome Powell, has created uncertainty. If it weren’t for these conflicting signals, I would’ve confidently expected a clean breakout above 100.
As much as I enjoy trading news-driven events, I’ll likely stay out of the market tonight and observe from the sidelines. The setup is tempting, but the dual narratives make it risky.
That said — if you ask for my final take — I believe the stage is fully set for a bullish dollar and a corresponding drop in gold, EUR, GBP, and other major assets.
Let’s see how it plays out. 👀💥

DXY still in downward channel. Rejection here = BTC rally The DXY is still in a downward sloping channel and trying to break back above the previous 2-year cycle low, but I think will reject here and kick off the next leg of the BTC rally.
Ideally we get a big DXY drop and ultimately break below the 95% level and on down into 'Bitcoin Super Rally Zone'🚀

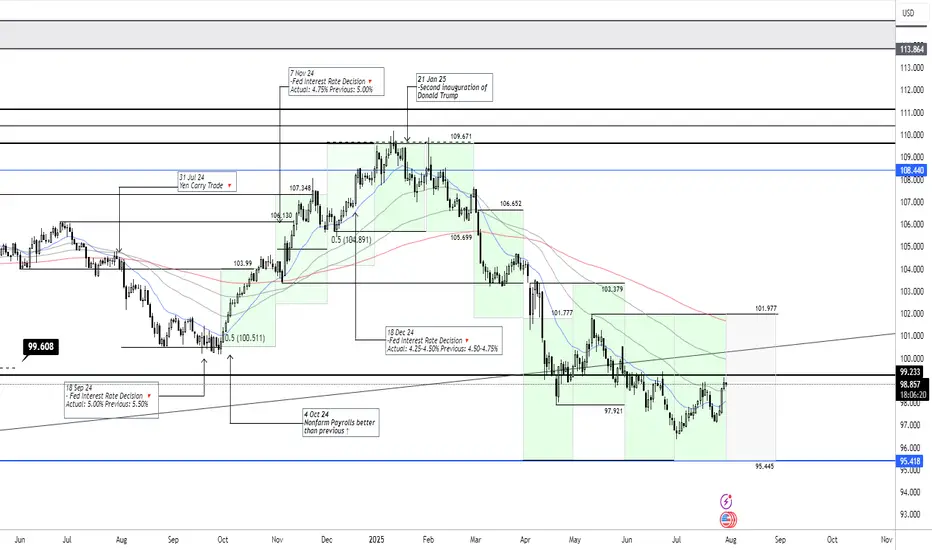
DXY July 30 2025The US dollar remains within the projected trading band, and we expect it to continue fluctuating within this range over the coming month.
Monthly Target: 95.445-101.977
Dollar Index - Expecting Bullish Continuation In The Short TermH4 - Strong bullish momentum followed by a pullback.
No opposite signs.
Until the two Fibonacci support zones hold I expect the price to move higher further.
If you enjoy this idea, don’t forget to LIKE 👍, FOLLOW ✅, SHARE 🙌, and COMMENT ✍! Drop your thoughts and charts below to keep the discussion going. Your support helps keep this content free and reach more people! 🚀
--------------------------------------------------------------------------------------------------------------------

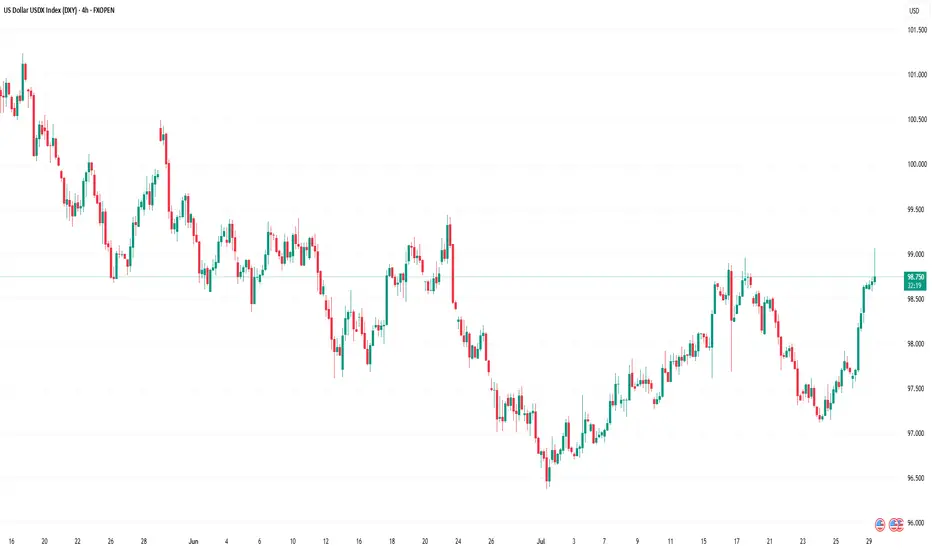
US Dollar Index (DXY) Reaches One-Month HighUS Dollar Index (DXY) Reaches One-Month High
The US Dollar Index (DXY) has risen to its highest level since early July. According to media reports, the bullish sentiment in the market is driven by the following factors:
→ Optimism around US trade agreements. A new trade deal with the EU — which includes a 15% tariff on European goods — is being perceived by the market as favourable for the United States.
→ Confidence in the resilience of the US economy. Strong Q2 corporate earnings have acted as an additional bullish catalyst. Investors may have started covering short positions against the dollar, viewing concerns over a US slowdown as overstated.
→ Expectations that the Federal Reserve will keep interest rates on hold.
From a technical standpoint, today’s DXY chart reflects strengthening bullish momentum.
Technical Analysis of the DXY Chart
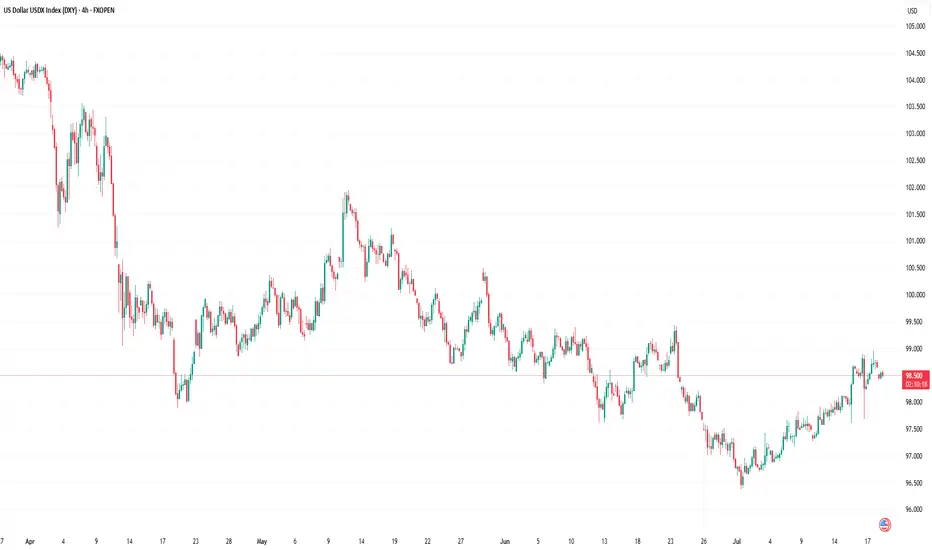
Two U-shaped formations (A and B) that developed over the summer have created a bullish сup and рandle pattern — a formation that suggests waning bearish pressure, as evidenced by the shallower second dip.
This setup points to the potential for a bullish breakout above the trendline (marked in red) that has defined the downward movement in the DXY throughout the first half of 2025.
As previously analysed, there are signs that the dollar index may have found a base following a period of decline. This could indicate a shift in market sentiment and the possible end of the recent bearish phase.
This article represents the opinion of the Companies operating under the FXOpen brand only. It is not to be construed as an offer, solicitation, or recommendation with respect to products and services provided by the Companies operating under the FXOpen brand, nor is it to be considered financial advice.
DXY at Its Most Critical Level of 2025 — Will the 100 Bank LevelThe Dollar Index (DXY), just like several other majors, is approaching a very important level. We’re now near the 100 mark, which is not only a psychological level — but also a key institutional (bank) level.
There’s also a gap zone left behind that price is about to fill. I believe the index will stay in a range over the next 1–2 days as it waits for critical data later this week — especially Wednesday’s announcements and Friday’s NFP report, which could set the tone for what’s next.
Based on current market sentiment, Trump’s remarks, Powell’s upcoming speech, and broader macro factors, I believe DXY has the potential to break above 100 and move toward 102–104, if that level is broken cleanly.
Let’s also not forget — price bounced from a monthly demand block near 96, and we’re seeing weak support across majors like EUR and Gold. That adds confluence for potential dollar strength.
📌 What do you think — is dollar strength just around the corner?
🔁 This analysis will be updated whenever necessary.
Disclaimer: This is not financial advice. Just my personal opinion.
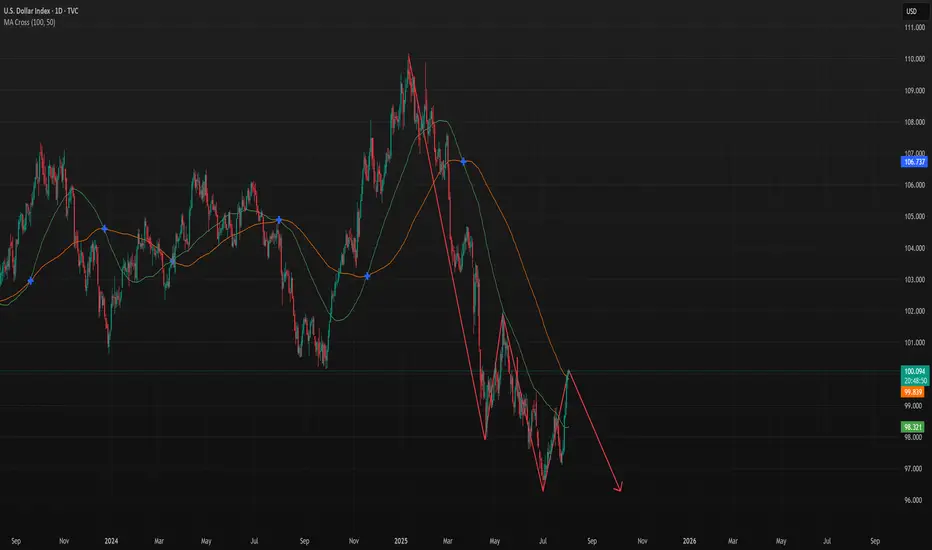
DXY 1D – Tipping Point: News or Price Action?Hey Guys,
The DXY index is currently moving within a downtrend. This trend is unlikely to reverse unless it breaks above the 98.950 level.
Sure, key fundamental data could shift the trend, but without those news catalysts, a reversal at this point doesn’t seem realistic.
Don’t forget—98.950 is a critical threshold for the DXY.
I meticulously prepare these analyses for you, and I sincerely appreciate your support through likes. Every like from you is my biggest motivation to continue sharing my analyses.
I’m truly grateful for each of you—love to all my followers💙💙💙

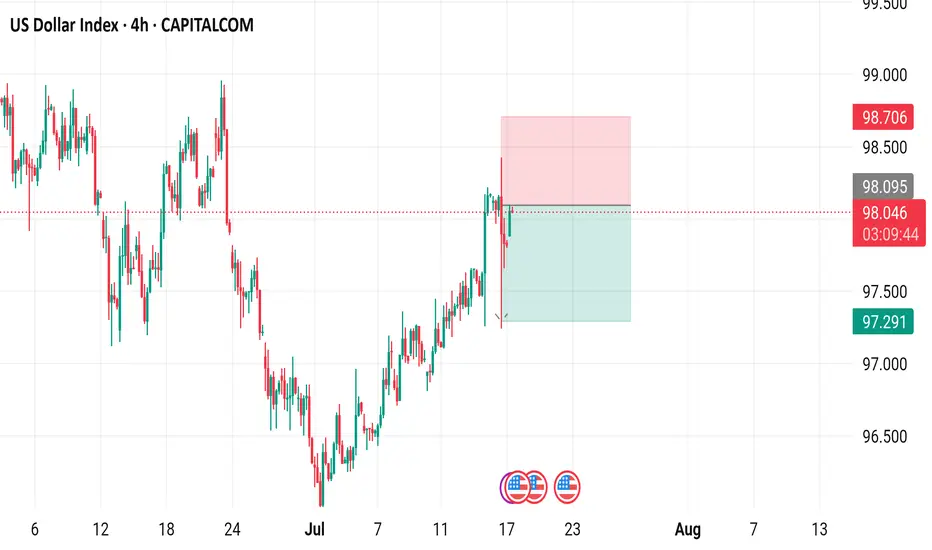
US Dollar Index (DXY) - 4 Hour Chart4-hour performance of the US Dollar Index (DXY) from CAPITALCOM, showing a current value of 98.040 with a 0.23% increase (+0.222). The chart includes recent buy and sell signals at 98.094 and 98.040, respectively, with a highlighted resistance zone around 98.706-99.000 and a support zone around 97.291-98.040. The timeframe covers data from early July to mid-August 2025.
DXY Eyes Breakout – Dollar Strength Gaining GroundThe U.S. Dollar Index (DXY) is testing its 50-day moving average on the daily chart, with bulls eyeing a potential breakout. A move above 98.75 could confirm a short-term trend reversal and open the path for further gains.
Stronger-than-expected U.S. economic data continues to support the greenback. Recent inflation prints, job market resilience, and solid retail spending have pushed back expectations for imminent Fed rate cuts. This shift in rate outlook provides fundamental support for the dollar.
In addition, strong U.S. corporate earnings are bolstering equity markets, attracting capital flows into U.S. assets and indirectly supporting dollar demand. Rising Treasury yields, especially on the short end, also offer more attractive returns for dollar-based investments.
Geopolitical uncertainties and trade tensions in Asia and Europe are prompting a rotation into the dollar as a safe-haven currency.
Meanwhile, some emerging market currencies are under pressure, increasing global demand for dollar liquidity.
Technically, a close above 98.75 could confirm bullish momentum, with 99.80 as the next upside target. As long as macro and risk dynamics lean in the dollar’s favor, DXY may continue its rebound from recent lows.
US Dollar Index (DXY) Chart AnalysisUS Dollar Index (DXY) Chart Analysis
The addition of the US Dollar Index (DXY) to FXOpen’s suite of instruments offers traders potential opportunities. This financial instrument:
→ serves as a measure of the overall strength of the US dollar;
→ is not tied to a single currency pair but reflects the value of the USD against a basket of six major global currencies, including the EUR, JPY, and GBP;
→ allows traders to capitalise on price fluctuations in the currency market;
→ is used in more advanced strategies for hedging risks in portfolios sensitive to sharp movements in the US dollar.
In today’s environment of heightened volatility, this instrument becomes particularly valuable. The active stance of US President Donald Trump — through the implementation of trade tariffs, sanctions, and unpredictable geopolitical rhetoric — gives traders even more reason to closely monitor the DXY chart.
Technical Analysis of the DXY Chart
Moving averages show that the US Dollar Index displayed a predominantly bearish trend during the first half of 2025.
However, the picture shifted in July: the index began rising steadily (already up approximately +1.9% since the beginning of the month), highlighted by the blue ascending trend channel.
This suggests that the DXY may have found support following a prolonged decline, and a shift in market sentiment could be underway: after a bearish phase, a period of consolidation may follow. If this scenario plays out, we could see DXY oscillating between the 97.65 and 99.30 levels – both of which show signs of acting as support and resistance (as indicated by the arrows).
This article represents the opinion of the Companies operating under the FXOpen brand only. It is not to be construed as an offer, solicitation, or recommendation with respect to products and services provided by the Companies operating under the FXOpen brand, nor is it to be considered financial advice.
DXY Outlook: Bullish Move Fueled by Fundamentals & GeopoliticsTechnical Analysis (4H Chart & Broader Context) 📈🕓
The DXY 4H chart shows a clear bullish trend 🚀, with higher highs and higher lows since early July. DXY has caught a strong bid, breaking above short-term resistance near 98.40 and now eyeing the previous swing high 🎯. This matches the consensus among analysts: DXY remains in a bullish structure, with momentum supported by both technicals and macro factors.
Key resistance: Next upside target is the previous high (around 99.60 on the chart), with further resistance at the psychological 100 level 🏁.
Support: Immediate support at 98.20, then 97.60 🛡️.
Momentum: Strong bullish candles and no major bearish reversal signals on the 4H. Some analysts note positioning is stretched, so a short-term pullback or consolidation is possible before more upside (IG).
Fundamental Analysis 💹🌍
Why is DXY rallying?
Fed Policy & US Data: The US economy is resilient 💪, with robust services data, strong retail sales, and a recent uptick in core inflation. The Fed is less dovish, with markets now expecting a slower pace of rate cuts 🏦.
Interest Rate Differentials: The US keeps a yield advantage as the Fed is less aggressive in cutting rates compared to the ECB and BoJ, especially with Europe and Japan facing weaker growth and possible further easing 🌐.
Geopolitical Factors: Ongoing trade tensions (Trump’s tariff threats) and global uncertainty (including Middle East risks) are driving safe-haven flows into the dollar 🛡️🌏. DXY typically strengthens during periods of geopolitical stress.
Positioning: CFTC data shows USD long positioning at multi-month highs, which could mean the market is crowded and vulnerable to short-term corrections ⚠️ (IG).
Trade Idea (Bullish Bias, Targeting Previous High) 💡💵
Setup:
Bias: Bullish, in line with the prevailing trend and macro backdrop 🟢.
Entry: Consider buying on a minor pullback to the 98.20–98.40 support zone, or on a confirmed breakout above the recent high 🛒.
Target: Previous swing high near 99.60, with a stretch target at 100.00 🎯.
Stop: Below 97.60 (recent swing low/support) ⛔.
Risk Factors:
Overbought positioning could trigger a short-term pullback ⚠️.
Any dovish surprise from the Fed or rapid de-escalation in global tensions could cap further gains 🕊️.
In summary: The DXY’s bullish trend is underpinned by resilient US data, a hawkish Fed, and global risk aversion. Your bullish bias is well-supported, with the previous high as a logical target. Watch for short-term pullbacks, but the broader trend remains up unless key support is lost. 🚦
Dollar Index Having Bullish MomentumDollar Index shown good bullish momentum on previous day as we analyzed it earlier. Index has created a imbalance now the possibility for the index is to retrace back to imbalance and continue the bullish momentum and target towards the supply zone and swing high.

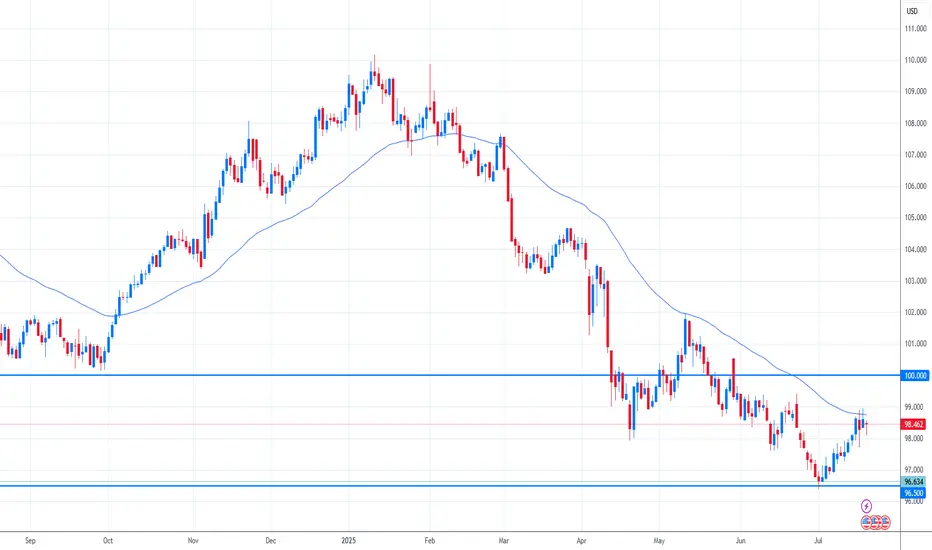
DXY Tests Key Support – What’s Next for the Dollar?
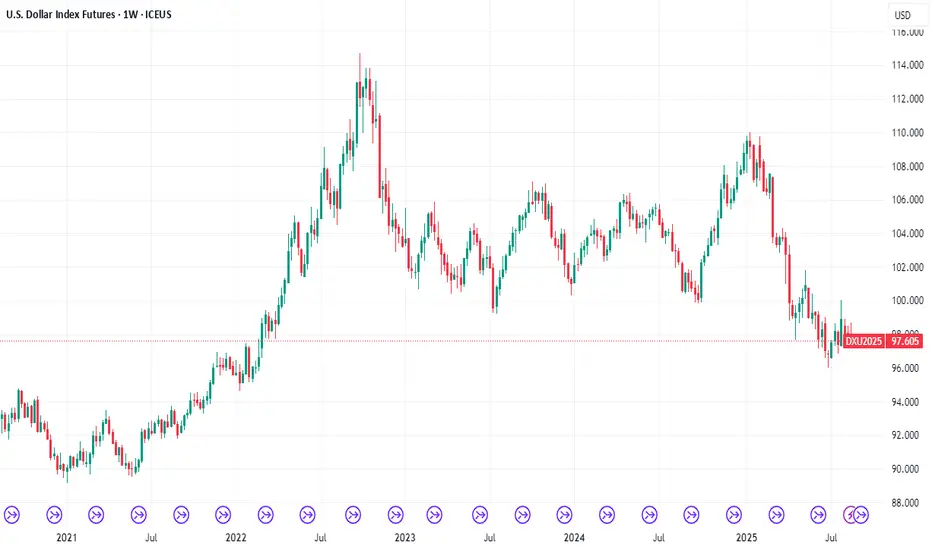
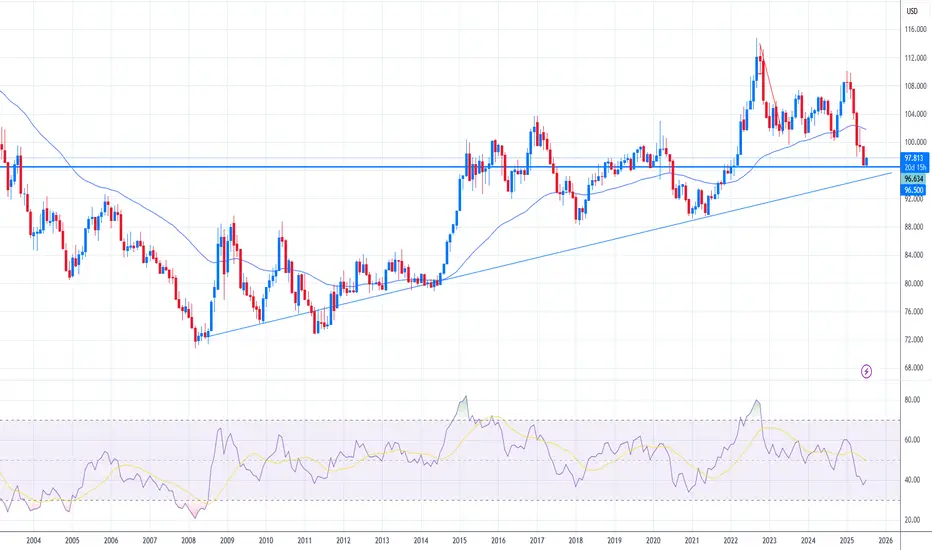
The U.S. Dollar Index (DXY), which tracks the dollar’s performance against a basket of major currencies, recently broke below its 50-month moving average based on the monthly chart —a significant technical signal. After this drop, the index is now bouncing off a key support zone near 96.50.
This area has acted as a pivot point in past cycles, and a sustained bounce could indicate the dollar regaining strength. If risk sentiment fades—due to weaker equity markets, geopolitical tensions, or stronger U.S. data—the dollar might find new momentum.
On the flip side, failure to hold 96.50 could open the door toward the 90.00 zone, a major long-term support level. Such a move would likely reflect expectations of looser U.S. monetary policy or further deterioration in economic confidence.
For now, price action near 96.50 will be decisive. A rebound could shift sentiment back in favor of the dollar, while a deeper decline may trigger broader adjustments in FX markets. Traders should closely monitor upcoming macro data and risk sentiment for cues on the next leg.
DXY Potential Bullish Reversal – Target 99.456 DXY Potential Bullish Reversal – Target 99.456 🎯
Technical Analysis Overview:
🔹 Trend Structure:
The chart illustrates a recent downtrend, which has been broken as price moved above the descending trendline, signaling a potential trend reversal.
🔹 Pattern Insight:
A bullish harmonic pattern is visible (possibly a bullish Bat or Gartley), with the price reacting from the PRZ (Potential Reversal Zone), aligning with key support near 96.500. The market has respected this zone multiple times, evident from the orange highlighted circles showing price rejections.
🔹 Support & Resistance:
Support Zone: ~96.500
Breakout Zone: ~96.985 (current consolidation near this resistance)
Target Zone: Marked at 99.456, which aligns with previous structure and fib projection.
🔹 Market Sentiment:
Price is consolidating after breaking the downtrend, forming a bullish rectangle (accumulation). The green arrows indicate bullish intent from buyers defending support levels.
🔹 Price Action Signal:
Formation of higher lows.
Break of structure and close above previous highs.
Possible breakout pending above consolidation box.
📊 Conclusion:
DXY shows bullish potential as it builds a base around strong support. A confirmed breakout above the rectangle could fuel a rally toward 99.456. Keep an eye on volume and confirmation candles for entry. ✅
