DXY - Update Ol, so the DXY just won't cool off, right... Well, we need to deal with it then... I think we head up toward 121.500 zone before a massive rejection takes place.
Dxyforecast

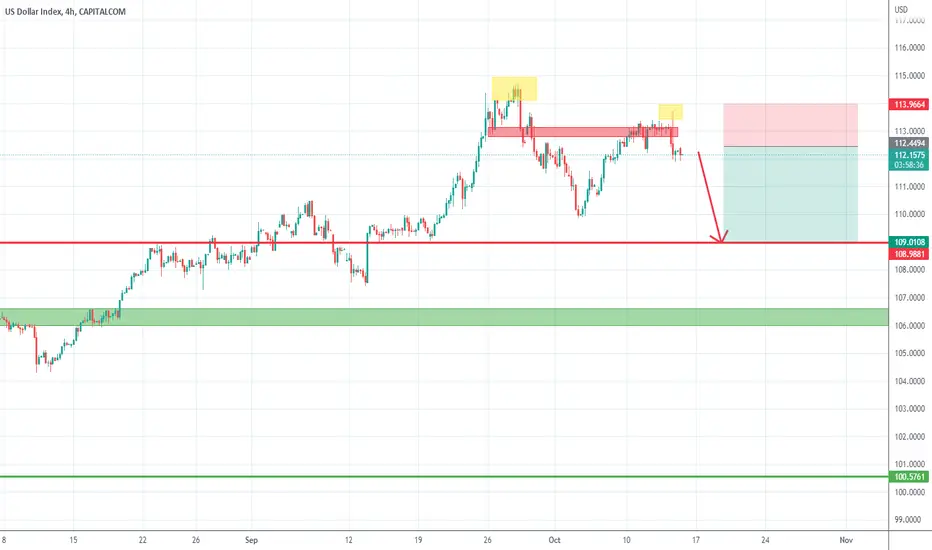
dxy where is the dollar going!dxy did a small sweep above those equal highs and created another order block just recently retested it and fell so break of this dxy higher low were going to start seeing dxy take a nice dip to that 109-110 level

DXY Dollar Next Possible MoveTechnical Analysis Chart Update
DXY - Dollar
Time Frame - H1
We have Bullish Channel Pattern as a Correction in Long Time Frame #LTF and according to that it will Reject from the Lower Trend Line #LTL and Current Strong Demand Zone
We have Buying Divergence in #RSI
It is also Following the Elliot waves in Short Time Frame #STF and it has completed " 1234 " Impulsive waves and it will Complete its " 5 " Impulsive wave at Daily Resistance Level

DXY- Lower high in place. Reversal could followA few days ago I've pointed out the 113 zone as a strong resistance and potential point of reversal for DXY.
The market's reaction after CPI data yesterday could offer exactly this: a confirmation for reversal.
Although on data release DXY has spiked above this important level, a very strong reversal followed, leaving a long-tailed candle on our chart, and, now, there is a high probability of a lower high in place.
With this in mind, we can search for buying opportunities for EurUsd, GbpUsd, AudUsd, and NzdUsd.
DXY first important support is under 110
dxy is not done!!!theres equal highs here so i beleive we see a test to that orderblock which is right by a key pivot level dxy still has a bit more upside when it gets to that level ill see what it does but if bears come in we could finally see dxy make a nice move down but until then its not done yet !!!!

💵U.S.Dollar Currency💵 Index Analyze (Road Map)!!!🗺️U.S.Dollar Currency Index ( DXY ) was able to break the Important Resistance Line , and I expect that DXY will grow UP at least over Resistance Zone , and then we will see the pullback to Resistance Zone by microwave 4 of Main wave 5 .
After this happens, we will probably see the end of the Main wave 5 at my TRZ (Time Reversal Zone) and on top of the Ascending Channel .
U.S.Dollar Currency Index ( DXY ) Analyze Timeframe Monthly (Log Scale).
Do not forget to put Stop loss for your positions (For every position that you want to open).
Please follow your strategy , this is just my idea, and I will be glad to see your ideas in this post.
Please do not forget the ✅' like '✅ button 🙏😊 & Share it with your friends; thanks, and Trade safe.

DXY (High Probability Buy Setup soon)The U.S. Dollar Currency Index (DXY) is showing continuing strong BULLISH move towards ATH of 114.773 of Mon 26 Sep '22, with U.S. inflation figures out later on today are in the spotlight, with the data expected to reinforce bets that the Feds will continue to tighten policy aggressively, hence extra strength to the DXY.
Keep a close eye on DXY today, happy pip hunting traders.

DXY aka USdollar aka dollar indextheres liquidity on both sides equal highs and lows price been here before and failed to break the low creating that equal low so i believe it will sweep orders up top before fully heading down unless it breaks those lows soon and it will keep pushing down
look at previous equal highs and lows and see how it swept out liquidity b4 the actual moves

DXY Daily TA Neutral BullishDXY Daily guidance is neutral with a bullish bias. Recommended ratio: 58% DXY, 42% Cash.
*DXY, VIX, Nat Gas, EURUSD and Agriculture are up while US Treasuries, Equities, Futures, Cryptos, Metals, Oil, GBPUSD, CNYUSD and JPYUSD are down. Cleveland Fed President Mester mentioned today in New York that there has been little to no progress on ringing in inflation and that she supports a higher than 4.75% federal funds rate in 2023 if the data warrants it. Earlier today Putin met with UAE President MBZ and both praised the oil production cut by OPEC+ . Key Upcoming Dates: FOMC Minutes at 2pm EST 10/12; September US CPI at 830am EST 10/13; September US Retails Sales at 830am EST 10/14; 18th GDPNow US Q3 GDP Estimate 10/14; UofM October Consumer Sentiment Index at 10am EST 10/15.*
Price is currently attempting to keep trending up at ~$113.20 after bouncing from $110 minor support last week, the next resistance is the upper trendline of the ascending channel from October 2008 at ~$114.25 which is just below $114.62 resistance. Parabolic SAR flips bullish at $113.87, this margin is bullish. RSI is currently forming a soft peak at 62 and is still technically testing 59 resistance. Stochastic remains bullish and is currently forming a soft peak at ~45.5, the next resistance is at 50.60. MACD is currently on the verge of crossing over bullish at 0.93, the next resistance is at 1.24 and support at 0.65. ADX is currently trending down slightly at 28 as Price continues pushing up, this is mildly bearish at the moment; if it is able to form a trough as Price pushes higher, this would be bullish.
If Price is able to keep pushing higher then it will likely retest the upper trendline of the ascending channel from October 2008 at ~$114.25 as resistance before potentially retesting $114.62 resistance . However, if Price breaks down here, it will likely retest $110 minor support . Mental Stop Loss: (one close below) $112.38.

DXY - Feds Gone Louco ModeFeds keep printing MOARE of that junk currency we call USD, Los Saudis ain't playing ball no more, they are refusing orders from the yankees if they ever announce a switch to another currency let's say like hmmmmm ze Chinese yuan? or Bitcoin? Then that will be the day the yankee dollar will be going Kansas Bye Bye!
DXY seems to be setting up for a monthly bearish divergence, u know wut happens next right? right?
- Monthly MACD (Bullish)
- Monthly Pekipek's Divergence BETA (Bullish)
- Monthly RSI (Bullish)
- Monthly Stochastic RSI (Bullish)
- Monthly Cipher (Bearish)
- Monthly OBV (OBV gone AWOL)
s3.tradingview.com
s3.tradingview.com
s3.tradingview.com
s3.tradingview.com

dxyon the 15 min just made a lower high lets see if it holds and we get a rejection here at this orderblock on down to the bullish orderblock but this pull back would be healthy due to the massive up move from good nfp news

DXY Dollar Next Week MoveTechnical Analysis Chart Update
DXY - Dollar
Time Frame - H4
Long Time Frame #LTF ( Bullish Channel )
Rejection from the Lower Trend Line #LTL and Reach Current Demand Zone in Short Time Frame #STF
Short Time Frame #STF ( Bearish Channel )
Breakout and Completed the Bullish Impact and Currently at Fibonacci Level - 61.80% if Reject then XAUUSD Buy , If Breaks then XAUUSD Sell

dxy crucial leve;so after that bearish push we have been having dxy pushing up finally in bearish orderblock area where we could see dxy make a nice size move down if its not broken keep eyes on this here this will let you know the next moves on gold and indices

dxy where is the dollar going!so lets talk about dxy here
number 1 dxy is a a trendline also bearish order block also last time equal highs was made and this area has perviously been mitigated so i expect a bulish push here to my next oderblock aka liquidation b4 dxy tries to make any movedown so im looking for dxy to head to areound 112-113 area

DXY Chart Analysis....
In this situation DXY chart Hopefully create bearish butterfly pattern.
So, market need to breakout 111.450 resistance level then market Buy to 112.700
and 114.420 resistance level.

Bullish on DXY Im expecting the dollar to reach up towards the113.00 level. I'll watch for a retracement to the 108.800 level, but if that doesn't occur ill be looking for the dollar to shoot straight up towards that 113 level over the coming weeks. Watch how usdjpy reacts bullish as the dollar continues to be bullish. Once price hits that 113 level, there should be some retracements seeing as that was a 2001 prior low before the dollar began its plunge. it's been strengthening over the past 10 years, so as of now I'm not expecting it to do anything less than that. As always good luck traders and stay focused, follow the money!

DXY Daily TA Cautiously BearishDXY daily guidance is cautiously bearish. Recommended ratio: 30% DXY, 70% Cash.
*DXY, US 10 Year Treasury Bonds and VIX are down while Equities, Cryptos, Commodities, Futures, GBPUSD, EURUSD and 30 Year Treasury Bonds are all up. With expectations of a federal funds rate above 4% in 2023 it's starting to get to that time where investors ask themselves when the continued rates hikes and impending Fed-forced recession will be priced in. Macroeconomic factors aside, geopolitical uncertainties mainly involving Russia and China pose adverse risks in the near-term to medium-term. Key Upcoming Dates: FOMC Member Loretta Mester speaks twice on 10/06; September US Employment Situation at 830am EST 10/07; FOMC Members Kashkari, Waller and Williams speak on 10/07; FOMC Minutes at 2pm EST 10/12; September US CPI at 830am EST 10/13; September US Retails Sales at 830am EST 10/14; UofM October Consumer Sentiment Index at 10am EST 10/15.*
Price is currently trending down at ~$110.40 as it approaches a test of $110 minor support. Parabolic SAR flips bullish at $114.70, this margin is mildly bullish. RSI is currently testing 49.10 minor support and is on the verge of testing the uptrend line from July 2020 at 47.47 as support if it continues down. Stochastic remains bearish and is currently beginning to form a trough as it tests 9.02 support; if it doesn't bounce here it will likely tests max bottom. MACD crossed over bearish today and is currently trending down at 0.90, the next support is at 0.65. ADX is currently trending down at 32 as Price is seeing selling pressure, this is mildly bearish at the moment.
If Price is able to bounce at $110.02 minor support then it will likely aim to retest the upper trendline of the ascending channel from October 2008 at $114.70 resistance . However, if Price breaks down below $110.02 minor support , it will likely retest the 50 MA at ~$108.80 as support . Mental Stop Loss: (one close above) $111.55.

Dxy leading diagonal idea!Macro dxy has lots of bearish div on many timeframes!this pattern looks near to complete! This is the last retracement at the 1.618 same as on wave 3 retracement! There are upper extention levels up to the 120 area but anywhere betwen here and there looks as a double top on weekly chart is forming! Initial target for leading diagonal or accumulation cyllinder is anywhere from the bottom of 2 wave in elliot or the true 1-1 for a double bottom! This may be the end for some time of bearish scenerios in current markets! Dxy corrolated on dumps and pumps at certain times so I would use moving averages as a focal point moving forward such as bullish and bearish crossings of the 21/55 ema and the golden cross of the 55/233 as confirmations !
* Its truly possible we retace .50 or 50% and do one more 1-1 pump of its last move!Watch moving averages they dont lie!

$US DXY Update 10/04/2022The US dollar is losing strength after getting rejected from the 2nd top. It also formed bearish divergence.
Currently, it is holding above the trend-line support and a breakdown below it, would be a bearish confirmation for it and if it gave a close above 2nd top then that would confirm more upside move in the price of the US dollar.
-----
MetaFutures

dxy where is the dollar going!so where here at a very crucial area where we have to pay attention market a bit choppy from news a few hrs ago
now overall trend is up on the daily but dxy has been so bullish last few weeks so this pull back was much needed if these lows hold "110.400" we can see up move now if that low breaks down we can see dxy test 109 soon so all eyes on deck


DXY Daily TA Neutral BullishDXYUSD daily guidance is neutral with a bullish bias. Recommended ratio: 60% DXY, 40% Cash.
* US September PCE price index increased 0.3% from August, and Core PCE increased by 0.6% . DXY, US Treasuries, Gold, Agriculture, GBPUSD and Cryptos are up while VIX, Equities, Equity Futures, EURUSD and Energy are down. In Vladimir Putin's speech today he announced the 'formal' annexation of four regions in Ukraine , many believe this is to allow Russia to use chemical or nuclear weapons as part of Putin's promise to "... defend our land with all the powers and means at our disposal”. Putin also continued painting the narrative of the West as Satanic dictators in hopes of bolstering that perspective amongst Russia's people and allies; he also placed direct blame on the West for sabotaging the Nordstream Pipeline earlier this week. In Putin's words about the liberties and freedoms people have in the West, one can hear the Russian Orthodox directorship of Moscow's Patriarch Kirill who recently claimed that the Russian war dead have had their sins forgiven. One thing that Putin mentioned that is agreeable is that the USA is the only country to have used nuclear weapons on another country, whether Putin's Russia is the second, only time will tell. Short story long, Putin appears to be building up the necessary ingredients to officially start World War 3. Key Upcoming Dates: S&P US September Manufacturing PMI at 945am EST 10/03; September Employment Situation at 830am EST 10/07.*
Price is currently trending down at ~$112 after being rejected by $114.63 resistance, the next support (minor) is at $110.02. Parabolic SAR flips bearish at $111.40, this margin is bearish. RSI is currently trending up at 60.51 after bouncing off of 59.17 support; the next resistance (minor) is at 70.28. Stochastic remains bearish and is currently trending down at 29 as it approaches a test of 24.14 support with no signs of trough formation. MACD remains bullish and is currently trending down at 1.19 as it's still technically testing 1.24 resistance, the next support is at 0.64. ADX is currently trending down slightly at 36 as Price is seeing a downward correction, this is neutral at the moment.
If Price is able to bounce here then it will likely retest the upper trendline of the channel from October 2008 at ~$114 as resistance which will likely coincide with a retest of $114.63 resistance as well. However, if Price continues to break down here, it will likely test $110 minor support . Mental Stop Loss: (one close below) $111.50.

DXY US Dollar Bearish DivergenceThe US dollar is losing strength after getting rejected from the 2nd top. It also formed bearish divergence.
Currently, it is holding above the trend-line support and a breakdown below it, would be a bearish confirmation for it and if it gave a close above 2nd top then that would confirm more upside move in the price of the US dollar.
