DXY US Dollar Index: 1M Chart UpdateToday I am charting the The US Dollar Index (DXY) on a monthly chart over a multi-year period.
The chart shows a long term descending parallel channel (generally bullish), which the DXY has been trading in. Most recently it has broken a multi-year resistance zone, created through a double bottom pattern.
If the DXY breaks out of the descending parallel channel, we can see the price go up significantly as shown by the Fibonacci Extension (Trend-Based Fib Extension).
If the price gets rejected at the channel top, the price can go back down to as low as $60-65, which will create a triple bottom (generally bullish pattern).
This is a multi-year chart so don't expect everything to move quickly.
When zooming out, the US Dollar price looks very bullish in the long-term.
What are your opinions on this? I love reading your comments below.
Disclosure: This is just my opinion and not any type of financial advice. I enjoy charting and discussing technical analysis. Don't trade based on my advice. Do your own research! #cryptopickk
Dxyforecast

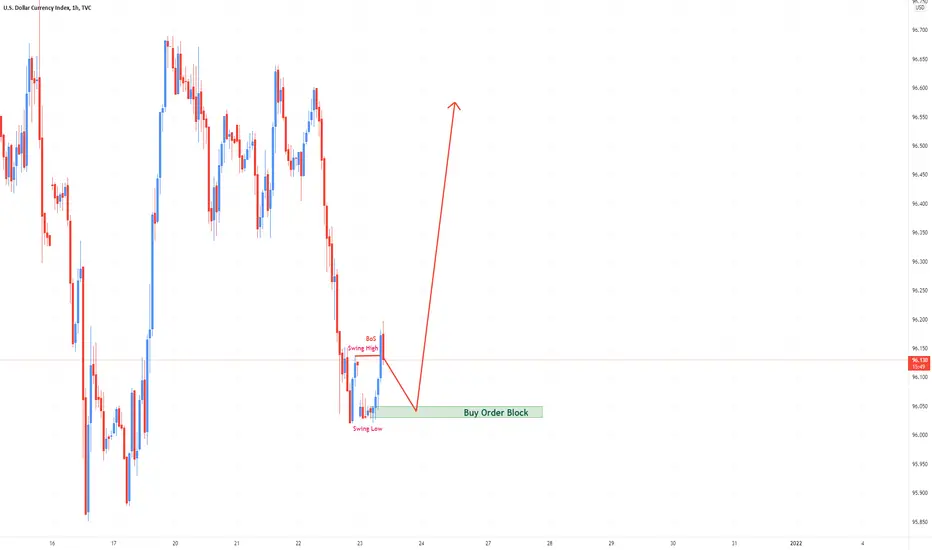
DXY Idea H1Here is my idea for DXY on H1. The price should go up. You can put a pending order on the Order block or find an entry on LTF within OB Zone. Trade Safe!

DXY Update.This count is based on my assumptions so anything can happen not a trading or financial advice just for educational purposes only kindly do your own ta thanks trade with care good luck.

DXY Idea H1Here is my view for DXY Idea on H1. The price should go up, you can put a pending order on the Order block or find an entry on LTF within OB Zone. Trade Safe!
DXY- Can it reach 100 by year's end?After breaking above the rounded bottom neck-line in November, DXY has confirmed its long-term trend change.
The month of December is marked by consolidation in a rectangle with resistance in the 97 zone.
I expect a break to the upside soon and we can have a 3 digits Index quote by year's end.
As long as the price is above 94.50 USD is very, very bullish
Sell rallies on EurUsd, GbpUsd. AudUsd and NzdUsd can be a good idea

DXY Idea H1Here is my view for today's DXY on H1. The price should go up, you can put a pending order on the Order block or find an entry on LTF within OB Zone. Trade Safe!

DXY LONGS UPDATE📉📉📉USD confirmed my bias to the pinpoint accuracy taking out stop losses below 96.000 psycho level and then quickly reverse to the upside as we are in a bullish market strucutre, we head to 97.000. Remember my words !
What do you think ? Comment below..

DXY LONGS 📉📉📉Expect bullish price action on this currency pair as price takes out liquitiy below 96.000 and closes above, we are in a bullish market structure on a HTF and should expect 97.000 to be hit soon.
What do you think? Comment below..

DXY LONGS ✅✅✅ Expect bullish price action on DXY, we close all the bullish imbalance and rejected a bearish orderblock on H1. We are in bullish market structure on a HTF analysis.
What do you think? Comment below..

USD INDEXHello. It appears to have fallen to $94.5 after breaking the $96 level. It can be the third branch of correction

DXY- FED has spoken, now what?DXY is in an uptrend in the long term, and this is clear. However, in the short term looks tired and in the need of a correction.
December rise is anemic and overlapping and this correction could happen soon.
As we see the posted chart, 97 acted as a strong ceiling and at this moment we have 2 support levels to keep in mind.
The first one is the ascending trend line and the second is the horizontal support from 75.80. Once the second support is broken we can also have a confirmation for a deeper correction and the index can drop of around 1 point to very important support at 95.50.
This drop of more than 1.5% can translate into a rise in pairs like EurUsd, GbpUsd, AudUsd and NzdUsd of 200 pips or so.
I will look to buy dips for these pairs

DXY Idea on H1Here is my view for DXY on H1. The price The price should go up, you can put a pending order on the Order block or find an entry on LTF within OB Zone. Trade Safe!

DXY is pressing higherAfter reaching a high of 97, DXY has started to correct and, after a few days of correction, the index has started to consolidate in a tight 0.5 points range.
Now it looks like is pressing to the resistance of this range and a break here could lead to further gains and a new local high.
My target for the index remains 100, and traders should look for opportunities to sell rallies in EurUsd, GbpUsd, AudUsd and NzdUsd.
A drop under 95.80 could mean that the index has further to correct and expose 94.50 very important support.
Overall USD is strongly bullish on medium-term and the safest way to play it is to buy it low.

The Dollar and dead presidents (Update)Here we have a chart on the DXY. Although we have had a move back up it might be short lived as the trend over time is down. Investors aren't collecting cash the yare buying assets with it. the trend is valid until it's broken. AS you can clearly see it's valid since the early 70's (50 years now) so it's long term trend.
The move down we have had since 2020 print of the multiple trillions (40% of all dollars ever printed) was minimal. For me it looks like the big move down has still yet to come especially as they are most likely printing even more.
I've also added the RSI indicator with the chart. It shows a pennant formation which eventually either breaks down or up. That is usually determined by the initial move into it.
Not financial advice.
Cash is Trash - Ray Dalio

DXY still hanging on.The dollar index is consolidating at the top of the channel. The price movements are becoming smaller and the breakout will come soon. This breakout can come to the upside or downside and we are favouring the upside. However, there is a chance that a fakeout back into the channel will come before the upmove comes.
BULL CASE
A break out of the range immediately next week and we see price hit our target of 97.5
BEAR CASE
A break down first 95.5 before the up move comes. If this happens we will need to check the price action after the fed announcements of their taper plans. The announcement may be super bullish for risk on assets.

DXY Idea on H1Here is my view for DXY on H1. The price should go up, you can put a pending order on the Order block or find an entry on LTF within OB Zone. Trade Safe!
