Analysis of short-term operations of gold on July 21Daily Analysis:
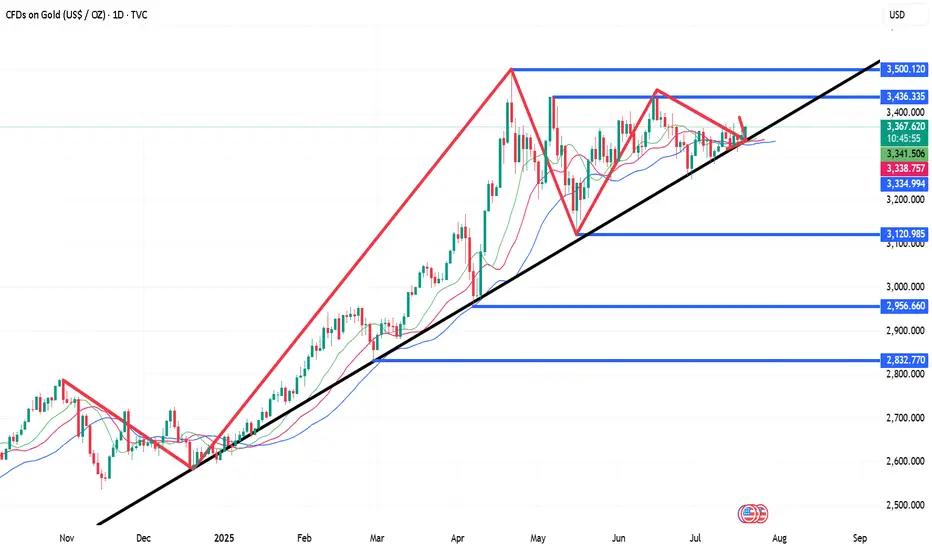
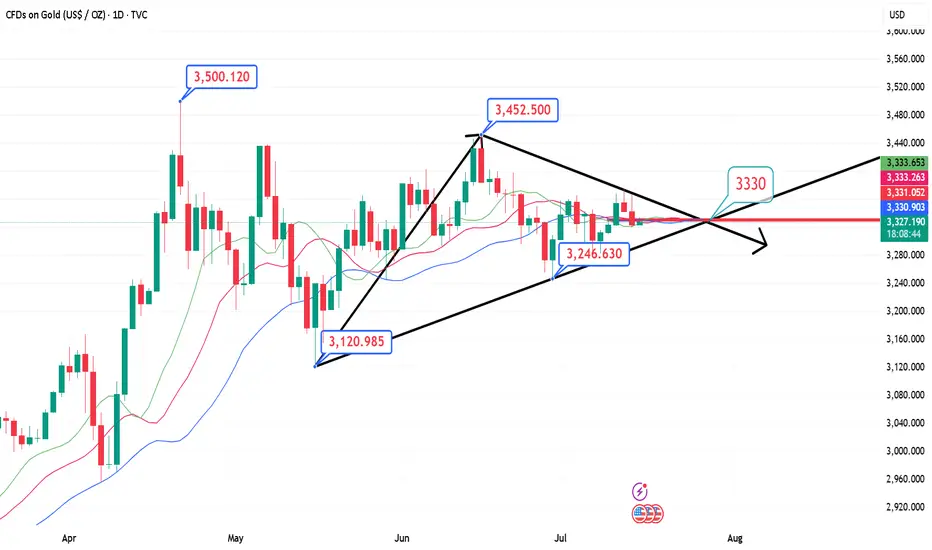
On the daily chart, it can be seen that gold has rebounded from the main rising trendline again, and bargain hunters have set clear risks below the trendline, betting on a price rebound to the 3438 resistance level. Bears need the price to break below the trendline to open up space for a deeper correction, with the next target looking at the 3120 level.
4-hour analysis
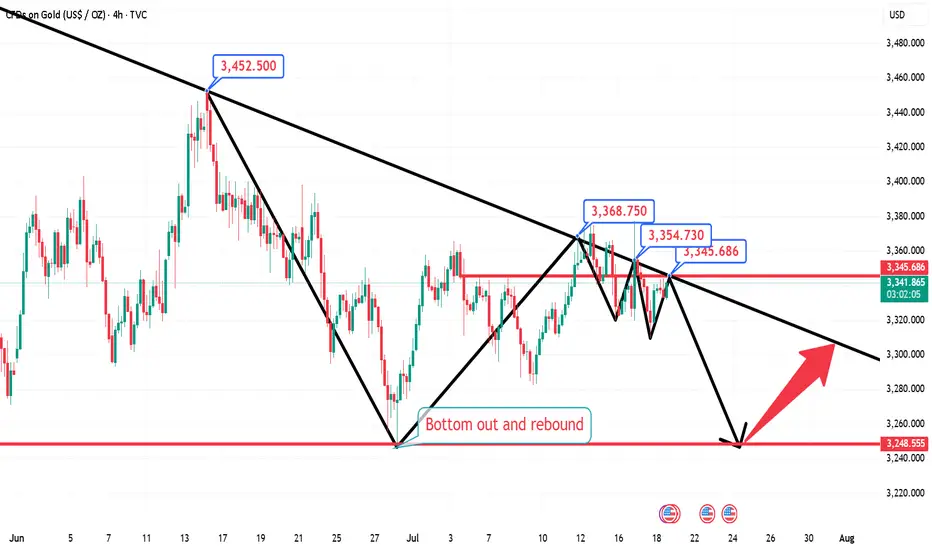
On the 4-hour chart, it can be seen that there is a secondary resistance area near 3377. If the price rebounds to this level, it is expected that bears will intervene here and set risks above the resistance, with the goal of pushing the price below the main trendline. Bulls will look for the price to break through this resistance to increase their bullish bets on the 3438 level.
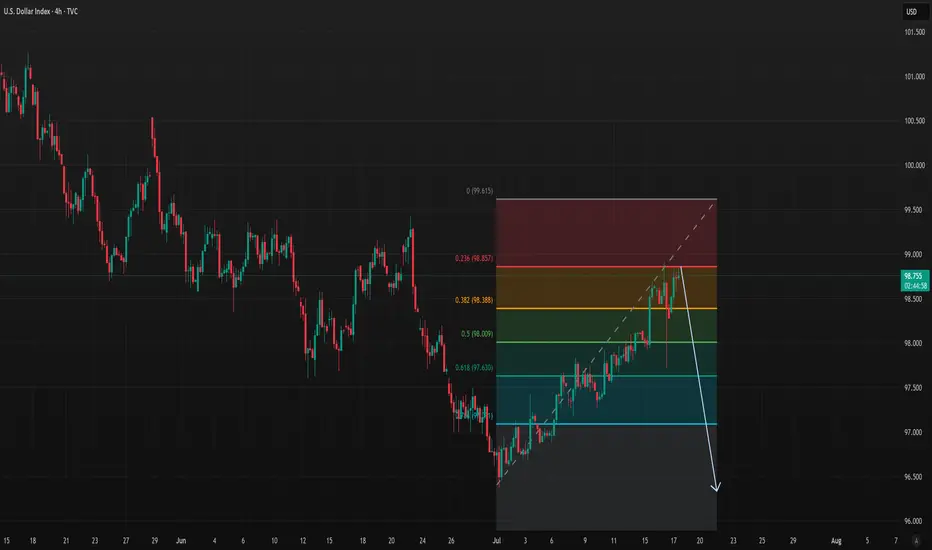
Dxyshort
Buy first when gold falls back, and pay attention to the strengtGold went on a roller coaster ride last week. It rose to around 3377 at the beginning of the week and then fell back under pressure. After stabilizing near 3309 on Thursday, it strengthened again on Friday and came under pressure near 3361. It fell back slightly to around 3344 at the opening in the morning and is currently rising again. In the morning, pay attention to the opportunity to buy first after the pullback, pay attention to the strength of the European session, and pay attention to the pressure near 3378/80 on the upside.

7.18 Gold intraday operation strategy, short-term short first stFrom the 4-hour analysis, the short-term support below continues to focus on around 3316-25, the short-term suppression above focuses on the 3340-45 line, and the key pressure above focuses on the 3380 line. The overall support of 3316-3345 range still maintains the main tone of high-altitude and low-multiple cycles. In the middle position, watch more and do less, be cautious in chasing orders, and wait patiently for key points to enter the market.
DXY Short Very Soon going to $96 or lowerCorruption has broken out all over America. Nothing good can come of this.
Wait for a solid Red weekly bar on DXY and short until 96 or lower.
- Earthquakes
- Wildfires over 600
- Floods
- Riots
- Epstein Files
- Housing (Only for the rich)
- Rental Increases
- Home Insurance Price increases
- Fraud for the Elite (Multiple Coins Created with withdrawals outside of US involving other Presidents)
- Crypto Investigations on Politicians
- Children Migrants being deported (Age 6 with Cancer)
TVC:DXY
FX_IDC:CADUSD
ECONOMICS:USTR
FRED:TREASURY
Analysis of 7.17 Gold Operation: Buy High and Sell LowYesterday, the trend of gold in the first half was quite regular. The rebound in the Japanese session was under pressure, and the European session continued to fall back to test the 3320 mark. The key here has been repeatedly emphasized yesterday. The gold market in the second half was more exciting. First, the news was released that Trump was ready to draft the dismissal of the Federal Reserve Chairman. Gold directly rose by 50 US dollars and broke through the recent high of 3375. Then he said that he had no intention of dismissing the Federal Reserve Chairman. Gold rushed up and fell back by 40 US dollars. The daily line finally closed with an inverted hammer pattern with a very long upper shadow line.
After the end of this pattern, today's market is still bearish. If the market is extremely weak, it will continue to fall below 3358. Pay attention to the attack and defense of the 3320 mark below. If it falls below, it will open the downward space to test the 3300 mark. During the day, we will temporarily set the small range of 3320-3358 to run, sell high and buy low, and retreat to 3325. One low long, defend yesterday's low, look up to 3335, 3342, 3358, and then reverse high.

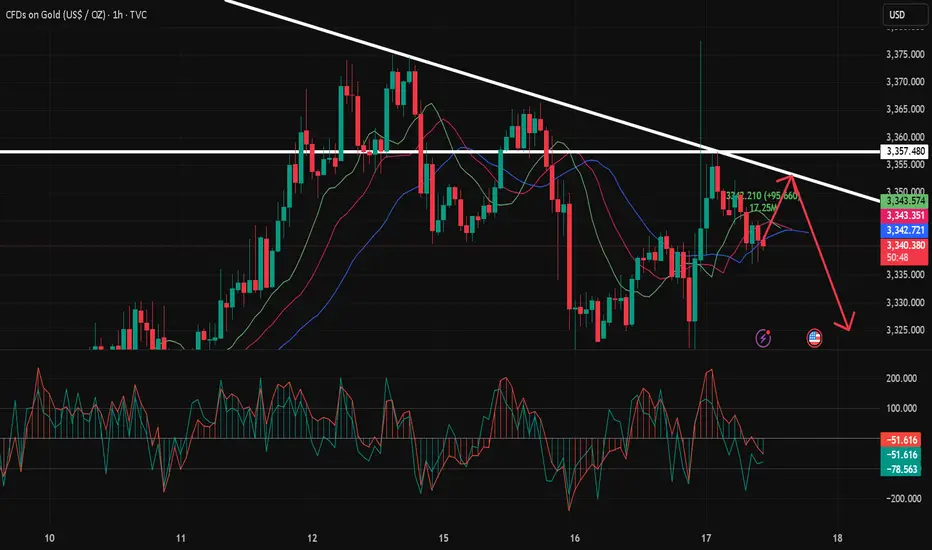
7.17 Gold Short-Term Operation Technical Analysis!!!After a strong rise in the 1-hour gold price, it quickly fell back and closed with a long upper shadow line. The gold bulls did not successfully stabilize the market. This market is actually a venting of the news. The gold bulls are not very confident about rising again. The 1-hour gold moving average is still in a dead cross short pattern. So the gold rebound will continue to be short. The 1-hour gold pattern excludes the influence of the upper shadow line stimulated by yesterday's news. In fact, the whole rhythm is still fluctuating and falling. The upper shadow line is not long, and it is probably just a lure to buy more. After the ups and downs of gold last night, it rebounded again to the 3357 line or continued to fall under pressure. So gold will continue to rebound in the early trading and continue to be short at highs under the pressure of 3357.
Gold is accelerating downward, pay attention to important supporThe U.S. inflation data for June was released overnight. The actual data showed that U.S. inflation rebounded slightly in June, but it did not exceed expectations. After the data was released, Trump made a speech at Truth A post on Social said that given the low consumer prices, the Fed should lower interest rates. He has been calling for a rate cut for some time, so the market still has some uncertainty about the timing of the Fed's subsequent rate cuts, but the probability is in September. The probability of keeping interest rates unchanged this month is high. The US dollar index is also supported and continues to rebound. Gold fluctuated higher from around 3344 in the morning of the previous trading day. During the European session, it refreshed the intraday high and touched the 3366 line under pressure and maintained repeated narrow consolidation. After the data was released, it first rebounded quickly to the 3360 line and then quickly fell back. After two repetitions, it finally moved downward. In the evening, it fell below the intraday low and once touched around 3320 and then stabilized and rebounded. The daily line closed with a middle shadow. Technically, the continuation of the previous convergence triangle after the break is currently returning to the downward channel again.
Pay attention to the pressure of 3342/44 during the day, and pay attention to the support near 3308 below. If it falls below 3308 again, it will return to the downward channel.
7.11 Gold bulls rise again, beware of the black swan coming on FYesterday, Thursday, the US dollar index rose first and then fell. It once approached the 98 mark before the US market, but then gave up most of the gains.
Yesterday, spot gold fluctuated around the 3320-30 US dollar mark. After the US market, it once touched 3310, but finally rebounded to above 3320 for consolidation.
Today, Friday, gold broke through the high point of 3330 yesterday in one fell swoop in the early trading.
So this is relatively good news for bulls.
If the high point of yesterday breaks through and stabilizes, it means that the bullish upward trend may continue today.
From the current 4-hour chart:
It can be found that the current 4-hour chart of gold has stabilized in the breakthrough range.
So if gold continues to go up, simply look at the previous high point.
The two recent high points are around 3345 and 3360.

Gold 4-hour resistance point fluctuates, shorts comeOn Thursday (July 10), the 4-hour resistance point of gold price was formed before the US market. The logic of shorting at the resistance point can be considered. Spot gold maintained a strong trend in the European session, trading around $3,330. Although US President Trump's remarks on imposing a new round of tariffs on many countries triggered safe-haven demand, the FOMC meeting minutes showed differences in the path of interest rate cuts within the year, making gold bulls still cautious.
Spot gold continued to retreat after the previous high of $3,499.83, and has been blocked below $3,451.14 recently, forming a relatively obvious box consolidation structure. The current price is running below the middle track of the Bollinger Band at $3,343.69, indicating that the upward momentum of the bulls is weak. Analysts believe that the short-term key support level is at $3,250, which forms a resonance support with the previous low of $3,247.87. If it falls below, it may increase the downside risk.

Gbpusd long scalp I like current consolidations near equal high depicted with green line.
I want to see a draw towards the equal highs.
This would be simulation trade #7 out of 100

Gold's short-term decline is limited and will continue to riseWith the rise of gold in the US market yesterday, the trend line of the downward trend channel has been supported many times in the short cycle. After the rebound, we still need to pay attention to the suppression of 3328-30. This position is the suppression position of the 4-hour downward trend channel. If it breaks, the overall trend will be a rising flag, which may continue the upward trend. Of course, if it continues to not break through the suppression of 3328-30, it may fluctuate within the range. This requires further observation.
Intraday short-term suggestions: short-term long mainly, pay attention to the support of short-term long near 3307, stop loss 3297, take profit at 3328-30 suppression, break at 3348-50, pay attention to risks.

Technical analysis guide for gold in the US market!Technical aspects:
The gold daily chart shows an obvious shock consolidation structure, and is currently running between the middle and lower tracks of the Bollinger Bands, with an overall weak trend. Since hitting a high of $3499.83, the market has fallen into a sideways consolidation range, with top resistance concentrated in the $3400-3450 range and bottom support at $3250. The recent price retracement to around 3250 failed to effectively break below, forming an important support level.
The MACD indicator crossover continues, the green column is enlarged, the double lines are downward, and the momentum is weak. The RSI indicator runs around 44, and does not show oversold or rebound signals. The price is still in a weak consolidation stage. Analysts believe that if it falls below the 3250 line, it may open up further correction space, and pay attention to the 3170 area support; on the upside, if it can effectively stand above 3400, it is expected to retest the 3450 line high.

7.9 Gold long and short switches frequently!From the daily chart, the overall gold price is still in a weak position, the moving average is hooked, and the upper pressure is near the moving average 3319. Only if it breaks through and stands firm at this position during the day, can the bulls start to exert their strength. It happens that the MA10 position of H4 is also near 3319. At present, H4 is in a bearish trend, so the bullish pressure is still very large, but it rose in the early morning, and it bottomed out and rebounded. Combined with the recent non-continuation of the long and short trends, there is a high probability of rebounding during the day, so we can go long in the Asian session first, and go long directly at the current price of 3300, add positions to 3295, defend 3286, and look at 3312-19. The focus is still on the strength of the European session. If the European session is strong, continue to go long before the US session retreats; if the European session is weak, the US session will bottom out and rebound!

Gbpusd long scalp Same idea as previous post, I want to see a close above 1.35832 and a return into that level would be my entry. 3 targets as depicted.

Gbpusd long scalpWe've taken some sellside liquidity. I am expecting price revert back into the range. Simulated trade #6 already triggered at 1.35792 any return into this level would be a good entry or near this level allowing 3 pips.

Weekly range to be continued, gold short and long this weekLast week, gold opened high at 3280.9 at the beginning of the week and then fell back. The weekly low reached 3245.8, and then the market was strongly pulled up by the support of this round of trend line and fundamentals. On Thursday morning, the weekly high touched 3366, and then the market fell strongly under the strong influence of non-agricultural data. On Friday, the market consolidated in the range due to the holiday, and the weekly line finally closed at 3337.2. The weekly line closed with a medium-sized positive line with equal upper and lower shadows. After ending in this pattern, today's market continued to move in the range. In terms of points, the stop loss was still at 3346 after the short position at 3342 last Friday. Today, it first rose to 3342 and the short stop loss was still 3346. The target below is 3330 and 3322. If it falls below, the support of 3310 and 3300-3292 will be targeted.

$DXY: New lows begets new lows. $USM2: Why is it increasing? Here we are again with one more TVC:DXY chart analysis. I think the US Dollar does not fail to surprise us week after week. Making new lows every week is giving a boost to the Equity markets. The SP:SPX and NASDAQ:QQQ are at ATH. In my articles on April 18 and June 16
Perfect trade setup: AMEX:GLD to 325; DXY to 95 for AMEX:GLD by RabishankarBiswal
TVC:DXY weakness and EM markets: NSE:NIFTY more upside? for NSE:NIFTY by RabishankarBiswal — TradingView
We have time and again said that in the near term TVC:DXY chart looks weak and could touch 95 by end of July. I think it might be achieved earlier. We have looked at the consequences of 95 handle on TVC:DXY on various asset classes like AMEX:GLD , NSE:NIFTY and EMs. These asset classes are reaching ATH every single week. But we have seldom investigated the reason behind the weakness in $DXY. Looking through my macro charts I found an amazing chart which might explain most of this weakness.
The ECONOMICS:USM2 is almost at 22 T $ surpassing its previous high on March 2022. M2 is basically the total amount of money in circulation in the economy on top of the nominal M1. Higher M2 indicates higher amount of liquidity which is then channelized into riskier assets like CRYPTOCAP:BTC , AMEX:GLD , SP:SPX , NASDAQ:QQQ and EMS like $NIFTY. And with such high ECONOMICS:USM2 in circulation, it is very clear why TVC:DXY is making new lows each week. This can also explain why US Fed is hesitant to reduce rates. With M2 so high US Fed should not hurry.
Verdict: TVC:DXY to 95 by 31 July, Cycle low of 90 by year end. ECONOMICS:USM2 keeps increasing. US Fed stays put.

Gbpusd long idea after reversalUpdate of previous call after we broke structure.
I see this one attacking buyside liquidity at equal highs formed on Tuesday.
Possible market maker buy model playing out here.

Usdchf short idea after reversalAn update of previous idea. I see this one in reversal mode.
Likely marker maker sell model playing out now.

EURUSD Short Projections for Big Beautiful BillI think we may hit a resistance point soon and drop to around 1.16 or lower. Based on the fundamentals of the Big Beautiful Bill. I think this will be short term and the USD may lose strength.
It will have large economic impact, I think this will happen in short term.
FX:EURUSD
TVC:DXY

7.3 Prediction of gold price fluctuation before non-agriculturalAfter the release of ADP data last night, gold prices resumed their rise and crossed the high of 3357.88 this week and closed near this position. Today, gold prices opened high and then fell back. Pay attention to the strength of the correction in the morning session and choose the opportunity to go long and bullish. From the current market perspective, the support below can focus on the low point of yesterday's US session near 3333, followed by 3327; before the release of non-agricultural data, the upper pressure will focus on the early trading start point 3366, followed by 3375. The operation in the Asian and European sessions is mainly to go long on the correction, and the high-altitude thinking is abandoned. Specific operation ideas: Go long and bullish when the gold price falls back to around 3338, protect the position of 3330, and the target is to see whether the early trading high of 3365 can break!

7.2 Technical Analysis of Gold Trading in the US MarketGold fluctuated in the range of 3326-3355 today on Wednesday. The small non-agricultural bullish gold broke through the 3345 line and hit the 3351 line, and then fluctuated back to the current 3342 to adjust the momentum of rising again. If the positive line on Wednesday closed above 3345, it will continue to rise to 3363-3370; if the negative line on the closing fell below the middle track, it will continue to fluctuate and consolidate in this range. The support of 3324 below is the key position tonight; as long as this position is maintained, the bulls will rebound and rise, otherwise they will fall into the battle for support at the 3295-3301 line.
Technical analysis:
From the 4-hour analysis, the support below is around 3324. The main bullish trend remains unchanged after the evening retracement. The important support is 3314-16, and the focus is on the long-short watershed position of 3295-3301. The daily level stabilizes above this position and continues to maintain the rhythm of retracement and bullish trend.

Gold bulls and bears compete for non-agricultural dataTechnical aspects:
Currently, gold is in a typical ascending triangle structure, reflecting that the market bullish trend has not been broken but faces strong resistance. On the daily chart, gold as a whole maintains a range of $3250 to $3400, with obvious horizontal support and resistance bands formed at both ends of the range.
The Bollinger Bands are converging as a whole, indicating that volatility is shrinking, indicating that the large-scale direction selection is approaching. The green column of the MACD indicator has narrowed slightly, and the short-term momentum is still bearish but there are signs of weakening. The RSI indicator runs around 49, maintaining a neutral and bearish state, and there is no obvious deviation in the short term, suggesting that there is still the possibility of subsequent shocks and consolidation.
