DXY Locked & Loaded: Robber's Gameplan for Profit Pullout💸💼 "DXY Market Heist Blueprint – The Thief's Bullish Escape Plan" 💼💸
Rob the Market, Not the Rules – Trade Smart, Trade Sharp, Trade Thief Style™
🌍 Hey Money Makers, Risk Takers & Market Robbers!
Hola! Ola! Bonjour! Hallo! Marhaba! 🙌
Let’s break into the DXY vault and swipe those profits with precision. 💼💸
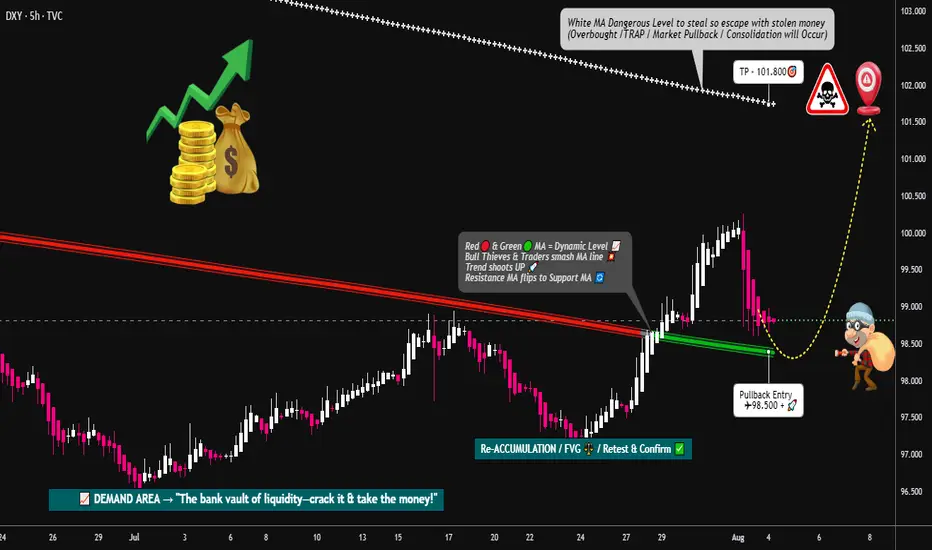
🧠💡This Thief Trading Style™ Master Plan is a high-stakes operation backed by technical setups, macro-fundamentals, and robbery-level insights. Follow the blueprint laid out on the chart. Our target? The High-Risk Yellow ATR Zone – where the real treasure is buried.
💼 ENTRY: "The Vault Is Open – Grab the Bullish Bags!"
Enter long as price approaches key pullback levels within a 15–30 min timeframe. Use the most recent candle wick’s swing low/high for sniper-style DCA entries.
🔑 Layer multiple limit orders like a thief stacking getaway bags (aka the DCA / Layering Method). Be patient and precise.
🛑 STOP LOSS: "Don’t Get Caught by the Market Police"
📍 Place SL just below the nearest 4H swing low (example: 97.300) depending on your strategy (scalping/swing).
⚖️ Your SL should reflect your risk appetite, lot size, and how many limit orders you’re running. Thieves don’t risk it all on one job. 🎭
🎯 TARGET: 101.800 (or Escape Before the Sirens)
Once the target zone nears, decide whether to collect full loot or exit before resistance hits. We trade smart, not greedy. 🧠💰
📈 Why This Heist Makes Sense: Market Conditions Breakdown
Bullish momentum supported by macro drivers and intermarket forces
COT report and sentiment leaning in favor of USD
Dollar Index structure showing signs of reversal + trend confirmation
Consolidation trap zones hinting at institutional accumulation
💡 This is not just a blind entry—it's a well-researched and time-tested plan. Check the chart details and refer to:
🔗 Fundamentals | COT Reports | Sentiment Score | Quantitative Outlook
🚨 NEWS & POSITION MANAGEMENT ALERT
Before jumping in, beware of high-impact news!
🗞️ To keep your trades safe and stress-free:
Avoid opening new positions during major news releases
Use trailing SLs to protect gains
Monitor volatility triggers (economic calendar is your best friend!)
🏴☠️💥 BOOST THE ROBBERY – Hit That Like/Boost Button
The more you boost, the stronger the heist crew becomes! 💪🚀
Help fellow traders steal opportunities with the Thief Trading Style™ – calculated, bold, and sharp.
🔥 Let's continue to outsmart the markets and make each trade count. Stay tuned for the next heist update – fresh trades, deeper insights, and bigger bags. 🤑💼
🔔 Disclaimer: This plan is not financial advice. Use it for educational and entertainment purposes. Always conduct your own analysis and manage risk accordingly.
📌 Markets shift quickly. Stay adaptable, informed, and always ready to pivot.
Dxysignals
DXY ready to drop again?DXY has done false breakout in the beginning of the week with strong rejection to the upside. Upon rejection, price has pulled back to 38.2% fib along with daily resistance retest and price has strongly rejected from 98.70 showing further downside with another wave to 98.32 has rejected with strong liquidity candle that continue to drop as 4h, has formed liquidity candle with false breakout at 98.00, there is higher probability to drop to support.

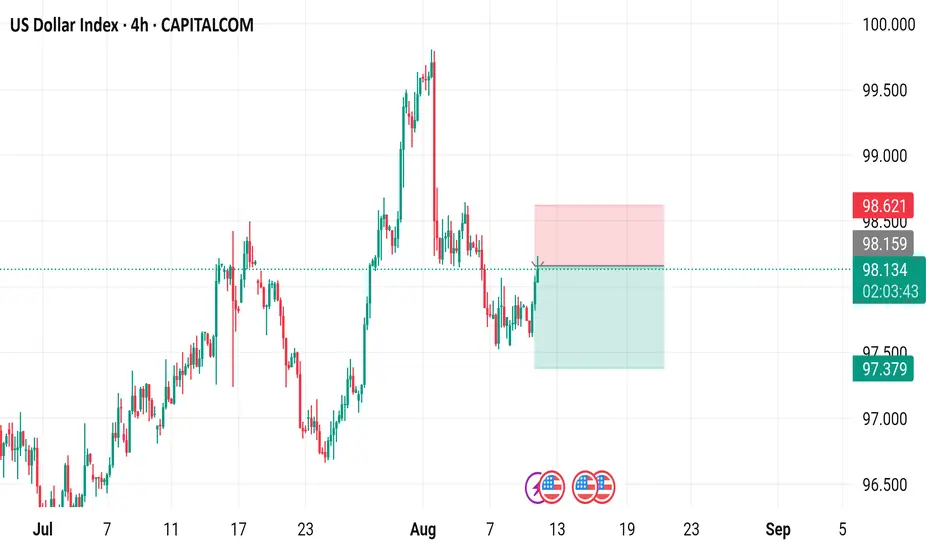
US Dollar Index (DXY) 4-Hour Chart4-hour chart of the US Dollar Index (DXY) from CAPITALCOM. The chart shows the price movement of the DXY from early July to early September. The current price is 98.131 with a 0.28% increase. The chart features a candlestick pattern with green (upward movement) and red (downward movement) bars. A sell signal is indicated at 98.132, and a buy signal is at 98.186. The chart also includes highlighted zones (red and green rectangles) indicating potential trading ranges or areas of interest between approximately 98.621 and 97.379.
DXY Just Broke Resistance – Is This the Start of a Dollar Rally?As per our analysis, DXY has successfully broken above the primary and secondary resistance line.
If the price manages to close above the marked resistance zone, we could see further upside momentum ahead.

DXY still in downward channel. Rejection here = BTC rally The DXY is still in a downward sloping channel and trying to break back above the previous 2-year cycle low, but I think will reject here and kick off the next leg of the BTC rally.
Ideally we get a big DXY drop and ultimately break below the 95% level and on down into 'Bitcoin Super Rally Zone'🚀

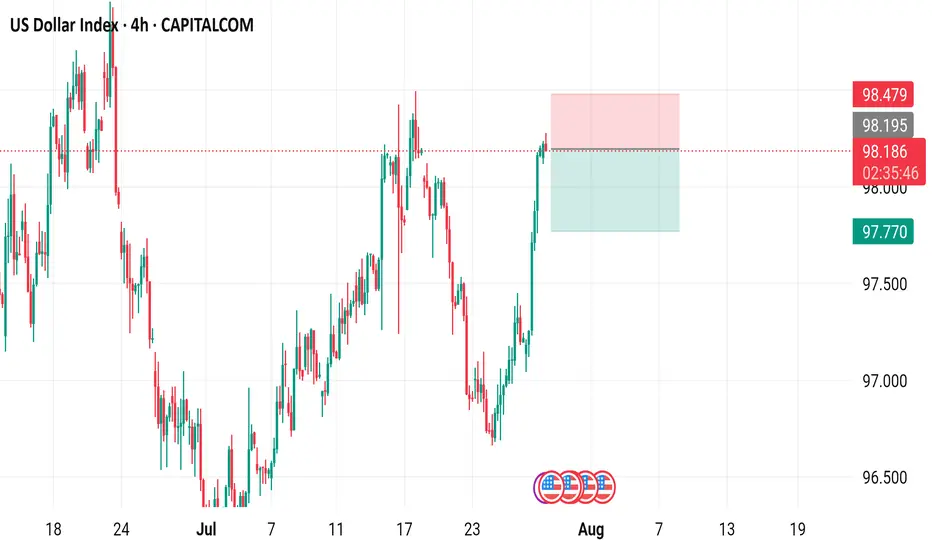
US Dollar Index (DXY) - 4 Hour Chart4-hour chart from CAPITALCOM displays the recent performance of the US Dollar Index (DXY), showing a current value of 98.190 with a slight decline of 0.009 (-0.01%). The chart highlights key price levels, including a recent sell signal at 98.189 and a buy signal at 98.243, with a resistance zone marked between 98.195 and 98.479. The index has experienced fluctuations, with notable drops and recoveries, and is currently trending near the 98.190 level as of July 29, 2025.
US Dollar Index - 4h Chart (CAPITALCOM)4-hour chart of the US Dollar Index (DXY) from CAPITALCOM shows the index's recent price movements. The current value is 96.955, with a slight increase of 0.054 (+0.06%). Key levels include a support at 96.413 and resistance at 97.554. The chart highlights buy signals at 97.012 and sell signals at 96.958 and 96.955, with a notable downward trend breaking below a support zone around 97.150.

US Dollar Breakdown – Don’t Fight the FloodSince the start of the year, after forming a small double top around the 110 zone, the US Dollar Index (DXY) has followed only one direction: down.
So far, we’re seeing a decline that’s approaching 15%, with the index breaking multiple major support levels along the way. And judging by the current structure, there’s little reason to believe this trend will reverse any time soon.
________________________________________
🔍 Short-Term View – Flag Break, More Losses Ahead
Zooming in, we can observe that the last rally was purely corrective — a typical bear flag formation. That flag is now broken to the downside, which confirms renewed bearish pressure and suggests that further losses are likely even in the short term.
________________________________________
🎯 What’s Next?
The next major support zone sits around 95, a level that should act as a magnet if the current trend continues.
As long as price stays under 100 ZONE, the outlook remains bearish and the strategy should align with that bias.
________________________________________
✅ Strategy Going Forward
The safe and logical approach now is to buy dips on major USD pairs:
EURUSD, GBPUSD, AUDUSD, and NZDUSD
________________________________________
📌 Final Thought
The structure is clear, momentum favors the downside, and the market is offering clean setups across multiple USD pairs.
Don’t fight the trend — follow the flow. 🟢

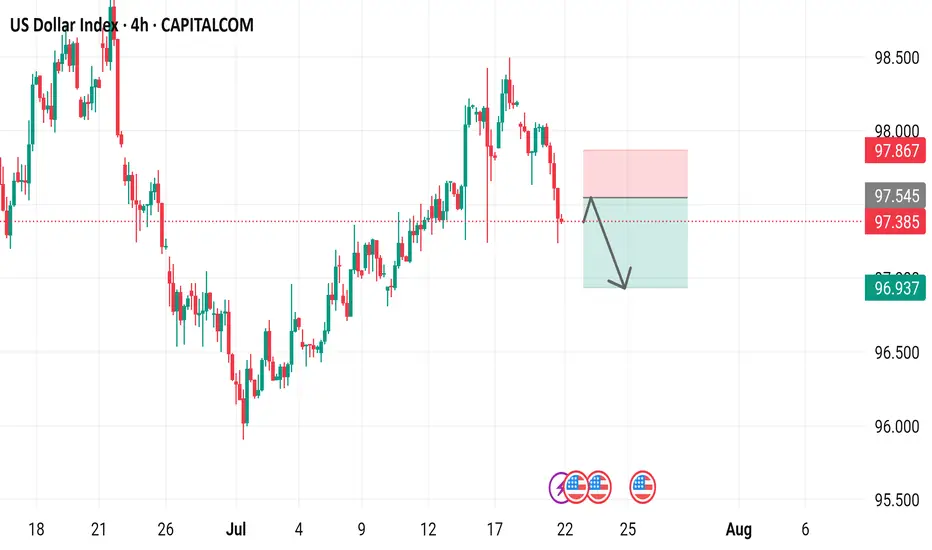
US Dollar Index 4-hour time frame, showcasing the US Dollar Index's performance over this period.
- The index is currently at 97.385, with a decrease of 0.636 (-0.65%) from its previous value.
- A red box indicates a "SELL" signal at 97.385, while a blue box suggests a "BUY" signal at 97.439.
- The chart includes various technical indicators, such as moving averages and relative strength index (RSI), to help traders analyze market trends.
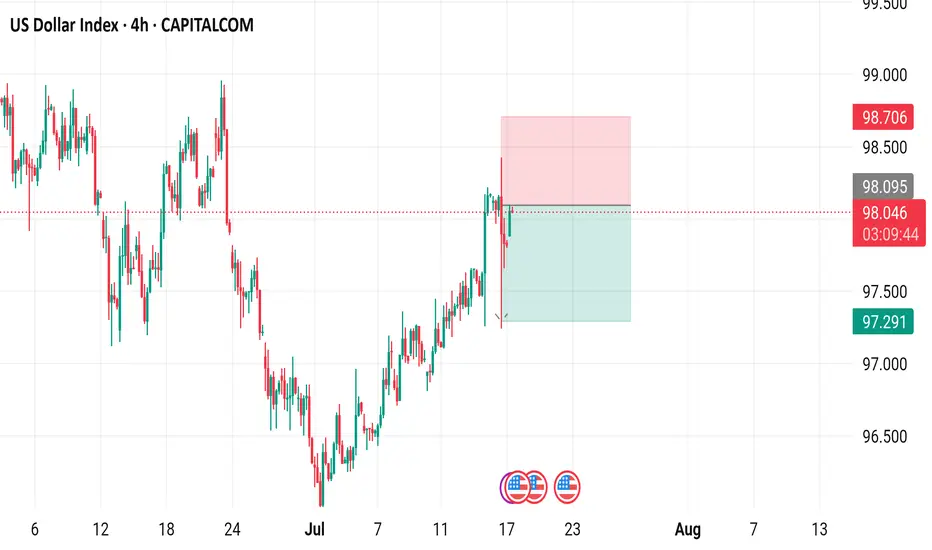
US Dollar Index (DXY) - 4 Hour Chart4-hour performance of the US Dollar Index (DXY) from CAPITALCOM, showing a current value of 98.040 with a 0.23% increase (+0.222). The chart includes recent buy and sell signals at 98.094 and 98.040, respectively, with a highlighted resistance zone around 98.706-99.000 and a support zone around 97.291-98.040. The timeframe covers data from early July to mid-August 2025.
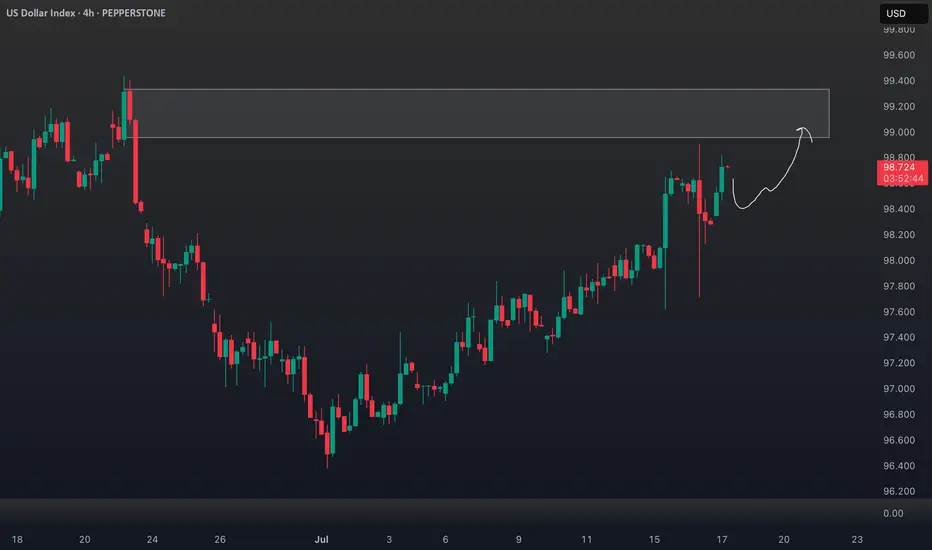
DXY Outlook: Bullish Move Fueled by Fundamentals & GeopoliticsTechnical Analysis (4H Chart & Broader Context) 📈🕓
The DXY 4H chart shows a clear bullish trend 🚀, with higher highs and higher lows since early July. DXY has caught a strong bid, breaking above short-term resistance near 98.40 and now eyeing the previous swing high 🎯. This matches the consensus among analysts: DXY remains in a bullish structure, with momentum supported by both technicals and macro factors.
Key resistance: Next upside target is the previous high (around 99.60 on the chart), with further resistance at the psychological 100 level 🏁.
Support: Immediate support at 98.20, then 97.60 🛡️.
Momentum: Strong bullish candles and no major bearish reversal signals on the 4H. Some analysts note positioning is stretched, so a short-term pullback or consolidation is possible before more upside (IG).
Fundamental Analysis 💹🌍
Why is DXY rallying?
Fed Policy & US Data: The US economy is resilient 💪, with robust services data, strong retail sales, and a recent uptick in core inflation. The Fed is less dovish, with markets now expecting a slower pace of rate cuts 🏦.
Interest Rate Differentials: The US keeps a yield advantage as the Fed is less aggressive in cutting rates compared to the ECB and BoJ, especially with Europe and Japan facing weaker growth and possible further easing 🌐.
Geopolitical Factors: Ongoing trade tensions (Trump’s tariff threats) and global uncertainty (including Middle East risks) are driving safe-haven flows into the dollar 🛡️🌏. DXY typically strengthens during periods of geopolitical stress.
Positioning: CFTC data shows USD long positioning at multi-month highs, which could mean the market is crowded and vulnerable to short-term corrections ⚠️ (IG).
Trade Idea (Bullish Bias, Targeting Previous High) 💡💵
Setup:
Bias: Bullish, in line with the prevailing trend and macro backdrop 🟢.
Entry: Consider buying on a minor pullback to the 98.20–98.40 support zone, or on a confirmed breakout above the recent high 🛒.
Target: Previous swing high near 99.60, with a stretch target at 100.00 🎯.
Stop: Below 97.60 (recent swing low/support) ⛔.
Risk Factors:
Overbought positioning could trigger a short-term pullback ⚠️.
Any dovish surprise from the Fed or rapid de-escalation in global tensions could cap further gains 🕊️.
In summary: The DXY’s bullish trend is underpinned by resilient US data, a hawkish Fed, and global risk aversion. Your bullish bias is well-supported, with the previous high as a logical target. Watch for short-term pullbacks, but the broader trend remains up unless key support is lost. 🚦
DXY Bullish Reversal Setup Toward 98.20 Target Entry Point
Marked at: ~97.200
The price has already reacted multiple times around this level, suggesting it's a key support zone.
🛑 Stop Loss
Placed at: ~96.930
Just below the support zone, protecting against a breakdown below recent lows.
This implies a risk of about 27 pips from the entry.
🎯 Target Point (TP)
Marked at: ~98.201
Strong resistance zone from previous price action.
Target implies a potential reward of 100+ pips, offering a risk-reward ratio (RRR) of ~3.7:1, which is favorable.
📊 Resistance Area
Around 97.419–97.465
This is the first obstacle the price must break through to confirm bullish continuation.
The 200 EMA (blue curve) is currently acting as dynamic resistance, aligning near this zone.
📉 Indicators
Moving Averages:
Red: Likely 50 EMA
Blue: Likely 200 EMA
Price is currently below both EMAs — so trend is still bearish, but trying to shift.
📌 Strategy Insight
The setup anticipates a bullish reversal from 97.200, aiming for a breakout above the 200 EMA and resistance to reach the 98.201 zone.
For confirmation, watch for a strong bullish candle close above 97.465, which would validate upside continuation.
⚠️ Risks
Price is still under both moving averages → downward momentum may persist.
If support at 97.00 breaks, downside acceleration could occur.
✅ Conclusion:
This is a bullish breakout setup on DXY with:
Defined entry and stop-loss.
Clear target.
High RRR.
But it’s crucial to wait for confirmation above resistance (97.465) before full conviction on the long trade.

DXY Short-term rebound quite likely.The U.S. Dollar index (DXY) has been trading within almost a 3-year Channel Down, which has assisted us in choosing the right levels to sell high and buy low.
Despite being now on its 2nd major Bearish Leg, we see a short-term bounce possibly up to August quite likely based on the previous major Bearish Leg. As you see, the current setup resembles the April 13 023 Low after which the price rebounded short-term just above the 0.786 Fibonacci level, only to get rejected later and complete the bottom on the 1.1 Fib extension.
Even the 1W RSI sequences between the two fractals are identical. Therefore, before diving below 96.000, we believe a 100.000 test is quite likely.
-------------------------------------------------------------------------------
** Please LIKE 👍, FOLLOW ✅, SHARE 🙌 and COMMENT ✍ if you enjoy this idea! Also share your ideas and charts in the comments section below! This is best way to keep it relevant, support us, keep the content here free and allow the idea to reach as many people as possible. **
-------------------------------------------------------------------------------
💸💸💸💸💸💸
👇 👇 👇 👇 👇 👇

Free fall on DXY?With gap open at 97.66 level before the monthly close price has broken the monthly support and started to drop. We may see the price to drop to long term monthly support at 96.622 or further below to 95.66 as with the increased bearish pressure we may see the price to continue to drop to this longer term support level.
As with upcoming USD news we may see the price to move to this level with high probability bearish trend.

Dollar Index Analysis: Wedge + Powell Outlook – June 25, 2025📉 Technical Outlook: Bearish Rising Wedge + Liquidity Sweep Setup
TVC:DXY The Dollar Index (DXY) is currently trading within a rising wedge pattern, typically a bearish structure. We're anticipating a fake breakdown, potential sweep of the key demand zone, followed by a reversal move targeting key highs.
🔍 Key Technical Zones
📥 Demand Zone (Buy Area):
🔵 97.50 – 97.20 = Institutional accumulation + unfilled orders
🚫 Invalidation Level (Stop-Loss) :
❌ 96.70 = Clean break below confirms full bearish continuation
🎯 Target Projections (Upside Levels) :
TP1: 99.00
TP2: 100.00
TP3: 101.04 (HTF swing high liquidity cleanout)
🧠 Summary Setup :
Downtrend
Rising wedge formation
Sweep of 97.20 possible
Watch for fakeout & reversal play toward 101.04
🏛️ Fundamental Analysis – Powell’s Testimony Insights
Fed Chair Powell highlighted the following during his recent testimony:
🔄 “We’re not there yet on inflation” — Core services remain sticky
🛑 No immediate rate cuts — Growth is slowing but not crashing
🕰 Rate cuts likely postponed to Q4 2025
🔐 “Real rates are restrictive enough” = No more hikes expected
💡 Implication for DXY :
✅ Short-term bullish bias as higher U.S. yields remain attractive if rate cuts are delayed.
🌍 Macro Context Snapshot (as of June 25, 2025)
🇺🇸 US Disinflation: CPI & PCE easing, but not collapsing
🇪🇺 ECB Cut in June: Euro may weaken further
🇯🇵 BOJ Policy Unclear: USD/JPY likely volatile
🌐 Global Risk Appetite High: Volatility may return with geopolitical events
🔥 Watch This: Trade Tariff Narrative Heating Up
🚨 New U.S. Tariff Signals on Chinese tech and EU autos are resurfacing. This could:
Push inflation risk higher
Delay Fed’s easing timeline
Add support to USD short term as markets price in geopolitical tension and uncertainty
📌 Trading Strategy Recap :
Monitor wedge support near 97.20
Look for fakeout/sweep and bullish reversal
Target 99–101 zone on rebound
Stay alert to Powell/Fed rhetoric + tariff news
If you find this analysis helpful, Like, Comment, and Follow for more DXY, gold, and macro trades!

DXY: US dollar To Drop Further Around 95?The US dollar has been steadily declining since the new president was elected in the USA. This decline has been accompanied by the ongoing trade wars. Numerous economic indicators have supported this trend, and we anticipate further depreciation in the coming days or weeks. Before trading, it’s essential to conduct your own analysis and gain a comprehensive understanding of the market.
We wish you the best of success in trading. Good luck and trade safely.
Like and comment for more, and as always, happy trading!
Team Setupsfx_

Index/US) Bearish trend analysis Read The caption)SMC trading point update
Technical analysis of U.S. Dollar Index (DXY) on the 30-minute timeframe, with the price respecting a clear downtrend and repeatedly rejecting a resistance zone near the 200 EMA.
---
Analysis Breakdown
Key Technical Elements:
1. Downtrend Structure:
The price remains within a descending channel.
Multiple lower highs and lower lows signal sustained bearish pressure.
2. Resistance Zone:
Highlighted near 98.490–98.495, aligned with the EMA 200.
Multiple rejections from this level (indicated by red arrows), confirming strong supply.
3. EMA 200 (98.490):
Acts as dynamic resistance.
Price is below it, reinforcing the bearish bias.
4. Projected Move:
Bearish price path targets the 97.189 level (target point).
A measured move of approximately -1.30% is illustrated.
5. RSI (14):
RSI currently at 46.27, below the neutral 50 mark.
This confirms bearish momentum without being oversold, leaving room for further downside.
---
Bearish Thesis:
Repeated failure to break above key resistance + downward channel + RSI weakness suggests a continuation to the downside.
Short-term consolidation expected before breakdown continuation.
---
Trade Idea Concept:
Entry: Sell on a minor pullback near resistance (~98.300–98.490), or breakdown below the recent minor support.
Target: 97.189 zone.
Stop Loss: Above 98.500 or EMA 200 to invalidate the bearish setup.
Mr SMC Trading point
Risks to Watch:
A break and strong close above 98.500 would invalidate the bearish structure and could initiate a trend reversal.
Economic events (noted by calendar icons) may trigger volatility – ideal to monitor closely around those times.
plesse support boost 🚀 this analysis)

DXY Under Pressure: Breakdown Incoming Below 99.00?After testing the 102 resistance zone in mid-May, the TVC:DXY resumed its downward move, dropping back into the 98.50–99.00 support zone.
The brief spike above the psychological 100 was quickly rejected, and price has since rolled over — currently trading around 99.27 at the time of posting.
🔻 The downside pressure is strong, and a break below support looks imminent.
If that break occurs:
🎯 Short-term target: 98 (approx. 1% drop)
📉 Medium-term potential: A deeper decline toward 95

DXY Analysis today : Possible reversal?With strong liquidity grab at 99.00 DXY, with monthly rejection to the upside, past week we have seen with gap open the market started to drop long term support level 99.000 which smart money zone price has got bounce back to the upside with strong momentum potentially forming a double bottom with series of higher low price may continue to move up to the 100.75 to long term monthly resistance with NFP we may see further rejection down again.
A bullish on support is high probability !

DXY Technical Outlook – Strong Support Test and Bullish Reversa Chart Summary
The DXY (U.S. Dollar Index) chart illustrates a significant technical structure between strong historical support and resistance zones, with potential for a bullish reversal after a key level retest.
🟢 Key Support Zone: 99.000 – 98.000
📍 Labeled as "STRONG SUPPORT", this zone has held multiple times:
Previous bounce: Early 2023 ✅
Mid-2024 rebound ✅
Current price action once again shows a reaction from this level with a bullish candle forming 🔥
📌 EMA Confluence:
The 200 EMA (blue) sits at 102.401
The 50 EMA (red) at 103.725
Price is currently below both EMAs but near the 200 EMA, suggesting potential for a mean reversion bounce 📈
🔴 Resistance Zones to Watch:
Resistance Zone: 109.000 – 110.000
⛔ Historically rejected in late 2023 and again in early 2025
🧱 Acting as a supply zone — watch for rejection or breakout
ATH Supply Zone: 113.000 – 114.000
🚨 This is a major psychological and technical barrier
🫡 Marked as “NEW ATH” – would need strong momentum and fundamentals for a breakout above this level
📈 Price Action Expectations:
With strong support respected again, a bullish reversal toward 109.000 – 110.000 appears likely (as illustrated by the arrow).
If momentum continues, a retest of ATH zone is on the cards 🔭
However, a failure to hold support could lead to breakdown below 98.000 – watch closely 🔍
🧭 Strategic Insight
Bullish Bias while above support (98.000 zone)
Reversal Confirmation needed above 102.401 (200 EMA) and 103.725 (50 EMA)
Watch for rejection near 110.000 resistance before ATH test
📌 Final Note:
🧊 World Eyes on this Level – As highlighted on the chart, the current support area is under global observation, reinforcing its importance.
🕵️♂️ Stay alert for breakout volume and fundamental catalysts (e.g., Fed decisions, CPI, jobs data).

BEARS STILL IN CHARGE ! DXY- USD INDEX FORECAST Q2 W22 Y25DXY USD INDEX FORECAST Q2 W22 Y25
BEARS CRUSHING THE USD!
Professional Risk Managers 👋
Welcome back to another FRGNT chart update📈
Diving into some Forex setups using predominantly higher time frame order blocks alongside confirmation breaks of structure.
✅ U.S. dollar index is a measure of the value of the dollar against a basket of six foreign currencies.
✅The currencies are the Euro, Swiss franc, Japanese yen, Canadian dollar, British pound, and Swedish krona.
🔑 Remember, to participate in trading comes always with a degree of risk, therefore as professional risk managers it remains vital that we stick to our risk management plan as well as our trading strategies.
Pairs to look out for -
EURUSD - BUY
USDCHF - SELL
USDJPY - SELL
USDCAD - SELL
GBPUSD - BUY
- Perhaps it's time to accept that a recovery in the DXY is not occurring anytime soon...
📈The rest, we leave to the balance of probabilities.
💡Fail to plan. Plan to fail.
🏆It has always been that simple.
❤️Good luck with your trading journey, I shall see you at the very top.
🎯Trade consistent, FRGNT X

"DXY Dollar Index" Market Bullish Heist Plan (Day/Swing Trade)🌟Hi! Hola! Ola! Bonjour! Hallo! Marhaba!🌟
Dear Money Makers & Robbers, 🤑 💰💸✈️
Based on 🔥Thief Trading style technical and fundamental analysis🔥, here is our master plan to heist the "DXY Dollar Index" Bank Heist. Please adhere to the strategy I've outlined in the chart, which emphasizes long entry. Our aim is to escape near the high-risk ATR Line Zone. It's a Risky level, overbought market, consolidation, trend reversal, trap at the level where traders and bearish robbers are stronger. 🏆💸"Take profit and treat yourself, traders. You deserve it!💪🏆🎉
Entry 📈 : "The heist is on! Wait for the Crossing previous high (100.400) then make your move - Bullish profits await!"
however I advise to Place Buy stop orders above the Moving average (or) Place buy limit orders within a 15 or 30 minute timeframe most recent or swing, low or high level for Pullback entries.
📌I strongly advise you to set an "alert (Alarm)" on your chart so you can see when the breakout entry occurs.
Stop Loss 🛑: "🔊 Yo, listen up! 🗣️ If you're lookin' to get in on a buy stop order, don't even think about settin' that stop loss till after the breakout 🚀. You feel me? Now, if you're smart, you'll place that stop loss where I told you to 📍, but if you're a rebel, you can put it wherever you like 🤪 - just don't say I didn't warn you ⚠️. You're playin' with fire 🔥, and it's your risk, not mine 👊."
📍 Thief SL placed at the nearest/swing low level Using the 2H timeframe (99.000) Day/swing trade basis.
📍 SL is based on your risk of the trade, lot size and how many multiple orders you have to take.
🏴☠️Target 🎯: 102.300
🧲Scalpers, take note 👀 : only scalp on the Long side. If you have a lot of money, you can go straight away; if not, you can join swing traders and carry out the robbery plan. Use trailing SL to safeguard your money 💰.
💰💵💸"DXY Dollar Index" Bank Money Heist Plan is currently experiencing a bullishness,., driven by several key factors. .☝☝☝
📰🗞️Get & Read the Fundamental, Macro Economics, COT Report, Geopolitical and News Analysis, Sentimental Outlook, Intermarket Analysis, Index-Specific Analysis, Future trend targets with Overall outlook score... go ahead to check 👉👉👉🔗🔗🌎🌏🗺
⚠️Trading Alert : News Releases and Position Management 📰🗞️🚫🚏
As a reminder, news releases can have a significant impact on market prices and volatility. To minimize potential losses and protect your running positions,
we recommend the following:
Avoid taking new trades during news releases
Use trailing stop-loss orders to protect your running positions and lock in profits
💖Supporting our robbery plan 💥Hit the Boost Button💥 will enable us to effortlessly make and steal money 💰💵. Boost the strength of our robbery team. Every day in this market make money with ease by using the Thief Trading Style.🏆💪🤝❤️🎉🚀
I'll see you soon with another heist plan, so stay tuned 🤑🐱👤🤗🤩

U.S. Dollar Index (DXY) Bullish Reversal Setup – 1H Chart Analy ENTRY POINT: 100.005
→ This is the area where the trade is suggested to enter long (buy).
🟥 STOP LOSS: Around 99.307
→ Placed below strong support to manage risk.
🟦 SUPPORT ZONE: 99.776 - 99.307
→ Strong historical demand zone, price has bounced from here before.
🟪 BREAKOUT ZONE: Near 100.5
→ If price breaks the trendline here, it may trigger bullish momentum.
🎯 TARGET POINT: 103.096
→ This is the take profit zone (blue box) with a potential gain of +3.29%.
📊 Trade Setup Summary:
✅ Buy Setup: Price approaching support zone, forming a potential reversal.
⚠️ Watch for breakout: Above the trendline to confirm bullish move.
✨ Great Risk-to-Reward: Small risk (tight stop), big reward.
