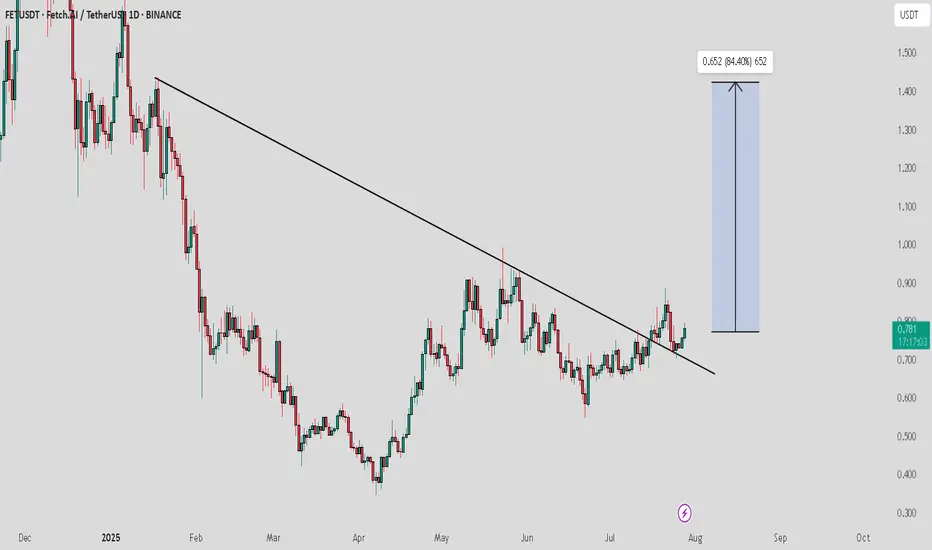
FET / USDT : Momentum building after successful retestFET/USDT has successfully broken out of the descending trendline resistance and is now holding strong after a successful retest. With momentum building, we are expecting a significant move towards the $1.5 level in the coming weeks.
Dyor
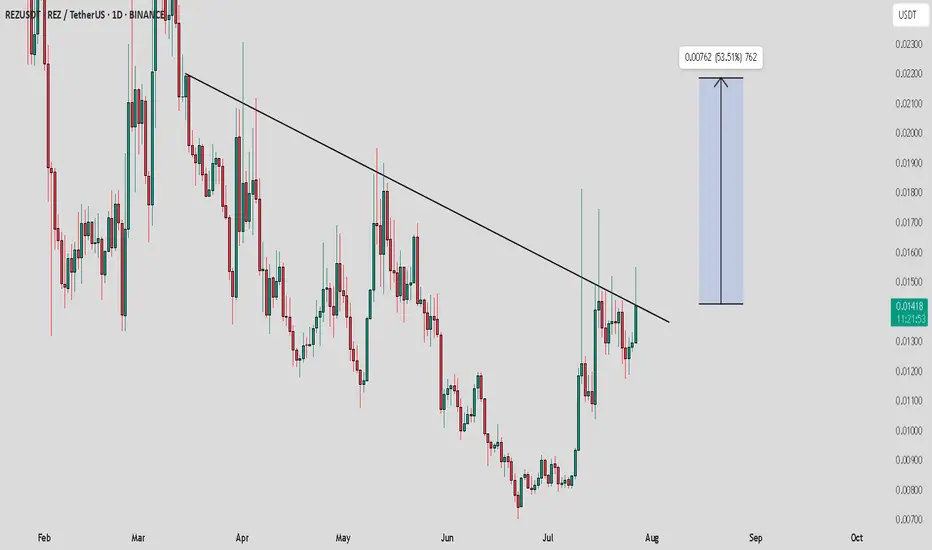
REZ / USDT : Trying to breakout from Trendline resistanceRez/USDT is currently testing a crucial trendline resistance. The chart shows signs of a potential breakout, and if it surpasses this resistance, we could see a strong move towards $0.0025. With increasing momentum, this could trigger a short-term bullish rally. 📈
Bullish Scenario:
If Rez/USDT breaks the trendline resistance decisively, we could see a price surge towards $0.0025.
Target: $0.0025 with a possible continuation beyond that if momentum builds.
Bearish Scenario:
If the price fails to break the resistance and gets rejected, we may see a short-term pullback.
Watch for a strong support zone to form for potential re-entry at lower levels.
Pro Tip:
1. Enter after breakout above trendline.
2. Set stop-loss below trendline.
3. Target $0.0025 for short-term gains.
SUI / USDT : Looking bullish SUI/USDT chart shows a breakout from a descending trendline, confirming upward momentum. Current price tests the resistance zone around $4.00. BTC is receiving support from the FVG, indicating short-term bullish potential.
Bullish Scenario: If price breaks above the resistance zone, a rally towards $4.50 to $5.00 is possible. Watch for confirmation of higher highs on shorter timeframes.
Invalid Setup: If price fails to break the resistance and falls back below $3.50, the bullish setup would be invalidated.
Pro Tip: Always wait for a clear confirmation candle above the resistance zone before entering a trade to minimize risk.

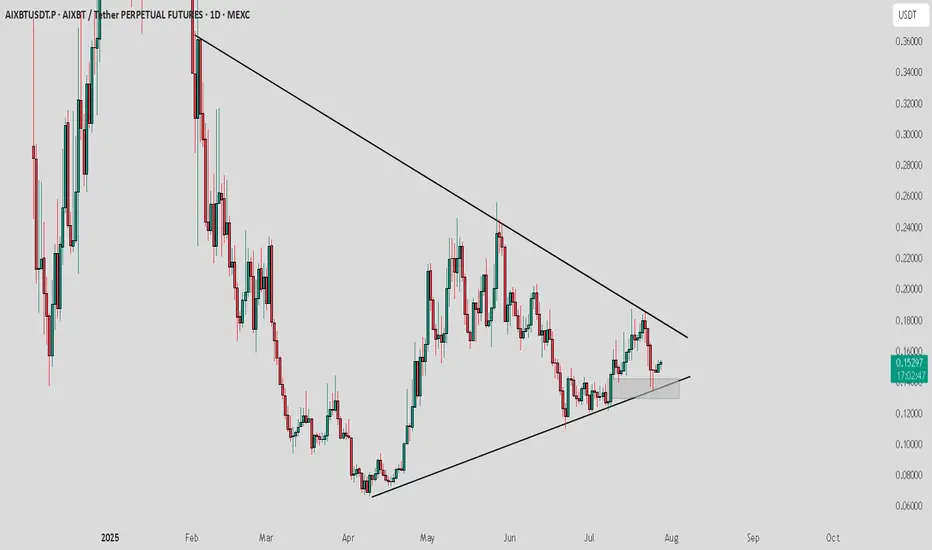
AIXBT / USDT : Getting support and moving towards resistance AIXBT/USDT is currently forming a symmetrical triangle pattern and testing a key support zone. A short-term rally of around 10% towards the upper resistance is expected, leading to a potential breakout.
Bullish Scenario:
A solid breakout above the upper trendline could initiate a major rally, targeting levels around $0.18 and higher.
Watch for confirmation of the breakout for a sustained move.
Targets for the short-term rally:
Expect a move towards $0.18 before the breakout happens. A major rally will commence once the breakout occurs. 🚀
Stay patient and keep an eye on the price action for potential entry points! 📈
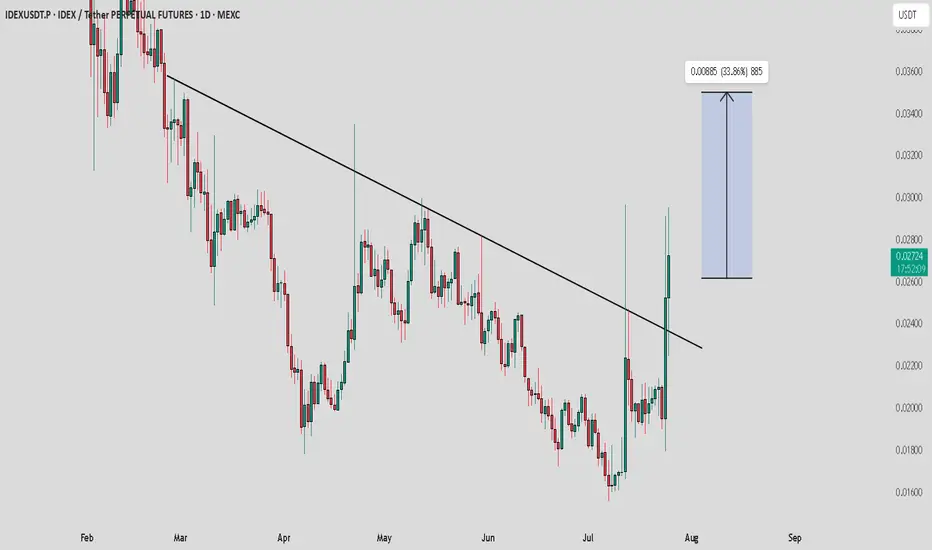
IDEX / USDT : looking bullish in choppy market situationThe overall market is not looking very strong right now, but IDEX is showing bullish potential. It's moving with strong volume and confirming its breakout with consistent bullish moves.
Key Points:
IDEX seems to be breaking out with solid momentum.
Watch for confirmation of continued bullish movement to ensure it’s not a fakeout.
Note:
Manage your risk carefully. Only invest money you can afford to lose. Always Do Your Own Research (DYOR) before making any decisions. Stay cautious and ensure you're prepared for any market fluctuations.
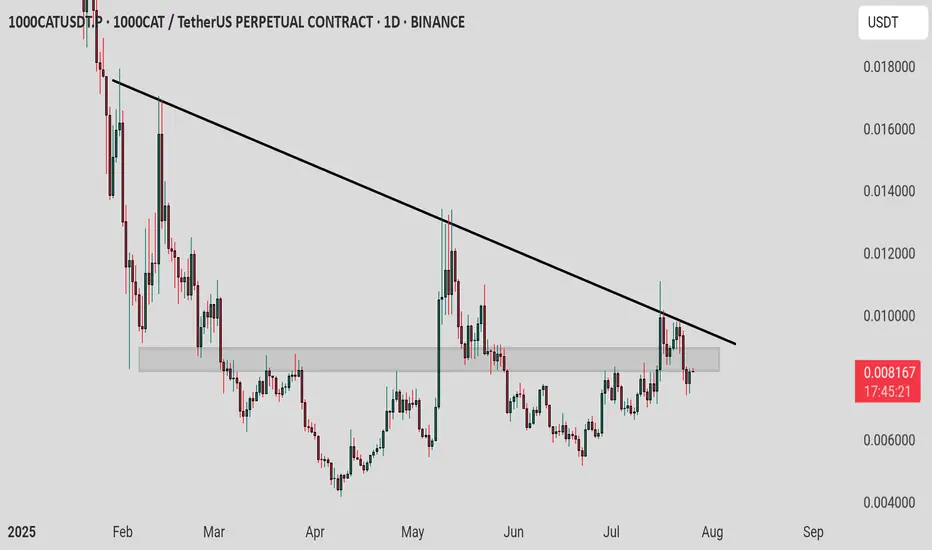
1000cat / usdt : Keep a close watch for rejection or breakout 1000CAT/USDT Analysis:
1000CAT/USDT is currently testing horizontal resistance and is near a potential breakout from the trendline resistance. This is a crucial level to watch for either a rejection or a breakout.
Key Levels:
Horizontal Resistance: Current price level.
Trendline Resistance: Near breakout.
Scenario 1: Breakout:
If the price breaks above both resistance levels, it could lead to a strong bullish move. Watch for confirmation on higher timeframes.
Scenario 2: Rejection:
If the price fails to break through and gets rejected at these levels, a pullback or reversal could occur.
Tip: Keep an eye on volume and confirmation candles to validate the breakout or rejection.
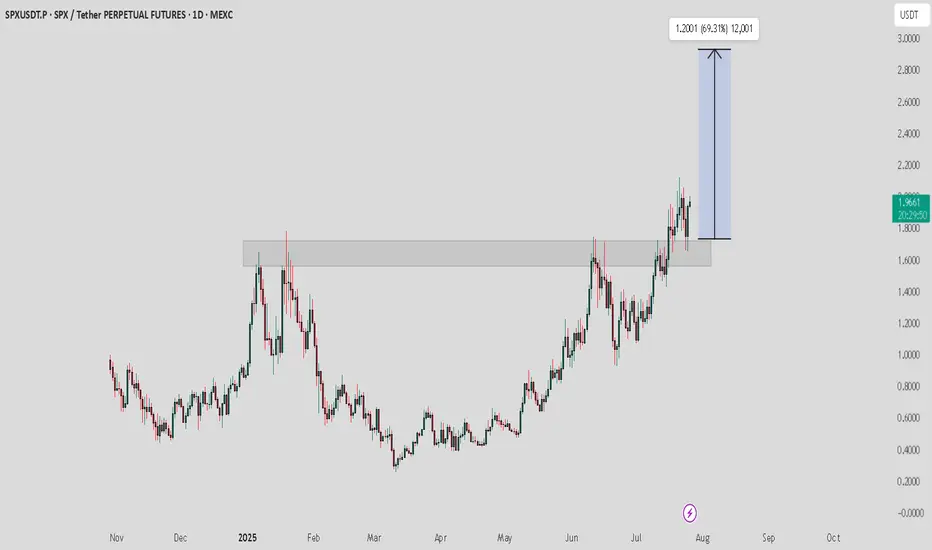
SPX / USDT : Broke out and now successful retestSPX/USDT has broken out from a consolidation zone, with the price approaching key resistance at $1.90. A sustained move above this level could push the price towards the $2.10-$2.40 range, offering a 6.3% upside.
Bullish Scenario: Price stays above support, targeting $2.10-$2.40.
Bearish Scenario: Breakdown below support invalidates the setup, signaling potential downside.
Risk Management: Monitor price action closely and adjust positions if support fails.
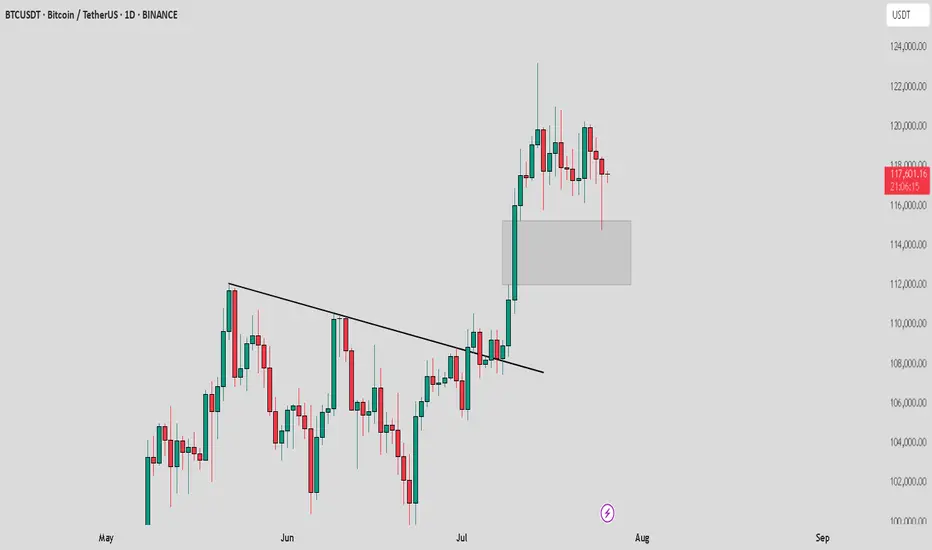
BTC /USDT : Getting support from FVG BTC Support from FVG - Bullish & Bearish Scenarios:
Bullish Scenario:
BTC is holding support from the FVG. As long as BTC stays above this zone, the market remains bullish. A bounce here could lead to further upside.
Bearish Scenario:
If BTC breaks below the FVG, it signals a potential downtrend. A breakdown may lead to more pain and further declines in the market.
Tips:
1. Wait for Confirmation: Look for a clear candle close above/below FVG for validation.
2. Risk Management: Set stops near the FVG to manage potential losses.
3. Monitor Volume: Strong volume during support retests increases bullish potential.
4. Stay Flexible: Be prepared for a market shift if BTC breaks the FVG support.
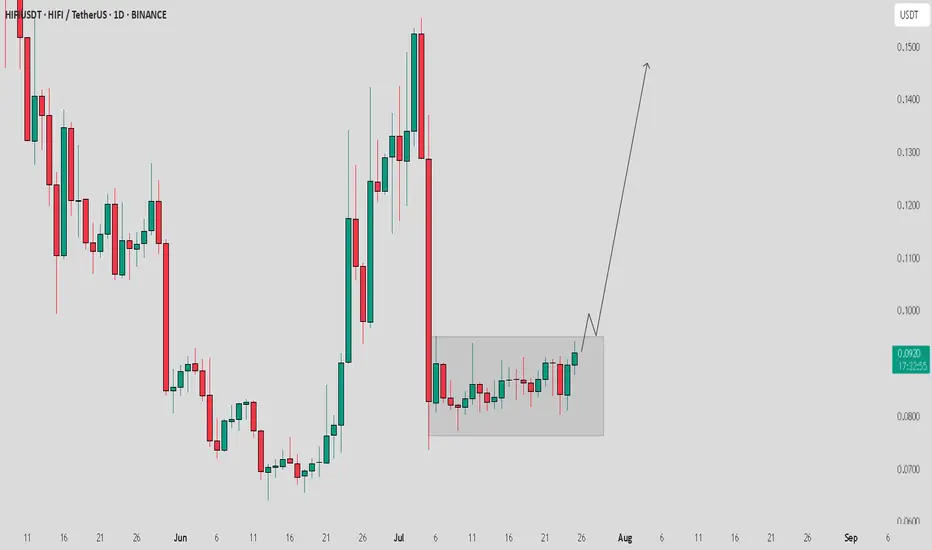
HIFI / USDT in consolidation zone heading to break through itHIFI/USDT Analysis:
HIFI/USDT is currently in a consolidation zone and seems to be heading towards a potential breakout. If it breaks through this zone, we could see a good move towards $0.14 soon, assuming the market remains stable.
Bullish Scenario:
Breakout above consolidation zone could trigger a strong move towards $0.14.
Confirmation: Watch for strong volume during the breakout to ensure the move is genuine.
Bearish Scenario:
Failure to Breakout: If the price fails to break through and stays within the consolidation, the setup might remain invalid.
Note:
Current market situation is not looking very strong right now. I hope the correction happens smoothly soon, but if the market remains unstable, this setup could become invalid. Always manage your risk and stay cautious.
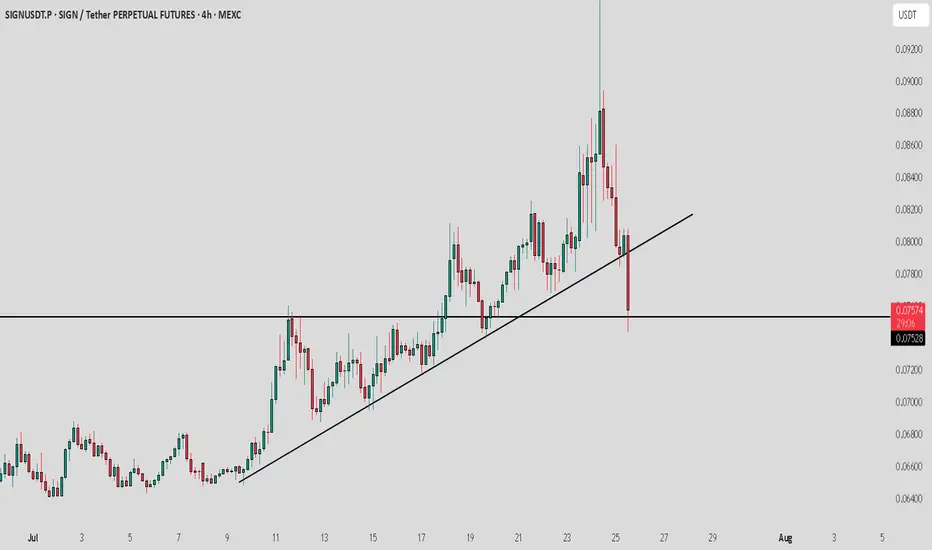
Sign / USDT : Huge breakdown and currently sitting on supportSIGN/USDT Analysis:
SIGN is testing a crucial support level. The price has pulled back from its recent highs and is now sitting on a key Horizontal line. How the market reacts here will determine the next move.
Bullish Scenario:
Horizontal line Support: If the price holds above the Horizontal line and shows signs of buying pressure, a bounce could happen, and we may see the price move back up towards the previous highs.
Confirmation: Look for strong bullish candles or an increase in volume to confirm the bounce.
Bearish Scenario:
Horizontal line Breakdown: If the price breaks below the Horizontal line and fails to recover, further downside could be expected.
Target: Watch for the next support level to gauge the downside potential.
Note:
The market is volatile, and a shakeout could happen at any moment. Manage your risk carefully and only invest what you can afford to lose. Stay cautious and watch for confirmation before entering any positions.
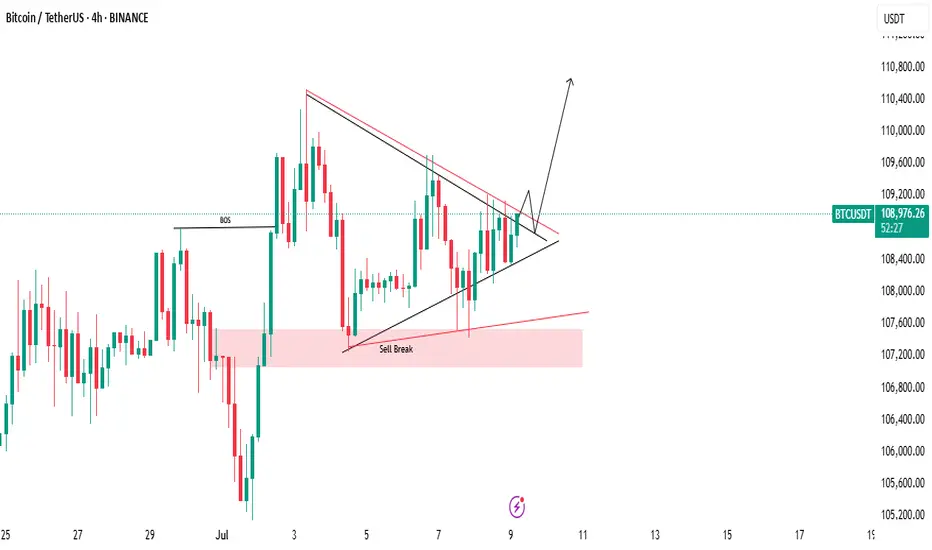
There’s a higher probability of an upward breakout.🚨 Bitcoin Technical Update – Key Levels Ahead! 🚨
Bitcoin is currently forming a symmetrical triangle pattern, a classic setup that often signals a strong move ahead. At the moment, the market is leaning toward the upside, showing early signs of bullish momentum.
📈 If we see a breakout to the upside, it's crucial to wait for a retest of the breakout level. A successful retest could confirm the move, setting the stage for a strong upward rally. However, if the breakout fails, don’t rush in — just observe the price action closely to see how the market reacts.
⚖️ There’s a higher probability of an upward breakout, as liquidity is still building above, and there are strong support levels holding below. This combination could act as a springboard for price to move higher.
🔍 As always, Do Your Own Research (DYOR) before entering any trade. Stay alert and manage your risk wisely!
Aevo
📊 Overview Analysis
The AEVO cryptocurrency, after a sharp downward movement, entered a consolidation range. Following a prolonged range-bound movement, the price managed to climb within an ascending channel on the 4-hour timeframe, reaching the top of its consolidation range.
🕰 4-Hour Timeframe Analysis
🔸 Current Status:
The price is challenging both the top of the ascending channel and the range ceiling.
Increased trading volume indicates growing liquidity in this area.
🔸 Bullish Scenario:
A breakout above the ascending channel's ceiling could trigger a parabolic move toward the green target zones.
🔸 Potential Risks:
An RSI divergence on the 4-hour timeframe suggests a possible pullback.
Corrections could extend toward the channel's midline or, in a more severe case, to the channel's lower boundary.
🎯 Price Targets & Key Considerations
🔹 Upside Targets:
Breakout to the green zones following an upward channel breach.
🔹 Downside Risks:
RSI divergence might limit upward momentum, leading to short-term corrections.
Maintaining support at the channel's midline or bottom is crucial for a sustained bullish outlook.
💡 Advice: Always employ risk management and rely on personal analysis when making trading decisions.
💡 Reminder: This analysis is for educational purposes only and should not be considered financial advice.

Xauusd going short in my opinionTapped 4H FVG and got rejection twice, US Elections etc i think avoiding trading is best for few days and i am not a financial advisor etc do your own research before making any decision

AUDNZD. Set to rise for next week!
On the daily timeframe the moving averages are setup in alignment and this trade is with the trend as the daily 200ema sits just below price.
On the 4HR timeframe there was some bullish RSI divergence where the RSI made a higher high but the AUDCHF went lower. This should also cause a momentum shift upwards.

My Analysis Of Gold Price Next Week - Another Big Short Possible
From what I can glean, the damage on Friday's Short came from an M_Top pattern on the Hourly-Chart. These breaches at the neckline are notorious for huge sell-offs.
One thing I am being mindful of is a more extensive M_Top pattern on the 4HR chart. But the scary thing is that the neckline is only 0.69% down the Gold-price corridor. Scary stuff hey!
But wait, there's more!
A breach of the neckline around 2482 could wind the Gold-price back to 2434. Now, I am not saying that is definitely going to play-out. We just have to be careful with the USDX again rallying next week. This is just a scenario that is possible. Why? Please read on below.
As it turns out, the 2434 level where price 'could-go' is right on the Daily-chart 50EMA and just below that is a firm 4HR support level at 2432. If this plays out, support would be made around 2432, and so long as price holds at this level there would also be firm support by the Daily 50 EMA.
Here is the Daily-Chart which supports my theory.
* This is my own analysis of the Gold-price. This does not constitute financial advice on whether you should be buying or selling the Gold-price.
* Trading is Risky. Please don't solely accept my setups or financial advice. Glean your research from a variety of professional traders.

How to Do Your Own Research (DYOR) in Crypto? – by WhiteBITDisclaimer: the following post was originally published by WhiteBIT .
Hello, Traders!
Have you ever heard the phrase “Do Your Own Research,” or DYOR? No, it's neither a trendy clothing brand nor just a catchy phrase — it's an important practice. DYOR has become the primary guiding principle for crypto investors to make informed decisions. Let’s explain what DYOR means and how to conduct your research effectively.
What Does DYOR Mean? Why Is It Important?
DYOR is a call to action for investors to research and dig into the fundamentals of any asset or project before investing. Sounds simple, right? But why is it so important? Well, think about it this way: the Internet is flooded with all sorts of information, and not all of it is reliable.
So, DYOR urges you to dig deep, find the facts, and make your own decisions. It is your shield against misinformation and hype. It’s about diving deep into the project’s details and understanding its technology, team, and market potential. By researching, you’re not just relying on someone else’s opinion — you’re forming educated conclusions. Now that we’ve covered why DYOR is critical, let’s look at some of the ways traders and investors used to do proper research.
How to Do Your Own Research? How to Research a Crypto Project?
Crypto research involves using various sources and tools to get all the information you need:
– Analytical Platforms: Visit popular analytics platforms to get a first impression of the cryptocurrency. These platforms offer essential data, including market capitalization, trading volume, price history, and other key metrics.
The numbers can tell you a lot. Take social media and community channels, for example. They can give you a sense of how popular a project is. But here’s the catch: 🚩 watch out for bots and fake accounts. They can skew the numbers and paint an inaccurate picture of real interest. So, ask yourself: Is the community actively engaged? Are conversations genuine and buzzing naturally?
You also need to consider factors such as asset price, market capitalization, circulating supply, total supply, daily active users, token/coin holder distribution, and trading volume to get a sense of the project’s progress and the community’s involvement.
– White Paper Analysis: It’s a smart move to dive into a project’s core documents, like the White Paper – the project’s manifesto. It’s crafted by the team to pinpoint a problem and lay out how their product, technology, or token/coin plans to solve it. These are the sources you must explore when doing crypto research. Key points also include the technology behind it, the development team, tokenomics, and the project roadmap.
– Sentiment Analysis: It is all about working out the general mood of the market or a specific asset. By understanding how investors feel about a cryptocurrency, you can identify whether it is overvalued or undervalued. Tools like the Fear and Greed Index can help track market sentiment.
– Competitor Analysis: Analyzing competitors helps you understand the strengths and weaknesses of various projects. Compare technologies, use cases, and market performance to identify the best investment opportunities.
– Project Website and Social Media Analysis: A website should provide transparent information about the team and technology. 🚩 include poorly designed websites, missed deadlines, and a lack of transparency. Media activity can offer insights into a project's community and current status. Look out for active and engaged followers, how often the project updates, and what kind of community interactions there are.
Questions to Answer Before Investing
Before diving into any cryptocurrency investment, it's essential to ask yourself several key questions to ensure you're conducting thorough research. Here's a checklist to guide your DYOR crypto process:
What Problem Is the Project Solving?
How Does It Differ from Competitors?
Does It Follow Its Roadmap and White Paper?
What Are the Legal Regulations in Your Country?
Has It Raised Funding? Who Are the Investors?
Who Are Its Partners and Supporters?
How Is It Promoted? What Marketing Strategies Are Used?
What Are the Trends on Google and Social Media?
What Is the Tokenomics? How Are Tokens Distributed?
Are There Any Red Flags?
So, doing your own research is more than just a suggestion. Any information you can gather about a crypto project is invaluable and worth the time and effort. The more you know, the better equipped you are to make informed decisions and avoid potential pitfalls.
Remember, “Knowledge is power". As Benjamin Franklin famously said, “An investment in knowledge pays the best interest.” So, commit to your due diligence—your future self will thank you. D.Y.O.R.

How to Do Your Own Research (DYOR) in Crypto?Hello, Traders!
Have you ever heard the phrase “Do Your Own Research,” or DYOR? No, it's neither a trendy clothing brand nor just a catchy phrase — it's an important practice. DYOR has become the primary guiding principle for crypto investors to make informed decisions. Let’s explain what DYOR means and how to conduct your research effectively.
What Does DYOR Mean? Why Is It Important?
DYOR is a call to action for investors to research and dig into the fundamentals of any asset or project before investing. Sounds simple, right? But why is it so important? Well, think about it this way: the Internet is flooded with all sorts of information, and not all of it is reliable.
So, DYOR urges you to dig deep, find the facts, and make your own decisions. It is your shield against misinformation and hype. It’s about diving deep into the project’s details and understanding its technology, team, and market potential. By researching, you’re not just relying on someone else’s opinion — you’re forming educated conclusions. Now that we’ve covered why DYOR is critical, let’s look at some of the ways traders and investors used to do proper research.
How to Do Your Own Research? How to Research a Crypto Project?
Crypto research involves using various sources and tools to get all the information you need:
– Analytical Platforms: Visit popular analytics platforms to get a first impression of the cryptocurrency. These platforms offer essential data, including market capitalization, trading volume, price history, and other key metrics.
The numbers can tell you a lot. Take social media and community channels, for example. They can give you a sense of how popular a project is. But here’s the catch: 🚩 watch out for bots and fake accounts. They can skew the numbers and paint an inaccurate picture of real interest. So, ask yourself: Is the community actively engaged? Are conversations genuine and buzzing naturally?
You also need to consider factors such as asset price, market capitalization, circulating supply, total supply, daily active users, token/coin holder distribution, and trading volume to get a sense of the project’s progress and the community’s involvement.
– White Paper Analysis: It’s a smart move to dive into a project’s core documents, like the White Paper – the project’s manifesto. It’s crafted by the team to pinpoint a problem and lay out how their product, technology, or token/coin plans to solve it. These are the sources you must explore when doing crypto research. Key points also include the technology behind it, the development team, tokenomics, and the project roadmap.
– Sentiment Analysis: It is all about working out the general mood of the market or a specific asset. By understanding how investors feel about a cryptocurrency, you can identify whether it is overvalued or undervalued. Tools like the Fear and Greed Index can help track market sentiment.
– Competitor Analysis: Analyzing competitors helps you understand the strengths and weaknesses of various projects. Compare technologies, use cases, and market performance to identify the best investment opportunities.
– Project Website and Social Media Analysis: A website should provide transparent information about the team and technology. 🚩 include poorly designed websites, missed deadlines, and a lack of transparency. Media activity can offer insights into a project's community and current status. Look out for active and engaged followers, how often the project updates, and what kind of community interactions there are.
Questions to Answer Before Investing
Before diving into any cryptocurrency investment, it's essential to ask yourself several key questions to ensure you're conducting thorough research. Here's a checklist to guide your DYOR crypto process:
What Problem Is the Project Solving?
How Does It Differ from Competitors?
Does It Follow Its Roadmap and White Paper?
What Are the Legal Regulations in Your Country?
Has It Raised Funding? Who Are the Investors?
Who Are Its Partners and Supporters?
How Is It Promoted? What Marketing Strategies Are Used?
What Are the Trends on Google and Social Media?
What Is the Tokenomics? How Are Tokens Distributed?
Are There Any Red Flags?
So, doing your own research is more than just a suggestion. Any information you can gather about a crypto project is invaluable and worth the time and effort. The more you know, the better equipped you are to make informed decisions and avoid potential pitfalls.
Remember, “Knowledge is power". As Benjamin Franklin famously said, “An investment in knowledge pays the best interest.” So, commit to your due diligence—your future self will thank you. D.Y.O.R.

Comprehensive Analysis of Solana (SOL) Bull Market and Future PrSolana (SOL) has captured the attention of traders and investors alike with its impressive price movements and robust technology. This comprehensive analysis dives into the current state of Solana's bull market, examining key indicators, historical trends, and potential future scenarios based on the weekly chart data.
Historical Context and Past Bull Markets
Solana has experienced several notable bull markets in the past, with the most significant occurring from late 2020 to mid-2021, lasting approximately 7-8 months. These periods were characterized by rapid price appreciation and heightened market activity, driven by strong market sentiment and broader cryptocurrency market cycles.
Current Market Analysis
Key Support and Resistance Levels
Support Zones:
$130.13: Immediate support level.
$99.47: Important mid-level support.
$61.54: Critical long-term support.
Resistance Zones:
$160.79: Significant resistance level.
$204.45: Higher resistance level indicating potential upside targets.
Technical Indicators
Moving Averages (MA):
The fast MA (9-week) is above the slow MA (21-week), indicating a sustained bullish trend.
Relative Strength Index (RSI):
Currently in a neutral zone, not indicating overbought or oversold conditions, suggesting room for further price movements.
MACD (Moving Average Convergence Divergence):
Positive but showing signs of weakening momentum. A bullish crossover in the normalized MACD line above the signal line would reinforce the bullish scenario.
Enhanced Indicators:
Large Traders Index (LTI): Increased activity by large traders often precedes significant market moves.
Retail Traders Index (RTI): Measures the activity of retail traders.
Normalized Combined Volatility: Indicates potential for significant price movements.
Market Sentiment and Volatility
The enhanced normalized volatility suggests a period of high market activity, typical in bull markets. Increased activity by large traders (blue line) and retail traders (red line) provides insights into market sentiment, with large trader activity often indicating upcoming major moves.
Future Projections
Short-Term (Next 3-6 Months)
Bullish Scenario:
If Solana maintains support above $130.13 and bullish indicators remain strong, we could see a continuation of the uptrend, potentially testing the $160.79 resistance level.
Bearish Scenario:
A break below $130.13 could lead to a test of the $99.47 support level. A sustained move below this level might signal further downside.
Medium-Term (6-12 Months)
The bull market could potentially extend, with the possibility of reaching new all-time highs driven by strong market sentiment, technological advancements, and broader market recovery.
Long-Term
Bull markets in cryptocurrencies can last beyond a year, influenced by major events, adoption, and technological progress. Continuous monitoring of key support and resistance levels, along with broader market trends, will be crucial.
Conclusion
The current bull market for Solana shows strong potential for continuation, with key support levels at $130.13 and $99.47 providing crucial benchmarks. Breaking the $160.79 resistance level could signal further upside. Monitoring technical indicators like the moving averages, RSI, MACD, and enhanced volatility measures will provide valuable insights into the market's direction.
Based on historical trends and current analysis, the bull market could last another 3-12 months.
P.S. My scripts are free to download.

ETH setup in the choppy marketlet us see where the ETH will go in this choppy market. to the moon or to the bone? wish me luck!

Solana bearish feelingThis is not a financial advice, I'm just expressing my first thought how Solana price may move.
Think of this as my personal prediction, to later evaluate, as of how accurate I was.
Why I feel bearish:
The memecoin ecosystem, in Solana DeFi, is packed with con artists, that find ways to trick the masses into "investing" in fraudulent schemes, consequently resulting in a loss of interest by the fresh rookies, that find their way into Crypto.

bulish pattern on BTCRTM flag limit formation on BTCUSDT Pair chart!
there is demand base at price level 50300 to 51700.
this is good opportunity to buy some btc and ALTs in my opinion
#NFA
#DYOR

Thoughts on TruFi and the potential trend on RWA.Good deals, and may luck be on your side. Good day, dear readers. Today I suggest taking a look at the TruFi token. I'm not recommending buying it, but rather considering it from an investment perspective for the upcoming bull market.
In brief, TruFi is a lending protocol (lend/borrow) linked to RWA (real-world asset tokenization). The system even has its own not very successful stablecoin, which has recently been somewhat detached due to various events involving Binance, Justin Sun, etc., although as claimed by the teams and other people, this stablecoin was fully backed by dollars.
The token and platform's interest lies in its interaction with the real world. In my humble opinion, tokens from this sector will experience hype during market growth. Additionally, loan defaults lead to quite real legal consequences (with their pros and cons). As far as I understand, market participants (crypto enthusiasts, hodlers, coin holders, and ordinary people unrelated to institutional investments) can provide liquidity to the DeFi protocol. After that, a borrower who can borrow money, not in ethers or bitcoins, but in dollars, can be found.
Observing the perplexing movements of the stablecoin, I intentionally write this review to draw your attention to this asset. This is not a call to buy at current prices, as the price could very well break new lows before trending upward or stagnating. Nevertheless, this is a rather risky investment, suitable for a short-term peak and the first downturn of the bull market, but with the potential for decent returns. Since hitting bottom, the token has only risen by 120%, and the first subsequent minimal target would be beyond local highs, likely much higher. Even upon reaching this target, we could expect a 130% profit from this position. My motivation for investing in it (although I bought earlier and now hold about 40%) is the price bottom, token revival (albeit not very successful, as the daily candle was extinguished), prolonged accumulation, high previous highs, and potential hype associated with RWA.
The target on the chart is minimal and conditional, and cup-and-handle formations often do not play out and are frequently fictitious.
If you do seriously consider the possibility of acquiring the token, be sure to study it independently and at least read about it, as from the perspective of conservative investments, this is an extremely risky deal. I strongly advise against investing more than 0.5%-1% of your total portfolio.
This review is a work of fiction and is not an investment recommendation.

EOS Bull Market getting started In my point of view EOS was playing a flat correction as 2nd wave and it is over. As the downtrend line broken it seems to 3rd wave has started. In that case EOS can reach even 25$-30$ in coming years.
DYOR
