BTCUSDT LONG- Signal: LONG
- Entry: BTCUSDT 118,460 ~ 118,500
- Take Profit: 118,940 / Stop Loss: 118,380
Earnings

ETHUSDT LONG- Signal: LONG
- Entry: ETHUSDT 4,048.0 ~ 4,049.5
- Take Profit: 4,056.8 / Stop Loss: 4,046.2

ETHUSDT LONG- Signal: LONG
- Entry: ETHUSDT 4,220.8 ~ 4,222.5
- Take Profit: 4,232.6 / Stop Loss: 4,218.4

SOLUSDT LONG- Signal: LONG
- Entry: SOLUSDT 178.55 ~ 178.70
- Take Profit: 179.32 / Stop Loss: 178.38

SOLUSDT LONG- Signal: LONG
- Entry: SOLUSDT 176.95 ~ 177.10
- Take Profit: 177.68 / Stop Loss: 176.78

ETHUSDT- Signal: LONG
- Entry: ETHUSDT 4,012.8 ~ 4,014.2
- Take Profit: 4,019.6 / Stop Loss: 4,010.1

Wix | WIX | Long at $124.35NASDAQ:WIX is a company with steady growth projections driven by AI adoption, market expansion, user acquisition, and a focus on profitability. For example, earnings are forecast to grow 28.24% per year. Analysts project NASDAQ:WIX to achieve approximately $1 billion in free cash flow by 2028. While the current P/E is around 47x, its Forward P/E ratio is approximately 18x (potentially undervalued). I truly believe the changing economy will shift individuals into more entrepreneurship (what else can they do?) and that will be the driving force behind user growth.
From a technical analysis view, the price recently bounced off from my historical simple moving average band (often an area for share accumulation / consolidation). While it may trickle down to close the price gap on the daily chart near $110 in the near-term, I think the outlook needs to be long-term here given the projections. The only issue I see is the current high debt for NASDAQ:WIX , but interest rates are absolutely coming down soon which will help ease the strain.
Thus, at $124.35, NASDAQ:WIX is in a personal buy zone.
Targets into 2028:
$175.00 (+40.7%)
$250.00 (+101.1%)

A valuable patentThe company's new patent grant could boost its stock price by about 30 percent, even after the dividend.

S&P500: Stocks and Tariff, what is next?US indices were bullish so far despite the NEW HUGE tariffs. As the tariffs become in play by Aug 1st, we shall see its effect in Q3 results, Q2 earnings beats, but will Q3 do ?
Disclaimer: This content is NOT a financial advise, it is for educational purpose only.

SPY Pull back into another earnings week?An engulfing weekly candle is no joke. Sellers are in control.
There is a strong possibility of a pull back and with bias being short, I am looking for a strong LH on the 1/2HR TF to form at 6330 as 50% or 6370- 6375 near the weekly POC.
Confluences for Pull back scenario
- Price bounced off 38.2% fib from 5930 to ATH
- Price found support at 200 ema on 4HR
- 1 HR MACD is building up bullish signal
Have a great week all!

PEG post earnings gap upYesterday after the earnings , in total rose by +44%. Its get stuck at the weekly resistance.
Entry: Option October 17 45 call. It could go further down, support around 39. The volume on the PEG candle is huge, I assume it will be the fuel to rise to 60.
Stop: at the low of the PEG candle.Target: next weekly resistance, 60.
JELD-WEN Holdings | JELD | Long at $4.02JELD-WEN Holdings NYSE:JELD designs, manufactures, and sells wood, metal, and composite materials doors, windows, and related building products in North America and Europe. The stock has taken quite a beating since the rise in interest rates, and I think a reversal *may* be in sight in the next year as rates are slowly lowered - even if the market is forward-thinking and purely anticipating a new housing boom (which I highly doubt given the current home prices). Regardless, there is risk with this stock since it has relatively high debt (debt-to-equity of 2.61x). A Quick Ratio of 1.1 and Altman's Z Score of 1.9 puts NYSE:JELD near a medium level of bankruptcy risk. The company has pretty good cash reserves and a forward P/E of 10x (current is negative), so growth is anticipated. Book value of $5.31.
A bear case here is a terrible earnings call in August 2025 due to the housing market slowing (i.e. people pausing home purchases/builds/repairs expecting interest rates to drop soon). That may plummet the stock near $1.00 or below, which would be a tremendous deal, *unless* the company fundamentals change (like bankruptcy).
Without a crystal ball, yet understanding the forward-thinking aspects of the market, NYSE:JELD is in a personal buy-zone at $4.02 with some risks.
Targets into 2027:
$5.40 (+34.3%)
$8.50 (+111.4%)

The successful trader anticipates activity in BSC🔁 Wallet 0x1ebab9c329317082577f0e495cbe5b0d4958c5e7 just bridged: 4 000 USDC left Ethereum → HitBTC, then 3 915 USDC hit BNB Chain minutes later.
DefiLlama shows ~$14M fresh inflows today in BSC, while ETH flows cool—signaling a rotation play.
Expect this whale to farm BSC yield or snipe rising alts next 📈
🔝 Score: #39 | Balance: $13.4k | Results: $16.4k→$219.5k (+1,340 %, 44 trades, avg buy $1,020 / sell $2,643).

CVX: Chevron stock slidingPresident Trump policies to support oil companies aiming to increase oil supply in the market and hence to reduce oil prices not to increase it, which mean lower margins for oil companies.
Disclaimer: This content is NOT a financial advise, it is for educational purpose only.

reddit price to earnings ratios up to 2027i believe reddit is very overpriced at
this graph shows different pe ratios if we follow the eps expected in the future
(ignore the doted lines)

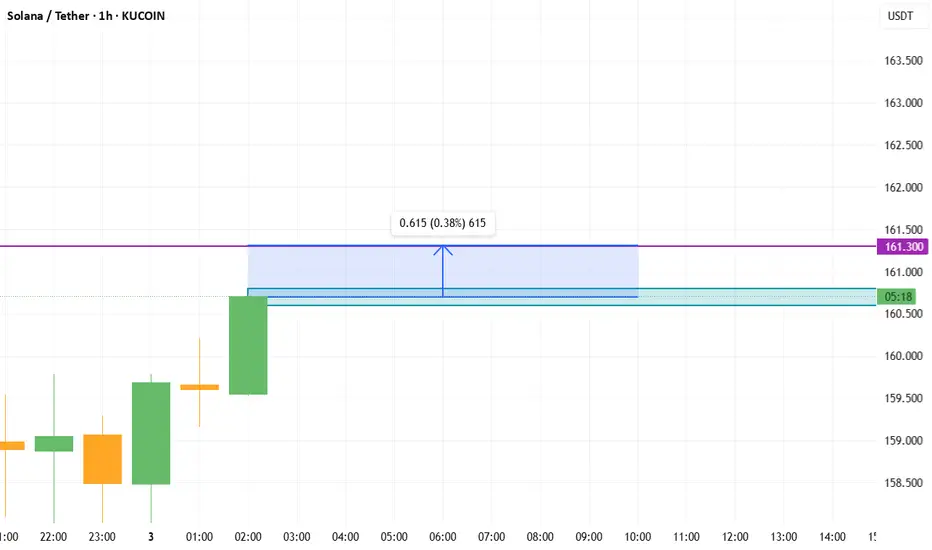
SOLUSDT Direction of operation: Long (Buy)Entry Points: 160.60 ~ 160.80 USDT Batch Pending Order Entry
Take Profit Target: 161.40 ~ 161.60 USDT Interval Gradual Take Profit
-Close all positions if you reach the take-profit limit, and don't get attached to the battle.-
IONQ: is it the time to secure IonQ position ?Next week we will have some quantum computing stocks that announce earnings results, so will see if it the time to secure this position. Noting that this is a very long-term position, the company still not profitable yet.
Disclaimer: This content is NOT a financial advise, it is for educational purpose only.

KIMLUN - DMI and RSI shows BULLISH SIGNAL KIMLUN - CURRENT PRICE : RM1.31
KIMLUN is in an uptrend for medium term as the price is making higher high and higher low. Supported by positive readings in technical oscillators such as DMI (+DI is above -DI) and RSI (above 50), it increases the bullish scenario. At current price trading near SMA 20, there is possibility for price reach upper band in bollinger bands indicator. Nearest support will be RM1.24 (-5.34%) and 1st target will be RM1.41 (+7.63%).
ENTRY PRICE : RM1.30 - RM1.31
TARGET : RM1.41 and RM1.47
SUPPORT : RM1.24
Notes : On the fundamental side, KIMLUN shows a strong recovery in earnings. For FY2022, company was loss RM7.2 million. Then the company rebounded with a profit of RM7.1 million in FY2023. For FY2024, company registered strong performance of profit RM50.3 million.

Novo Nordisk (Revised) | NVO | Long at $47.78**This is a revised analysis from February 5, 2025: I am still in that position, but added significantly more below $50**
Novo Nordisk NYSE:NVO is now trading at valuations before its release of Wegovy and Ozempic... From a technical analysis perspective, it's within my "major crash" simple moving average zone (gray lines). When a company's stock price enters this region (especially large and healthy companies) I always grab shares - either for a temporary future bounce or a long-term hold. While currently trading near $47 a share, I think worst case scenario here in 2025 is near $38-$39. Tariffs may cause a recession in the second half of 2025, so no company would be immune.
As mentioned above, I am still a holder at $86.74. However, I went in much heavier within my "major crash" simple moving average band and have a final entry planned near $38-$38 (if it drops there). My current cost average is near $55.00.
Why do I still have faith in NYSE:NVO ? Because no one else does right now, yet it generated $42 billion in revenue, $14 billion in profits, and has significant cash flow YoY. The company has a massive pipeline, despite Wegovy and Ozempic competition, and I think the market is undervaluing its position in the pharmaceutical industry.
Revised Targets in 2028:
$60.00 (+25.6%)
$70.00 (+46.5%)
$80.00 (+67.4%)

Review a Few of our Trades & Update Overall Market PerspectiveIn this video, I review some of the trades taken over the past 1-2 weeks, and discuss in more detail the current technical and geopolitical/macro thesis on AMEX:SPY NASDAQ:QQQ NASDAQ:SQQQ AMEX:SOXS , and the overall market. Exciting times, and ripe with opportunity to *potentially* BTD (again).

charge fees on patentsTrump's decision to charge fees on patents exposes IDCC shares to long-term decline

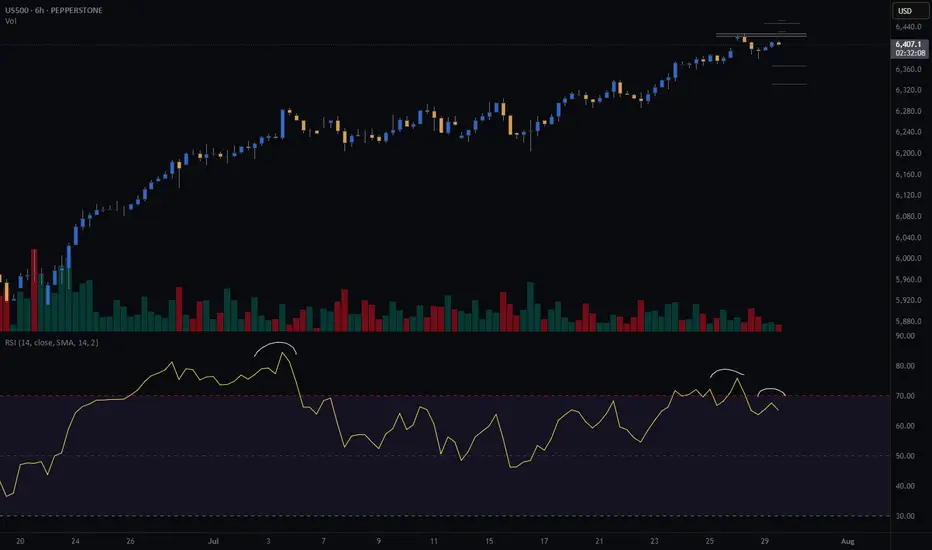
S&P500 (CASH500) SHORT - Double top H6Risk/reward = 3.7
Entry price = 6432.6
Stop loss price = 6 454.1
Take profit level 1 (50%) = 6367.7
Take profit level 2 (50%) = 6332.6
Still need confirmation from some variables before entering the trade
BA: Boeing down on better than expected results! 30-07-2025Yesterday we get Boeing earnings report which came better than expected, but the stock down more than 4% as the company is not expected to make positive profit or free cashflow before 2026. No dividends currently paid, so there is nothing attractive to me now.
Disclaimer: This content is NOT a financial advise, it is for educational purpose only.
