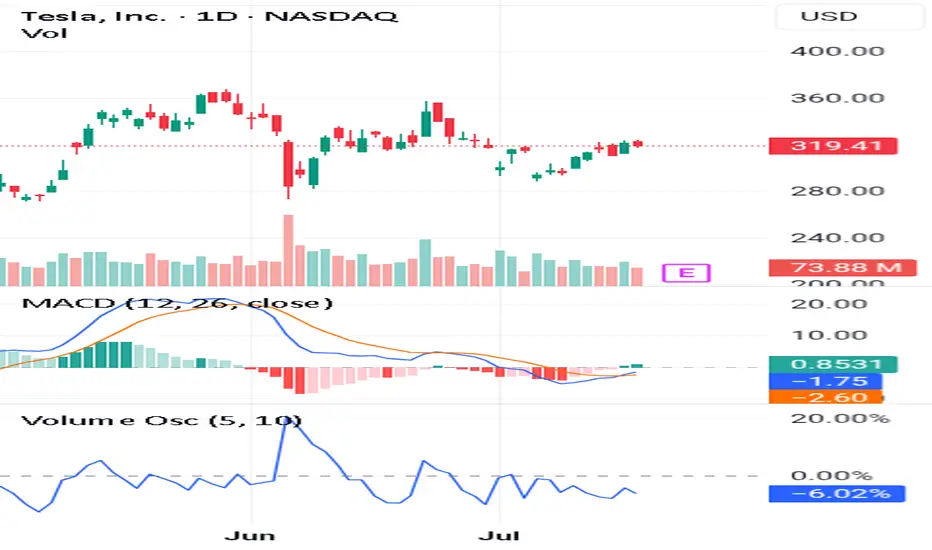
(Learn More)Use These 3 Steps To Spot Long-Lasting Trends👉Trade before the earnings report
👉Make sure the volume oscillator is below zero
👉Make sure the MACD lines give you a Bullish signal
If you look at this chart you can see all the steps alignment.
This is very important because you want to catch a long term trend.
Also it has to follow the 3step rocket booster strategy.
In order for you to learn more about this strategy 🚀 Rocket Boost This Content.
Disclaimer ⚠️ Trading is risky please learn how to use Risk Management And Profit Taking Strategies. Also feel free to use a simulation trading account before you use real money.
Earnings
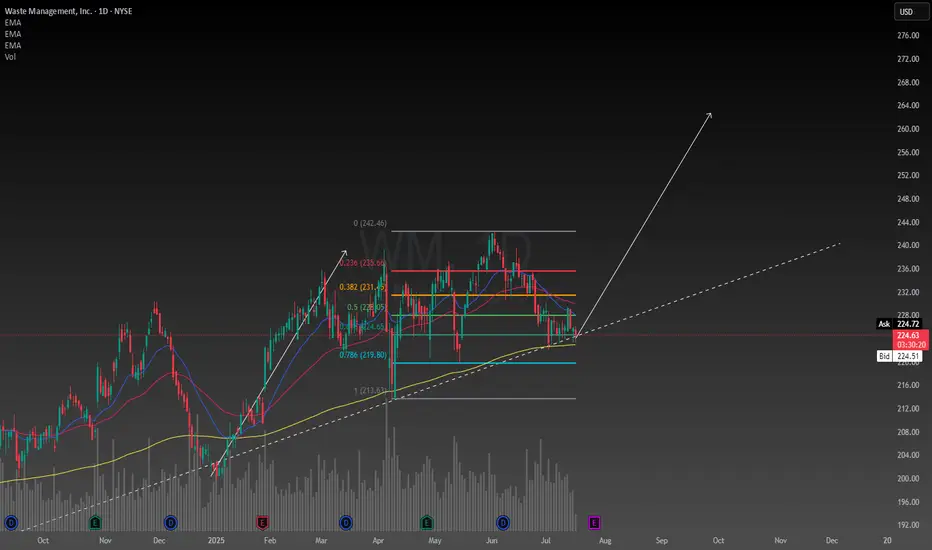
Waste Management confluencesFirst of all fundamentally the company is basically essential to our survival so I have no reason to believe they will go out of business any time soon. Earnings report soon should bring about some volatility. I was foolish enough to buy the top a couple months ago and deciding today I will add the the position because I like this price. Even though I bought the top, it was still below the intrinsic value at the time so it was a reasonable decision.
With my simple trendline and rudimentary use of a Fibonacci I am able to set a price target of $260 depicted by my drawing of a potential new leg up. This is backed up by the absolutely fundamental usage of a calculation of the intrinsic value, which by my calculation is $280, and has a range between $170-$640 however these numbers may need to be adjusted after the earnings report. The value is now well below the intrinsic value so I am seeing this stock as a really good deal now.
Despite any uncertainty in the economy Waste Management has seemed to outperform during these times so it is in my portfolio defensively. This stock is strong when it needs to be, which is why I like it.
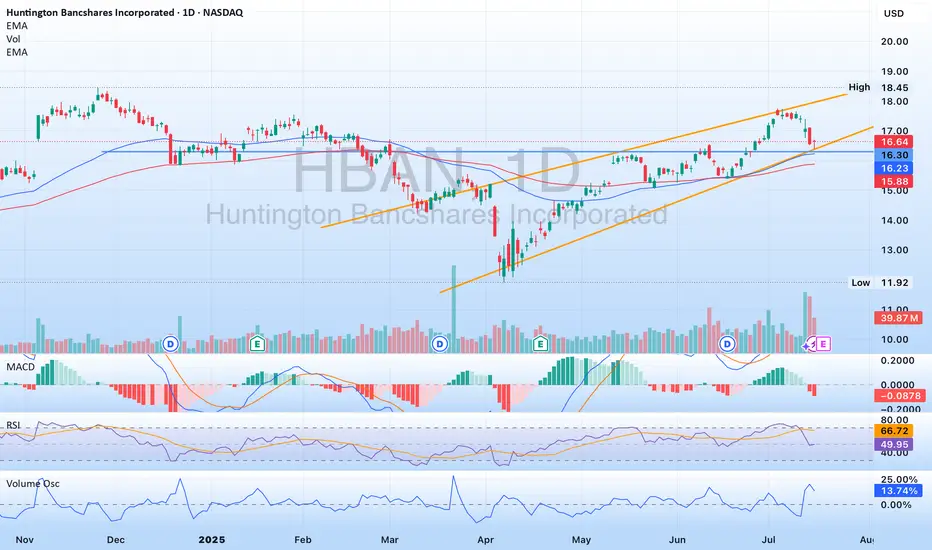
$HBAN - well positioned to continue on its pathNASDAQ:HBAN has been in a rising channel since April, and is no touching the lower band of the channel. His area also includes some previous resistance turned support, as well as some movement paces. NASDAQ:HBAN recently announced they are acquiring Veritex ( NASDAQ:VBTX ) which will strengthen their mark in Texas. Please note NASDAQ:HBAN is releasing earnings July 18th. A good report should see the stock moving towards the upper band of the channel, maybe break through it.
Double Calendar Option Spread on MMMUsing a double calendar spread to profit from price movement in either direction after earnings announcement in 3 days time (18 July) for MMM.
These trades can be extremely profitable if one expects movement after earnings.
Selling both a Put and Call at high (pre-earnings IV) makes this option trade relatively cheap, since the purchase for the other Call and Puts are after earnings announcement with lower IV
Selling a Call with Strike $167 for 18th July
Selling a Put with Strike $145 for 18th July
Buying a Call with Strike $175 for 29 Aug
Buying a Put with Strike $140 fro 29 Aug
Total net debit and max loss $125 for 1 contract
Max profit $ 287
For more details on these type of Option trades you can search for Strategic Options Trader on Substack

“How Other People’s Fear Becomes Our Profit”From a behavioral and technical standpoint, LEVI presents a textbook short opportunity following its post-earnings overreaction. After a strong earnings beat, the stock surged over 13% intraday, reaching a high of $22.07. However, this rally quickly pushed RSI into overbought territory, triggering natural selling pressure. Much of this sell-off can be attributed to traders who previously bought near the $21–$22 range and are now looking to exit at breakeven—a classic example of loss aversion and anchoring bias. This emotional response often leads to temporary price spikes followed by sharp corrections. We are now observing that exact pattern, with the stock fading to $21.92 in after-hours and closing at $21.95, signaling buyer exhaustion.
Technically, this marks a short-term trend reversal—from bullish earnings momentum to a developing downtrend. The price action shows rejection at key resistance, weakening volume, and emotional exit zones being triggered. Now is a clean, high-probability shorting opportunity, with potential to capture 2–7% downside in the next 1–2 sessions, especially as the broader market reacts to inflated valuations and profit-taking behavior.

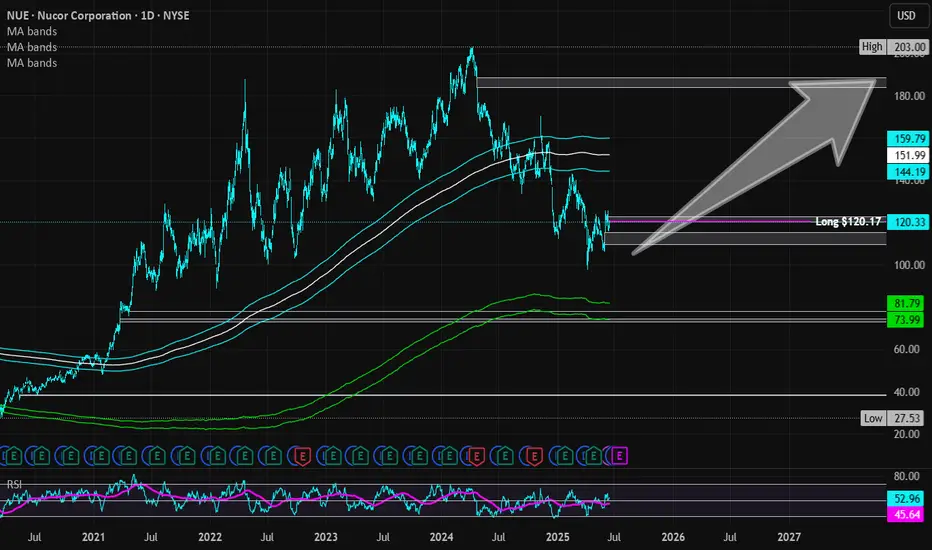
Nucor | NUE | Long at $120.17Nucor NYSE:NUE , a US manufacture of steel and steel products, will likely capitalize on reduced foreign competition as tariffs become reality. The CEO also recently stated that the steelmaker's order backlog is the largest in its history and is increasing prices. So, while there is a potential for short-term downside as tariff "unknowns" are negotiated, the longer-term upside may be there for those who are patient... but time will tell.
Basic Fundamentals:
Current P/E: 21x
Forward P/E: 15-16x
Earnings are forecast to grow 29.6% per year
Projected Revenue in 2025: $32.3 billion
[*} Projected Revenue in 2028: $39.4 billion
Debt-to-Equity: 0.4x (healthy)
Dividend Yield: 1.8%
Technical Analysis:
Riding below the historical simple moving average and there is risk the daily price gap near $109 will close before moving higher. If there is a "crash" in price, $70s is absolutely possible which will be a "steel" if fundamentals do not change.
Targets in 2027:
$142.00 (+18.2%)
$187.00 (+55.6%)
Green Plains | GPRE | Long at $4.18Green Plains NASDAQ:GPRE , a company involved in the production of fuel-grade ethanol and corn oil, and grain handling/storage has seen a significant decline in stock price since 2023. Analyzing the company's historical stock performance shows it is highly cyclical and goes through "boom and bust" cycles every 4-8 years - whereby during booms the price has typically 10x'ed from the lows. History may not repeat, though.
From a pure technical analysis perspective, the company has already entered and slightly exited by "crash" simple moving average zone (green lines). While the lows may not be in yet, this zone (currently between $1.20 and $3.30) typically represents a longer-term bounce area or price consolidation.
Fundamentally, the company is currently unprofitable but expected to become profitable in 2026 and beyond. Debt-to-equity = 0.72x (low/moderate). Price-to-book = 0.31x. During the most recent earnings call, Chief Legal and Administration Officer at Green Plains noted the company’s past performance has not met expectations, but stressed “that is changing.” This includes exiting non-core operations and launching the sale of non-strategic assets in a commitment to achieve $50 million in cost reductions. The company is on track to meet that goal and has already achieved $30 million in annualized cost savings.
It's a speculative play that could go to $0. But at $4.18, NASDAQ:GPRE is in a personal buy zone based on technical analysis as well as future fundamental predictions (which could be BS...).
Targets:
$6.00
$8.00

ITS TIMEGME coiled on the 4hr RSI break 50 were launching from the POC area to 24.50 to next MA. Overall target after taking 26 is VAH around 27.58. The drop down was profit taking/ overextended /sell the news after all the hype leading into the btc purchase announcement they didn't disclose purchase price either from what I know. But btc is at ATH the 500M is now in decent profit and last quarter rev and earnings were good. Last time gme broke out was 17% on a overall stock market correction day, seems like thats going to be the case again for now im in the Aug 1 25 calls for .6 looking to close these in profit and roll to higher further out strike like the jan 26 35. cheers, here kitty kitty.

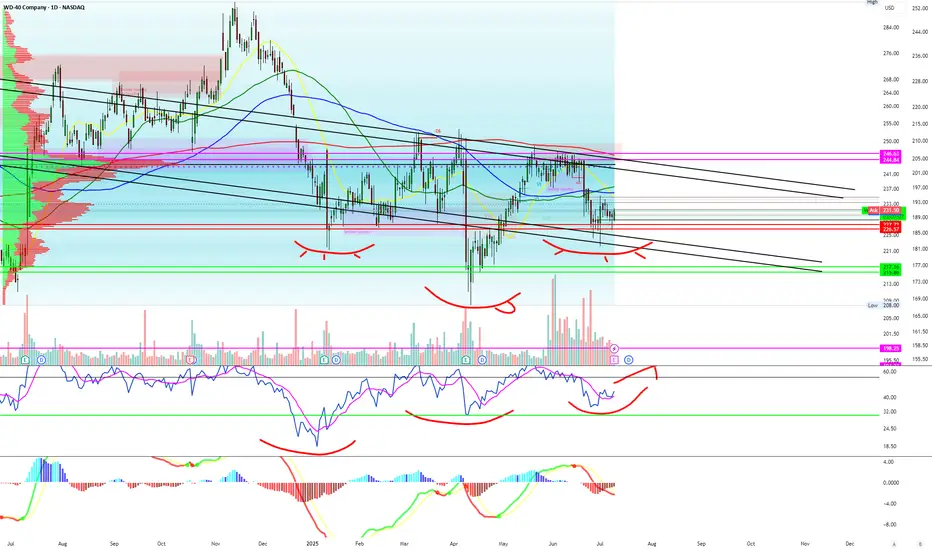
Never thought I'd be bullish WD-40 LMAOAll indicators such as RSI, descending channel pattern and MACD combined with options exposure make me believe earnings will be good in the stock prices eyes.
IWM and small cap stocks are really starting to pop off and nothing is more American then WD-40!!!
Target #1 - $240
Target #2 - $250
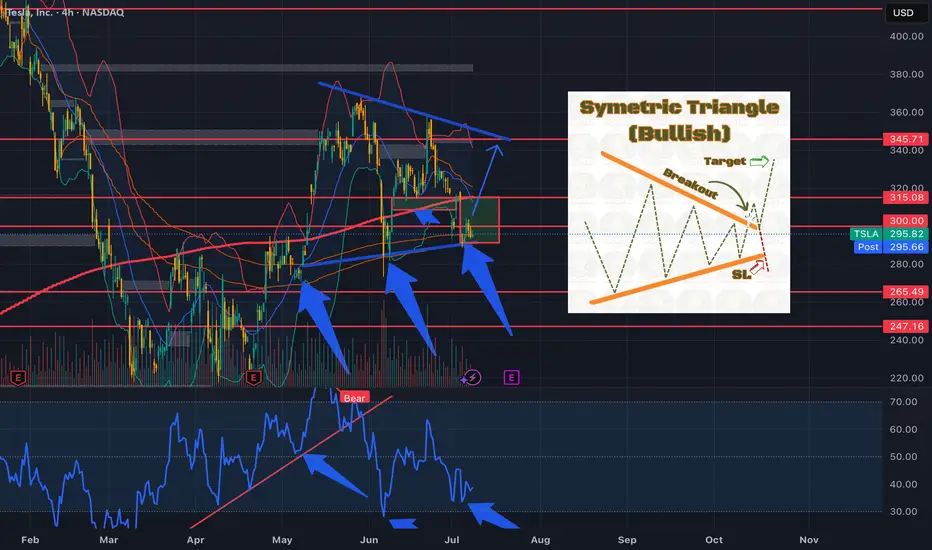
TSLA....Symetric Triangle....Earnings Rally?Could we see the bulls step in and leads us into earnings?
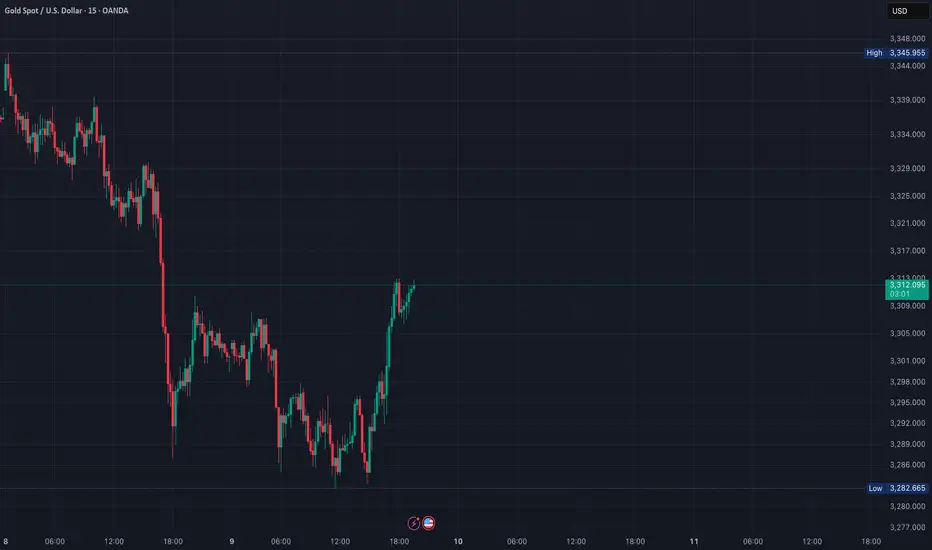
XAUUSD – Watching the 3318 Resistance for Potential Reversal
Currently monitoring Gold (XAUUSD) after a short-term bullish push toward the 3318 resistance zone. This area is significant due to:
Confluence with the upper Bollinger Band
Previous horizontal resistance level
Loss of momentum shown on MACD and other lower timeframes (15m–1h)
Price action is slowing as we approach the overbought territory. If price fails to break above 3318 and prints a clear reversal candlestick (e.g., pin bar or bearish engulfing) on the 1H chart, I’ll be looking for a short setup.
Disclaimer:This analysis reflects my personal view and is shared for educational purposes only. It does not constitute financial advice or a recommendation to enter any trade. Always do your own research and manage your risk accordingly. ⚠️
$MAN to the moon! Monthly RSI hit 30; will hit $65-75 in 60 daysNYSE:MAN has repeatedly gone up in huge ways every single time the monthly RSI has crossed below 30. We have now seen back to back months dipping below and now it’s on its way up already!
Check its history and you’ll see that typically within 2-3 months after it breaks the 30RSI it goes up 50-150% in price within just a few months! Some of those times it doubled in just 2 months.
History repeats itself and I don’t want anyone missing this one! $50 strike calls for September/December will pay handsomely. Short term grab $55 July calls for just .10-.15 each as they have earnings the day prior to the contract expiring—lots of volume on that strike also compared to all other strikes/monthly contracts.
I am going “all in” on this trade and will be buying 500 of the December $50c. I expect to more than double my position by the end of September.

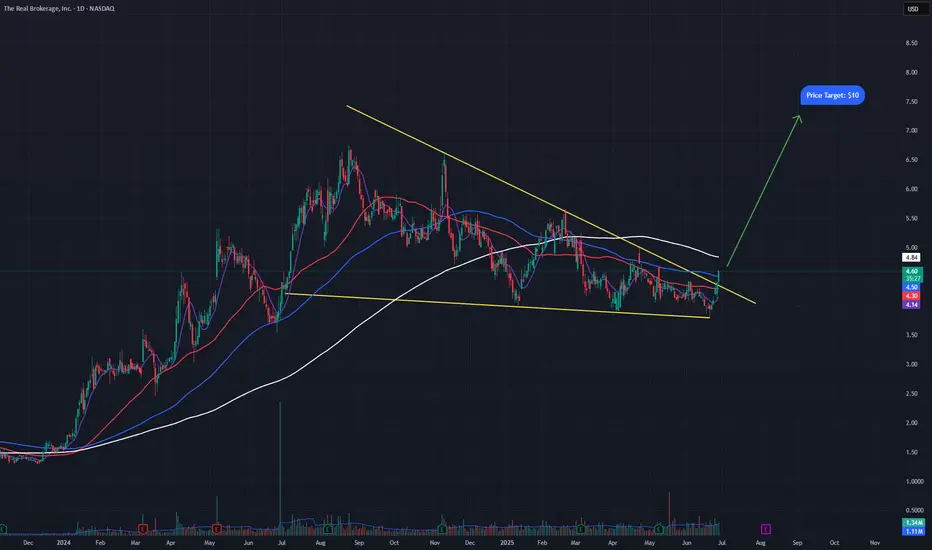
REAX breaking outREAX is a real estage brokerage company that has been in this bullish decending wedge for about a year now. It just broke out yesterday and had a push higher today, confirming the breakout. A measured move of the bull flag puts price targets on this stock around $10 a share, roughly double its current share price. It also sports a Zack's #1 buy rank and is expected to report positive earnings for the first time in company history, when it reports Q2 earnings on August 6th. If this indeed happens, the stock will push much higher, get in early before that happens.

ETH SHORT LIMIT2510–2525 SHORT
TP - 2465 / 2430
SL - 2545
The old pending order is no longer valid, easy to mistakenly touch the high short, resulting in a reverse stop loss

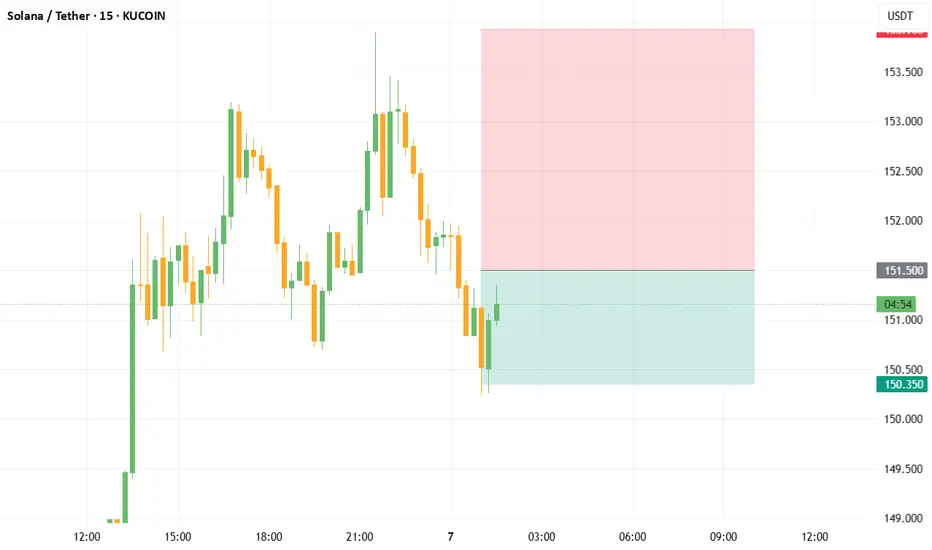
[SOLUSDT scalping short signal]- Signal: SHORT
- Entry: 151.300 ~ 151.500
- Take Profit: 150.820, 150.350
Chasing highs and lows is prohibited, so miss it;
Prohibit stop-loss operation, only to do "controlled static and dynamic resonance zone" within the transaction.
FULL MARGIN TEST ETH✅ 2. ETHUSD (Strong bias rising)
Entry: 2565 Long on retracement
Stop Loss: 2540
Take Profit: 2600
Recommended lot size: 0.20 lot (1:100)

Wait for ETH to rebound to $2528-2542 and place a short order.Short
$2528~$2542
Take Profit
$2480, $2460
Stop Loss
$2555
If the price falls below $2510, do not chase short, wait for a rebound.

BUY LIMIT - XAUUSDBUY LIMIT - XAUUSD @ 3348.00
TP: 3365.00
SL: 3341.00
No backhanding, no carrying orders, no adding to positions

BUY LIMIT - XAUUSDBUY LIMIT - XAUUSD @ 3326.00
TP: 3334.00
SL: 3321.00
Rather earn less, never more losses

Direxion Regional Banks Bull 3X Shares | DPST | Long at $84.89In anticipation of interest rates going lower, a large number of regional bank insiders are buying a significant number of shares of their own stock. Such lowering will likely increase regional bank revenue and move ETFs like AMEX:DPST higher.
Thus, at $84.89, AMEX:DPST is in a personal buy zone.
Targets:
$106.00
$120.00

XAUUSD BUY NOWXAUUSD @ 3343.00
TP: 3353.00
SL: 3338.00
Do not get attached, do not get greedy, do not buck the trend.

XAUUSD No chasing long or early manual entriesBUY LIMIT - XAUUSD @ 3328.00
TP: 3348.00
SL: 3320.00
Do not increase positions, do not carry orders, not backhanded
