ROST Earnings Play: Big Call Setup Ahead of BMO! 🚀 ROST Earnings Play: Big Call Setup Ahead of BMO! (Aug 21, 2025) 🚀
### 🏦 Earnings Outlook
* 📊 **Revenue Growth:** +2.6% TTM – stable retail performance
* ⚖️ **Margins:** Profit 9.8%, Operating 12.2%, Gross 32.8% → strong operational efficiency
* 📈 **Historical Beat Rate:** 100% over last 8 quarters, avg surprise 7.9%
* 🛍️ **Sector:** Apparel Retail – benefiting from value rotation trends
* 🧭 **Analyst Consensus:** Buy (1.7/5.0), forward EPS \$6.69
---
### 🔎 Options Flow Insight
* 📈 **Call Activity:** High call volume at \$150 strike indicates bullish sentiment
* ⚖️ **Put Activity:** Significant open interest at \$144 for institutional hedging
* 🏦 **IV:** Moderate at 0.70, offering favorable earnings options play
---
### 📉 Technical Setup
* 📊 **Current Price:** Trading above 50 & 200-day MAs
* 🔑 **Support:** \$144
* 🔑 **Resistance:** \$160
* 💥 **RSI:** 67.35 → slight overbought, but bullish momentum
---
### 🎯 Trade Setup (Earnings Play)
* 🟢 **Direction:** CALL (Bullish Bias)
* 🎯 **Strike:** \$150.00
* 💵 **Entry Price:** \$2.80
* 📅 **Expiry:** Aug 22, 2025
* 📊 **Size:** 1 contract
* 🕒 **Entry Timing:** Pre-earnings close (BMO)
📌 **Profit Target:** \$8.40 (200-400% potential 🚀)
📌 **Stop Loss:** \$1.40 (50% of premium)
📌 **Exit Rule:** Within 2 hours post-earnings or target hit
---
🔥 Hashtags for Maximum Reach 🔥
\#ROSTEarnings #ROSTOptions #EarningsPlay #RetailStocks #OptionsTrading #BullishCall #DayTrading #SwingTrading #WallStreet
Earningsplay

TGT Earnings Play: Strong Bearish Setup – $100 Put🛒💥 TGT Earnings Alert – $100 Put (Aug 22, 2025) 🚨🔥
Earnings Snapshot
📉 Revenue Momentum: -2.8% TTM ❌
📊 Margins: Profit margin 4.0%, Gross margin 28.1% ⚠️
📈 Forward EPS Growth: 15.5% (aggressive) 💡
💵 Debt-to-Equity: 130.21 ⚖️
🏬 Sector Context: Discretionary retail under pressure, consumers shifting to essentials 🛒
Technical & Market Context
Price: $104.95, above 20-day MA ($103.40) but below 200-day MA ($115.47) ⚖️
RSI: 58.35 → neutral momentum
Volume: 3.8M, below average 📉
Options Flow: Expected bearish put skew 📉
Macro: Inflation & rising costs = headwinds 🚨
💥 Trade Recommendation
🎯 Strategy: Earnings Put
🏦 Instrument: TGT
💵 Strike: $100 Put
🗓️ Expiry: Aug 22, 2025
💰 Entry Price: $1.85
🎯 Profit Target: $5.50 (200%+)
🛑 Stop Loss: $0.92 (50% of premium)
⏰ Entry Timing: Pre-earnings close
📈 Confidence: 90% 🔥
⚠️ Key Risks:
Rapid IV crush post-earnings ⏳
Unexpected upside surprise 🚀
High leverage; manage sizing carefully ⚖️
Multiple Exit Scenarios
Profit Target Hit: Exit at $5.50 💰
Stop Loss: Exit at $0.92 ❌
Time-Based: Close within 90 mins post-earnings ⏱️
Trade JSON
{
"instrument": "TGT",
"direction": "put",
"strike": 100.0,
"expiry": "2025-08-22",
"confidence": 90,
"profit_target": 5.50,
"stop_loss": 0.92,
"size": 1,
"entry_price": 1.85,
"entry_timing": "pre_earnings_close",
"earnings_date": "2025-08-21",
"earnings_time": "BMO",
"expected_move": 5.0,
"iv_rank": 0.85,
"signal_publish_time": "2025-08-19 15:20:01 UTC-04:00"
}
📊 Quick Trade Recap:
🎯 PUT $100 | 💵 $1.85 → 🎯 $5.50 | 🛑 $0.92 | 📅 Aug 22 | 📈 90% Confidence
⏰ Entry: Pre-Earnings Close | 📆 Earnings: Aug 21 BMO | 📊 Expected Move: 5%

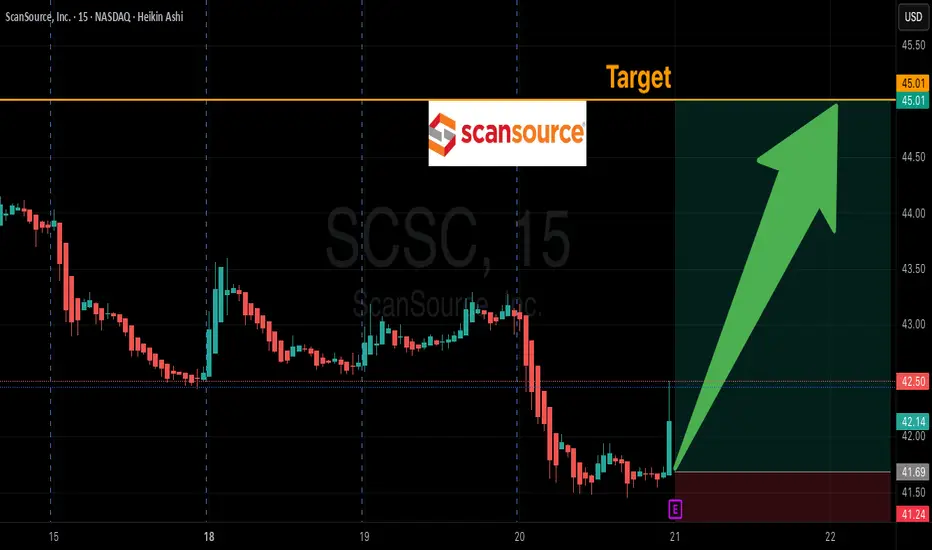
SCSC Earnings Gamble: $45C--Pre-Earnings Lotto Play?
# 🚨 SCSC Earnings Gamble: \$45C 🎯 Pre-Earnings Lotto Play? 📈💰
### 📊 Earnings Prediction Breakdown (2025-08-20)
**Company:** ScanSource, Inc. (SCSC)
#### 🔎 Fundamentals
* 📉 Revenue growth: **-6.3%** (big challenge)
* 💸 Margins: Thin (Profit 2.3%, Operating 3.3%, Gross 13.5%)
* ⚠️ Beat rate: Only **38%** with negative surprise history (-6.1%)
* 🧾 Forward EPS est.: \$3.74 (+34.5% growth expected — may be too optimistic)
**👉 Score:** 5/10 (Weak fundamentals, a few bullish sparks)
---
#### 🏦 Options Flow
* ⚡️ IV: Normal, no big expansion
* 📉 Liquidity: Low (79 calls vs 3 puts OI 😬)
* 🛡️ Skew: Slightly bearish (more puts for hedging)
* 🐢 No dark pool or big whale activity
**👉 Score:** 4/10 (Retail-heavy, no big-money conviction)
---
#### 📈 Technicals
* 💵 Price: \$43.06 (hovering above MA)
* 📊 RSI: Neutral → leaning overbought
* 🔑 Levels: Support \$41.36, Resistance \$45.00
* 📉 Volume: Weak (0.72x avg)
**👉 Score:** 5/10 (Neutral momentum, low volume support)
---
#### 🌎 Macro Context
* 🚚 Supply chain headwinds remain
* 📦 Tech distribution sector under pressure
* 📉 Micro-cap vulnerability → tough environment
**👉 Score:** 5/10 (Neutral sector, not much tailwind)
---
### 🎯 Directional Conviction: **53% Neutral / Speculative Bias**
---
## ⚡️ TRADE IDEA (Speculative Only) ⚡️
🎯 **\$45 Call @ \$1.25 (Sept 19 expiry)**
* 🛑 Stop Loss: \$0.62 (50%)
* 🎯 Target: \$2.50–\$5.00 (200–400% lotto)
* 📆 Entry: Pre-earnings close
* ⏰ Exit: Within 2 hrs post-earnings
---
📊 **Quick Recap Card:**
* 🎯 Instrument: **SCSC**
* 🔀 Direction: **CALL (LONG)**
* 🎯 Strike: **45.00**
* 💵 Entry: **1.25**
* 🛑 Stop: **0.62**
* 📅 Expiry: **2025-09-19**
* 📈 Confidence: **53%**
* ⚠️ Risk: Low liquidity, speculative lotto
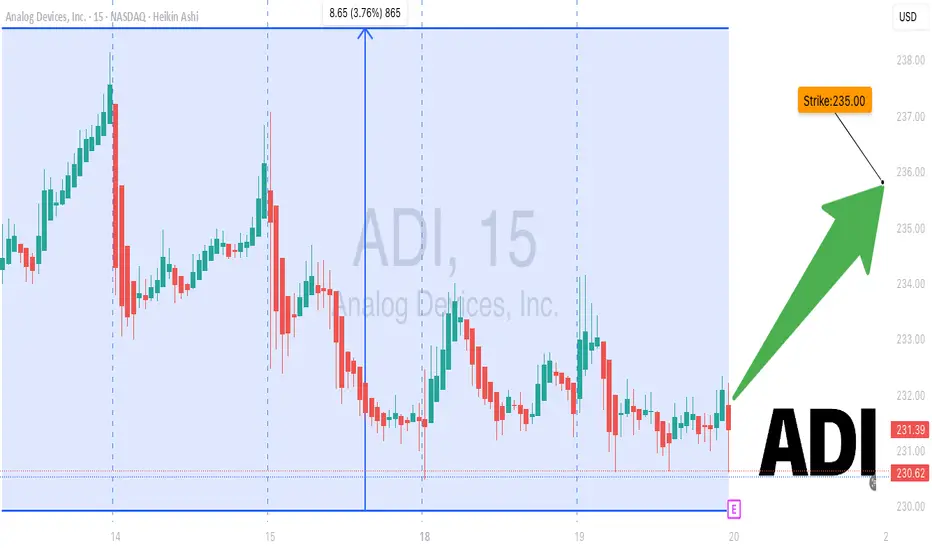
ADI Earnings Options: Long $235 Call⚡💎 ADI Earnings Alert – $235 Call (Aug 23, 2025) 🚀🔥
Earnings Snapshot
📊 Revenue Momentum: +22.3% TTM ✅
💵 Revenue per Share: $19.79
📈 Profit Margin: 18.7%, Operating Margin 25.7%, Gross Margin 58.8% 💎
🏦 Forward EPS: $7.54, Avg Target Price $254.16 📈
💡 Sector Context: Semiconductors benefiting from automotive & industrial recovery 🚗🏭
Technical & Market Context
Price: $231.55, near 50-day MA ($233.25) ⚖️
RSI: 50.37 → neutral
Volume: 2.12M, below 10-day & 3-month averages 📉
Key Levels: Support $227.83, Resistance $234.22
Macro: Low VIX (14.84) supports growth/low-volatility environment 🌈
💥 Trade Recommendation
🎯 Strategy: Long Call
🏦 Instrument: ADI
💵 Strike: $235 Call
🗓️ Expiry: Aug 23, 2025
💰 Entry Price: $5.50
🎯 Profit Target: $22.50 (200–300%+) 💎
🛑 Stop Loss: $2.75 (50% of premium) ❌
⏰ Entry Timing: Pre-earnings close
📈 Confidence: 75%
⚠️ Key Risks:
Absent detailed options flow 📊
Pre-earnings technical neutrality ⚖️
Potential premium spike → IV crush post-announcement ⏳
Trade JSON
{
"instrument": "ADI",
"direction": "call",
"strike": 235.0,
"expiry": "2025-08-23",
"confidence": 75,
"profit_target": 22.50,
"stop_loss": 2.75,
"size": 1,
"entry_price": 5.50,
"entry_timing": "pre_earnings_close",
"earnings_date": "2025-08-22",
"earnings_time": "AMC",
"expected_move": 5.0,
"iv_rank": 0.75,
"signal_publish_time": "2025-08-19 14:52:26 UTC-04:00"
}
📊 Quick Trade Recap:
🎯 CALL $235 | 💵 $5.50 → 🎯 $22.50 | 🛑 $2.75 | 📅 Aug 23 | 📈 75% Confidence
⏰ Entry: Pre-Earnings Close | 📆 Earnings: Aug 22 AMC | 📊 Expected Move: 5%
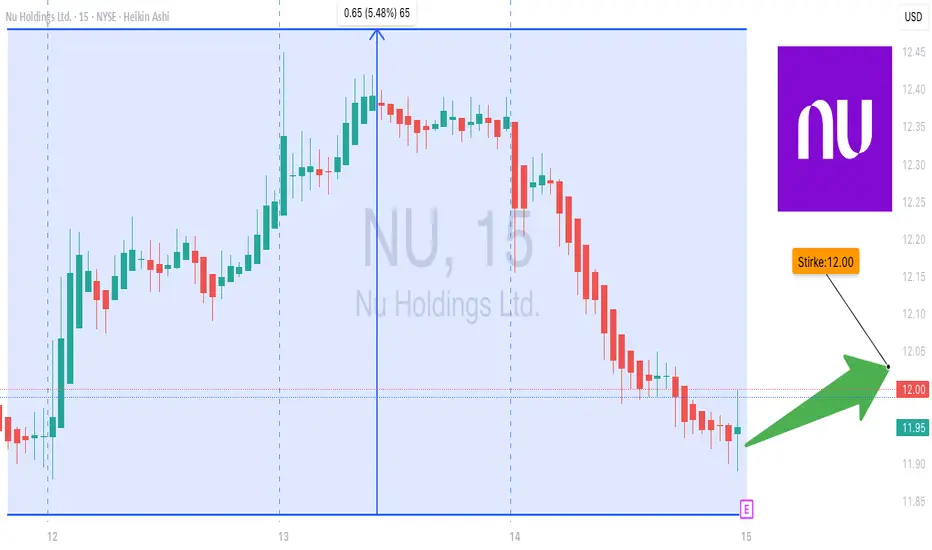
NU $12 Call – Earnings Play Incoming!
## 🚀 NU \$12 Call – Earnings Play Incoming!
**Sentiment:** 🟢 *Moderate Bullish (75% Confidence)*
* **TTM Revenue Growth:** 10.6% 📈
* **Operating Margin:** 57.7% 💰
* **RSI:** 34.3 (Oversold, potential reversal)
* **Options Flow:** Strong call interest at \$12.00/\$12.50 strikes
* **Macro:** Fintech sector bullish, emerging markets favorable
* **Gamma & Volatility:** Low IV (VIX 14.84), high potential post-earnings
---
### 📊 **Trade Snapshot**
* **Type:** CALL (Long)
* **Strike:** \$12.00
* **Expiry:** 2025-08-15
* **Entry Premium:** \$0.45
* **Profit Target:** \$1.35 (+200-300% potential)
* **Stop Loss:** \$0.23 (50% risk)
* **Size:** 1 contract
* **Entry Timing:** Pre-earnings close
* **Expected Move:** 5%
---
### 💡 **Strategy Notes**
* High-conviction earnings play, but monitor time decay and post-earnings volatility.
* Exit options:
* **Profit Target:** \$1.35
* **Stop Loss:** \$0.23
* **Time-Based:** Exit if no move within 2 hours post-earnings
---
📌 *Strong fundamentals + institutional support + oversold technicals = optimal pre-earnings call setup.*
**#NU #EarningsPlay #OptionsTrading #CallOptions #FintechStocks #HighConviction #TradingSignals #AMC**
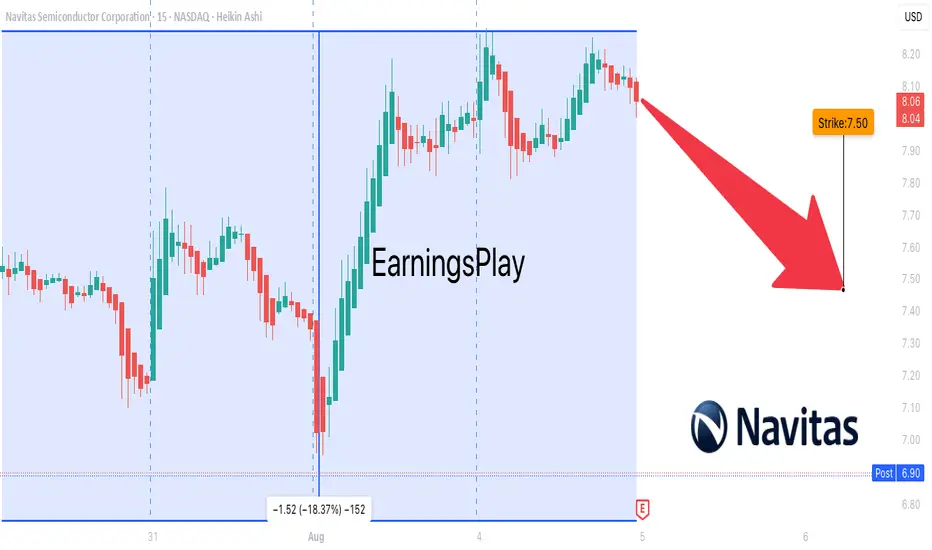
NVTS Earnings Breakdown
## 🔻 NVTS Earnings Breakdown: 🚨 -131% Margin, Bearish Setup into AMC Report!
**📆 Earnings Date:** August 8, 2025 (After Market Close)
**📉 Sentiment:** **Bearish Bias – 80% Conviction**
**🎯 Trade Idea:** \$7.50 Puts | Entry: \$0.35 | Target: \$1.05
---
### 🧨 Why This Matters:
* 📉 **Revenue YoY:** –39.5%
* 🔻 **Profit Margin:** –131.8%
* 💣 **Operating Margin:** –170%
* 📊 **RSI:** 67.1 — Near Overbought
* ⚠️ **Pre-Earnings Drift:** Price stalling under \$8.50
* 📉 **Volume:** Below 10-day avg — weak buyer support
---
### 📈 Options Flow Signals:
* 🐻 High Put Flow @ \$7.50
* 🧨 IV Rank: 85% — big move priced in
* 📉 Bearish Gamma setup + skewed flow
* 🧠 Institutions hedging downside risk
---
### ⚙️ Trade Setup:
* ✅ **Action:** Buy NVTS \$7.50 Puts
* 💵 **Entry Price:** \$0.35
* 🎯 **Profit Target:** \$1.05 (+200%)
* 🛑 **Stop Loss:** \$0.17
* 📅 **Expiry:** August 8, 2025
* ⏰ **Entry Timing:** Before earnings close
* 🔎 **Expected Move:** \~5%
---
### 🚨 Key Chart Levels:
* 🔹 **Support:** \$7.50
* 🔺 **Resistance:** \$8.50
* ⚠️ **Watch for breakdown** on weak guide / EPS miss
---
### 📌 Tags:
```
#NVTS #EarningsPlay #BearishSetup #OptionsFlow #PutOptions
#Semiconductors #TechStocks #HighIV #GammaSqueeze #TradingView
#SwingTrade #UnusualOptionsActivity #AIStocks #MarketVolatility
```
---
💬 **Hot Take:** NVTS’s earnings are the kind that crash charts. Revenue down, margins worse, and put flows piling up. Will you ride the flush?
RXRX Collapse or Comeback? Watch This Zone
### 🧬 RXRX Options Flow Exploding Ahead of Earnings — \$6 Call Setup Heating Up! 🚀
📅 **Week of August 4, 2025**
📈 **Sentiment:** Moderately **Bullish** (Call/Put Ratio: **8.73**)
💡 **Trade Setup:**
* 🎯 **Buy RXRX \$6.00 Call (08/08 Expiry)**
* 💵 **Entry:** \$0.30
* 🎯 **Profit Target:** \$0.60 (100% return)
* 🛑 **Stop Loss:** \$0.15
* ⚠️ **Confidence:** 65% (Earnings on 08/08 = Binary Risk)
🧠 **Why It’s Viral-Worthy:**
* 🔥 **Insane Call Activity** despite weak volume — institutions positioning early?
* 📉 **Daily RSI:** 48.1 (falling)
* 📈 **Weekly RSI:** 48.7 (rising)
* 📊 **Volume:** Weak (0.6x previous week)
* 🧨 **Gamma Risk:** Moderate with 4DTE
---
### 📌 Strategy Summary:
> **"Big options flow with weak volume is like a loaded spring—wait for the pop or drop."**
> Watch for a clean break over \$6.00 on volume at open. Use tight risk control. 🚦
---
### 🔖 Tags for Reach:
```
#RXRX #OptionsFlow #UnusualOptionsActivity #BiotechStocks
#TradingView #CallOptions #SwingTrade #GammaSqueeze
#EarningsPlay #MomentumTrade #HighRiskHighReward
```
---
💬 *What’s your take? Will RXRX run before earnings or stall on weak volume?*
📊 Drop your chart in the comments ⬇️

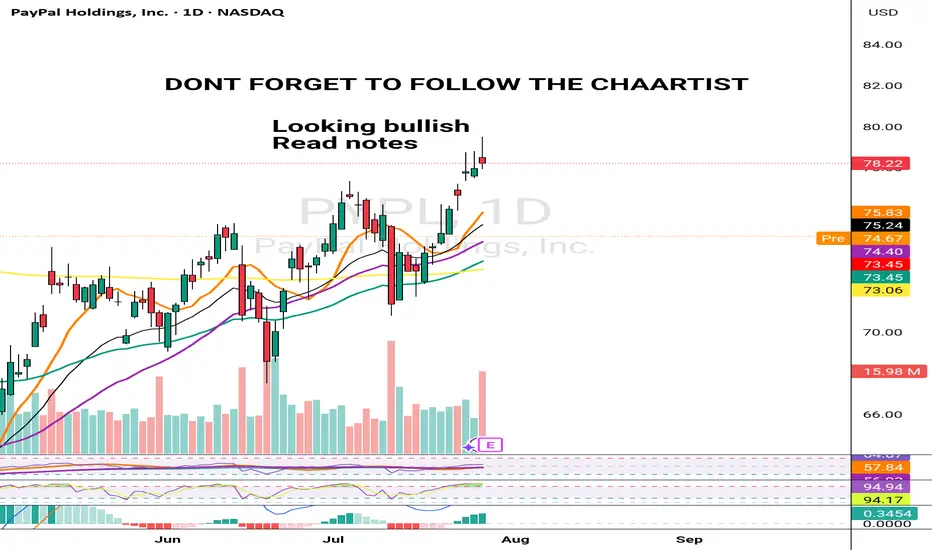
PYPL LOOKING BULLISH JULY 29 2025Pypl is lloking good to go long. Whenever I trade at current price rule is clear that you manage your risk and quantities properly. Dont blindly trade in a hope to make quick money. Pypl looking good to go to $85 soon
HCA EARNINGS TRADE (07/24)
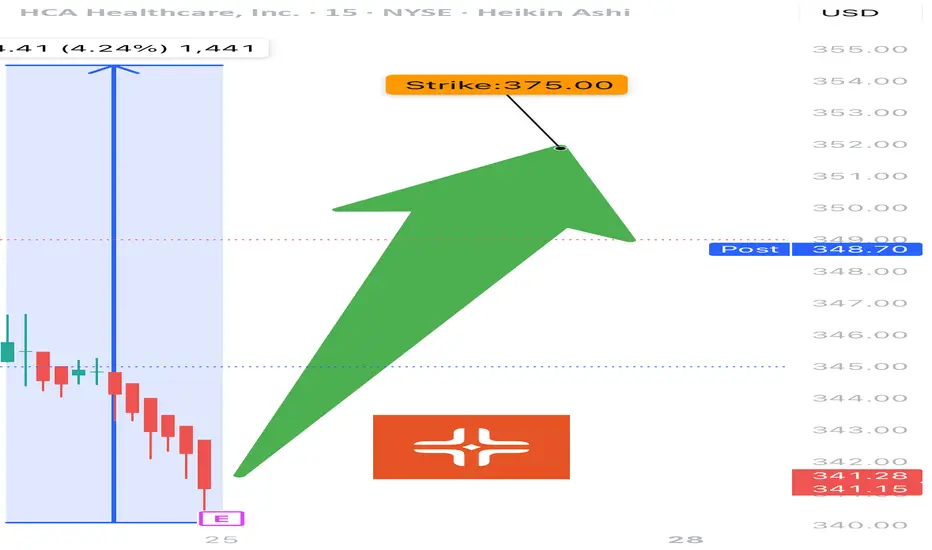
🚨 HCA EARNINGS TRADE (07/24) 🚨
🏥 Healthcare with earnings tonight after close — high-upside setup brewing.
🧠 Quick Breakdown:
• 📊 Revenue Growth: +5.7% (stable, defensive sector)
• 💸 Margins: Operating 15.6%, EBITDA 19.9% = efficient and strong
• 🧠 Beat Rate: 75% with 6.7% avg surprise → credible upside
• 📉 RSI: 22.5 → OVERSOLD and primed for bounce
• 💬 Whisper sentiment strong from sector peers (e.g., Tenet)
• 🔥 Analysts target: $391.54 → 13.8% upside
💥 TRADE SETUP
🟢 Buy HCA $375 Call exp 8/15
💰 Entry: $3.90
🎯 Target: $11.70 (200–300%)
🛑 Stop: $1.95
📈 Confidence: 73%
⏰ Entry: Before Close Today (Pre-Earnings)
📆 Earnings: Today After Market (AMC)
📊 IV Rank: 0.60 → fair pricing
📉 Expected Move: ~5%
⚠️ RSI this low + sector strength = earnings bounce candidate. Watch the $375 breakout zone. 🎯
#HCA #EarningsPlay #OptionsTrading #HealthcareStocks #UnusualOptionsActivity #CallOptions #TradingView #DayTrading #OversoldBounce #EarningsSeason
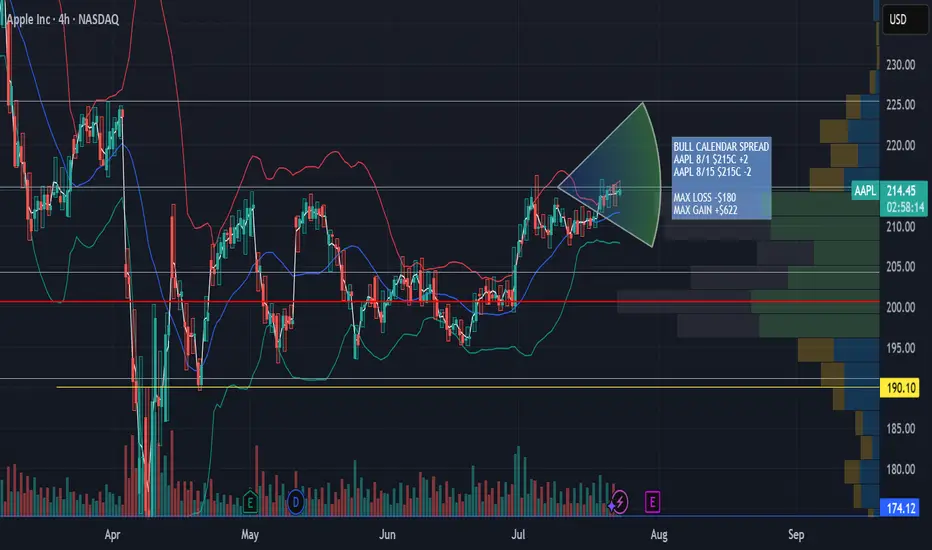
AAPL Aug 1st - Aug 8th 215 Calendar Call SpreadAAPL Aug 1st - Aug 8th 215 Calendar Call Spread
AAPL earnings after market close 7/31/25. Looking for an upward move into earnings with resistance at $225 then retesting support at $215. This zone falls between the .5 and .618 fib retracement. Great risk/ reward ratio 3.5:1
TESLA POST EARNING 24 JULY 2025This is Post earning analysis for Tesla . I have clearly explained all the levels. Please trade carefully & try to stick to your plan.
NOTE: FOLLOW THE LEVELS

AAPL LIVE PRICE ACTION JULY 23 2025This is the price action for AAPL. I have discussed indicators as well. Do not blindly trade without understanding the logics. I am long here with stocks only.
NOTE: DO NOT BLINDLY BUY

ALK LOOKING BULLISH 22 JULY 2025ALK is looking good to go long at current price. I am going long as it looks very good. If you dont understand a trade then don't push yourself.
NOTE: LONG WITH STOCKS ONLY

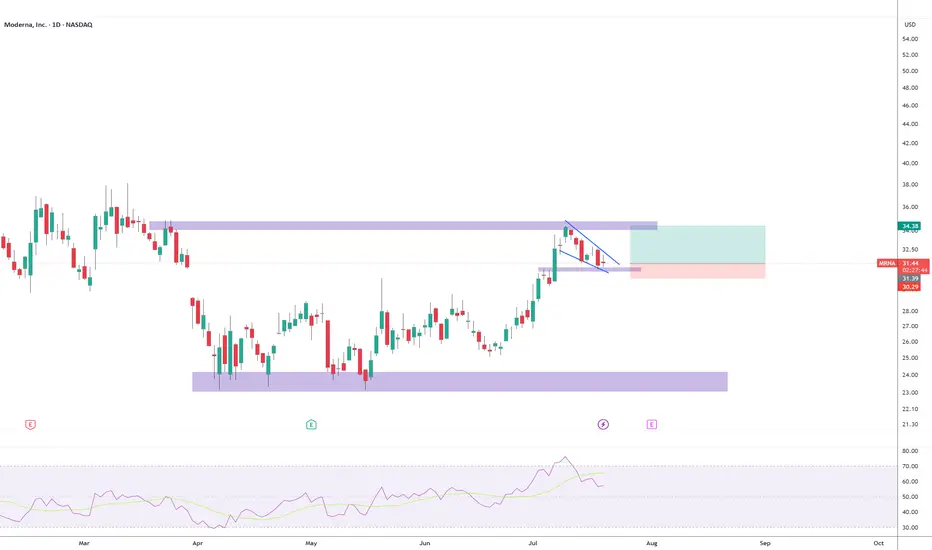
Retest comingBullish flag forming to test the ~$35 resistance again. Earnings coming up on 08/01. I expect the flag breakout before earnings. I have calls exp 08/01 strike 31.5. SL triggers if a daily candle breaks down the support area and closes below 30.30.
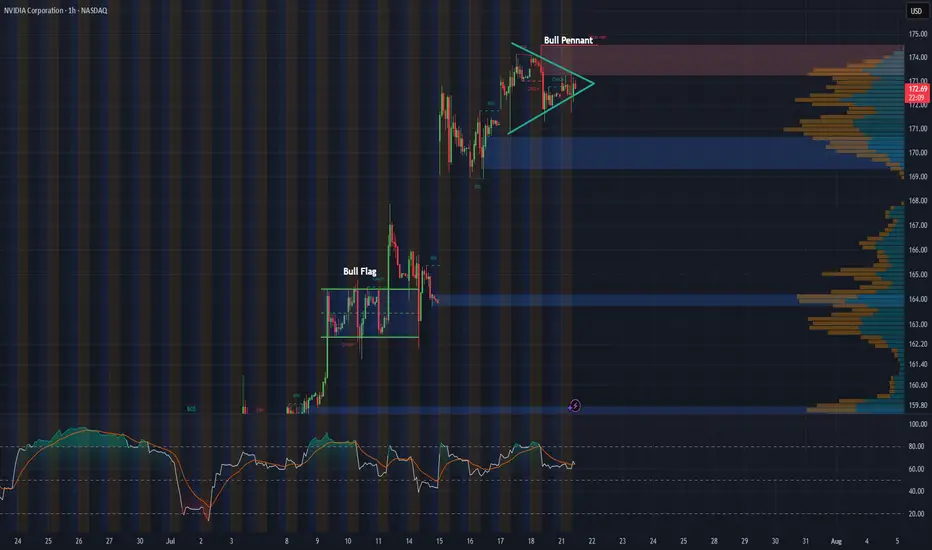
NVDA 1-Hour Chart UpdateHey everyone, just wanted to share a quick update on NVDA’s 1-hour chart. Following last week’s bull flag breakout, the stock appears to be consolidating into what looks like a solid bull pennant formation.
With major tech earnings on the horizon and the recent approval to sell H20 chips to China, this pattern could be setting the stage for another breakout. Will NVDA continue its impressive rally, or is this just a breather before the next move?
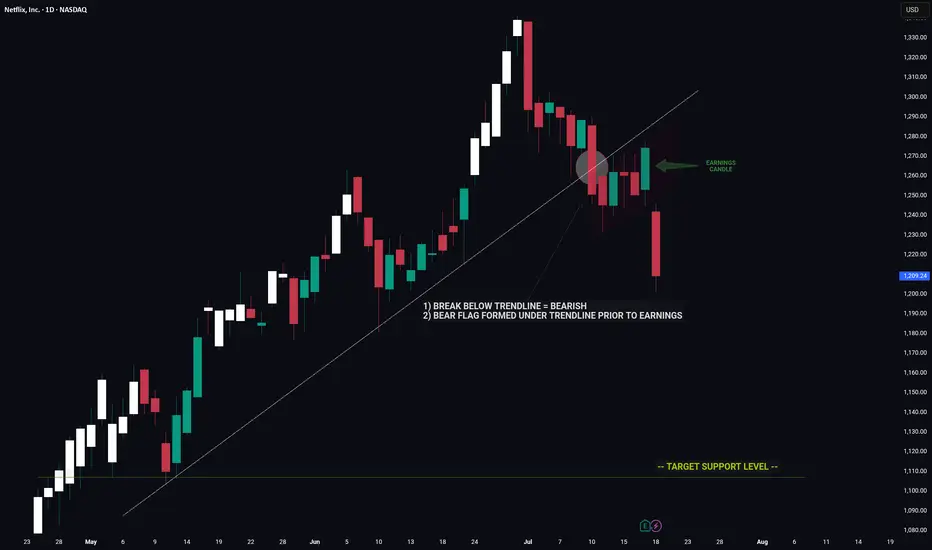
NETFLIX -- Price Signaled A Move Lower Prior To EarningsHello Traders!
The chart of NFLX is a great example of using clues to decipher a future move.
Prior to earnings we had major bearish indicators on the chart that hinted towards a move down on earnings.
1) Break below major trendline
2) Bear flag
These two signals by themselves are very bearish however the fact that these signals appeared coming into earnings was an even strong indicator of a potential for negative move.
Now that the upward trend is broken NFLX has a long way to fall before reaching the next key support level.
Thanks everyone and best of luck on your trading journey!
How We’ll Trade Earnings This Season Earnings season is almost here — and if you're with QS, you’re already holding the most powerful edge in the market.
Let me walk you through how QS trades earnings, why we built 💸earning-signal, and how you can use it most effectively this quarter.
---
📜 A Little History: The Birth of 💸earning-signal
When QS launched in early April, we started with just two short-term signals:
⏰0dte
📅weekly-options
Both focused on short-term options trades.
Then came TSLA earnings in late April. That’s when we launched our very first 💸earning-signal — and nailed the prediction.
Since then?
We’ve had one of the best earnings win streaks on the internet. Period.
📌 Don’t take my word for it — check:
#✅signal-recap for the track record
#🤑profits and #🤩member-testimonials for real wins from members
---
🤖 Why We Built a Separate Earnings Signal
Earnings are not regular trading days. The dynamics are completely different.
On normal days, a stock might move <1%
On earnings? 10–20% swings are common
This is what we call a “pivot event” — and it requires a different engine to predict.
That’s why we separated:
📅 #weekly-options → normal day-to-day setups
💸 #earning-signal → high-volatility earnings plays
---
🧠 How a Human Would Trade Earnings...
If you wanted to manually trade an earnings report, you’d need to analyze:
Past earnings reactions
Analyst expectations
Earnings call language
Financial statement surprises
Options IV & skew
Post-earnings stock behavior
This would take hours (or days) — and most retail traders don’t have time.
---
⚙️ How QS AI Does It Instead
We built 💸earning-signal to do all that work for you — and more.
✅ It pulls in all the data above
✅ Runs it through 5 top LLM models (each acts as an independent analyst)
✅ Aggregates their insights + calculates probability-weighted direction & strategy
✅ Uses fine-tuning to learn from its past prediction success/failures
This means: faster decisions, deeper insights, and better accuracy — every week.
We don’t just run predictions. We let the AI learn from past mistakes and self-improve each quarter.
---
💥 Results Speak for Themselves
Last season, we nailed:
TSLA
MSFT (10x–20x winners!)
NVDA
AAPL
And many more...
All based on this unique AI-driven earnings analysis stack.
This season?
We’re going harder, faster, and even smarter. 📈
🎯 The goal is clear:
Make 💸earning-signal the #1 earnings prediction system in the world.
---
🧩 Final Notes
Earnings are 10x harder to trade than regular days
But with QS, you’re equipped with 500x the speed and insight of an average trader
Upgrade if you haven’t yet: #💰upgrade-instructions
Earnings season kicks off next week
Let’s get it.
Let’s win big.
Let’s make season 2 of 💸earning-signal our most legendary yet. 🚀💸

Hims is OVERBOUGHT Market Context ✨
NYSE:HIMS | Current Price: $42.00
1-Month Move: +17.5% (from $35.75)
1-Year Move: +68.2% (from $25.00)
Year High/Low: $43.50/$24.80
Technicals
RSI: ~75.8 (overbought )
Moving Averages: Above 20-day, 50-day, and 200-day MAs (strong uptrend, but overextended )
MACD: Bearish divergence forming (momentum fading, potential reversal )
Trade Setup
Direction: PUT
Entry Price: $42.00
Take Profit 1 (TP1): $36.00 (~14.3% gain )
Take Profit 2 (TP2): $30.00 (~28.6% gain )
Expected Move: ~12–15% downward
Best AI Signals on the market

AMD Earnings About To PrintTechnical Analysis NASDAQ:AMD
RSI: 🟡 Near overbought but showing strength
MACD: 🟢 Bullish crossover in progress
Support: $96.84 → $93.64 → $90.00
Resistance: $100.75 → $101.72 → $103.96
Key Level to Watch: $100.75 (immediate resistance)
💰 Earnings Play
🎯 Trade Signal: BUY
✅ Justification
Recent uptrend confirmed by bullish MACD crossover with price action above key short-term MAs. Strong momentum heading into earnings with positive sentiment from analysts.
⚠️ Risk Management
Stop Loss: $93.64 (-5.2%)
Expected Range: $93.64 to $103.96
Best AI Generated Signals.
Stay Alpha

AMD BULLISH MAY6TH 2025AMD has its earnings today & I am bullish as per the price action. I have managed my risk, and I am long irrespective of any news. I have discussed in depth analysis of AMD. If you have any questions, feel free to leave a comment below.
NOTE: I AM LONG ONLY WITH STOCKS

IBM Earnings PlayTechnical Analysis NYSE:IBM
On the 4-hour chart, IBM’s stock price is currently trading at approximately $260.50. Applying Bollinger Bands, the price is hovering near the 20-period moving average, with the bands moderately contracted, indicating relatively low volatility. The stock has shown resilience above the lower Bollinger Band, suggesting potential for an upward move if bullish momentum builds post-earnings. A recent green candle indicates buying interest, but the stock remains below the upper band, which sits near $270.00, signaling room for upside if catalysts align.
Target
Wait for bullish confirmation post-earnings.
Entry LONG : Around $262.00, Targeting $270.00.
Secondary Target: $275.00.
Resistance Levels: $265.00, $270.00, $275.00.
Support Levels: $255.00, $250.00, $245.00.
The price is testing the 20-period moving average, and a strong earnings report—particularly with positive AI or cloud revenue updates—could push the stock toward the upper Bollinger Band at $270.00 or higher. Conversely, a disappointing earnings report or weak guidance could see the price drop toward $255.00 or lower, especially if broader market conditions weaken.
QuantSignals
Best AI news analysis and signals

BOEING EARNINGS ABOUT TO PRINT Fundamental Outlook NYSE:BA
Boeing is heading into its Q1 2025 earnings with notable challenges. Ongoing quality-control issues, supply chain disruptions, and a reported negative profit margin are creating headwinds. Additionally, recent negative publicity surrounding production delays and regulatory scrutiny may further dampen investor sentiment. While potential defense contract wins or positive updates on 737 MAX production could provide a lift, the risk of a disappointing earnings report remains high, especially in a volatile aerospace sector.
Technical Analysis (Using Bollinger Bands Strategy)
On the 4-hour chart, Boeing’s stock price is currently trading at $175.46, as seen in the provided chart. Applying Bollinger Bands, the price has recently broken below the lower band, signaling a potential oversold condition but also confirming a strong bearish momentum. The price has been trending below the 20-period moving average within the bands, with the bands widening—a sign of increased volatility. This setup suggests a continuation of the downward move, especially with the recent sharp decline highlighted by the red arrow in the chart.
Target
Wait for bearish confirmation
Entry SHORT: Around $165.50, Targeting $152.00.
Secondary Target: $146.00.
Resistance Levels: $180.00, $185.00, $188.60.
Support Levels: $165.00, $155.00, $148.00.
The price is struggling to reclaim the 20-period moving average, and with earnings approaching, a breakdown below $170.00 could accelerate the decline toward $165.00 or lower. However, a positive earnings surprise—such as strong delivery numbers or improved guidance—could push the price back toward the upper Bollinger Band near $185.00.
QuantSignals.
Best AI news analysis and signals

TESLA 22 APRIL 2025This is my analysis for Tesla irrespective of its earnings. If yoiu have any doubts feel free to leave a txt.
I am long with proper RR & risk management
