GBP/AUD Forecast: Strategic Divergence & Market ShiftsStrategic Outlook: The Sterling Breakout
The Pound Sterling (GBP) has established a dominant position against the Australian Dollar (AUD) as 2025 closes. This shift represents a fundamental divergence in national economic strategies, not merely market fluctuation. The Bank of England (BoE) executed a "hawkish cut" to 3.75% in December, signaling long-term stability. In contrast, the Reserve Bank of Australia (RBA) remains paralyzed at 3.60% due to persistent inflation. This analysis dissects the geopolitical, technological, and industrial forces driving this volatility.
Macroeconomics: The Central Bank Divergence
The core driver of the GBP/AUD rally lies in contrasting monetary policies. The BoE managed a delicate pivot in December. By cutting rates while warning of inflation, they maintained yield appeal. Markets interpreted this decisiveness as strength, bolstering the Pound. Conversely, the RBA faces a credibility crisis. Australian CPI remains stubbornly high at 3.8%. Yet, the RBA held rates steady, fearing a mortgage cliff. This hesitation signals weakness. The "yield advantage" now firmly favors London over Sydney.
Geopolitics & Geostrategy: Risk Aversion Protocols
Global instability disproportionately harms the Australian Dollar. As a "risk-proxy" currency, the AUD suffers when tensions rise in the Indo-Pacific or Eastern Europe. Investors flee to safe havens or deeper liquidity pools like the GBP. Furthermore, the UK-Australia Free Trade Agreement has matured. While removing tariffs, it exposed Australia’s reliance on raw commodity exports. The UK’s pivot to high-value service exports insulates it better from supply chain disruptions. This structural imbalance currently weighs heavily on the Aussie.
Industry Trends: Services vs. Commodities
The UK economy is evolving faster than its Australian counterpart. Recent data indicates UK Intellectual Property (IP) investment surged by 15%. Britain is successfully transitioning to a high-value "intangible economy." Australia remains tethered to the "rocks and crops" model. While critical minerals are vital, global demand for lithium and iron ore has softened. This cyclical downturn in commodities drags the AUD down. The UK’s service-based resilience offers a more stable platform for currency appreciation.
Technology & Cyber: The Digital Trade Surplus
A hidden driver of Sterling's strength is the UK's dominance in digital services. Britain’s tech sector is leveraging AI to boost productivity. This export of digital solutions creates a "capital account surplus" that supports the GBP. In contrast, Australia faces a "cyber-sovereignty" challenge. As it digitizes mining operations, cybersecurity costs are rising. This increases operational overheads for major Australian firms. Consequently, foreign capital flows are hesitant, preferring the mature tech ecosystem of the UK.
Patent Analysis: The Innovation Gap
Patent filings reveal the future trajectory of these economies. UK firms are filing aggressively in fintech and biotech. This signals future revenue streams protected by global law. Australian innovation remains heavily concentrated in mining technology. While valuable, it is sector-specific. The lack of economic diversity in Australian patent data suggests a rigid business model. Investors prefer the diversified innovation portfolio of the UK, adding a premium to the Pound.
Leadership & Governance: Corporate Resilience
UK corporate leadership has adapted well to the "higher-for-longer" rate environment. FTSE 100 companies have successfully deleveraged balance sheets. This financial prudence attracts institutional investors. Australian management teams face different pressures. The heavy reliance on variable-rate borrowing in Australia squeezes cash flow. Business confidence in Sydney has dipped as leaders brace for potential rate hikes in 2026. This pessimistic corporate sentiment bleeds directly into the currency valuation.
Forecast: The Path to 2026
The immediate outlook for GBP/AUD remains bullish. The pair is likely to test new highs as liquidity thins over the holiday period. Traders should watch for signals of a pause in BoE cuts and critical Q4 inflation data from the RBA. The structural advantages of the UK economy currently outweigh the commodity potential of Australia. Position for continued GBP strength into Q1 2026.
Economy

USD/JPY: The Carry Trade's High-Tech EvolutionThe Japanese yen is capitulating, trading near historic lows against major crosses despite the Bank of Japan’s (BOJ) historic pivot. With the USD/JPY pair hovering near 157.40 and threatening a breakout above 158.00, the market has delivered a decisive verdict: policy normalization in Japan is too slow to counter the magnetic pull of U.S. capital markets. This divergence is no longer just about interest rate spreads; it is driven by a structural shift in global capital flows, heavily influenced by artificial intelligence (AI) and geopolitical realignment.
Macroeconomics: The Yield Curve Trap
The BOJ’s decision to raise the policy rate to 0.75%—a three-decade peak—failed to anchor the currency. While the 10-year JGB yield surged past 2% for the first time since 1999, the yen collapsed. This creates a dangerous "yield curve trap" where rising domestic borrowing costs punish local balance sheets without generating enough yield to attract foreign capital.
Governor Kazuo Ueda’s adherence to "data-dependent" rhetoric rather than explicit forward guidance has effectively neutralized the market’s fear of tightening. Traders now view the BOJ as reactive, not proactive. Until the central bank signals a terminal rate that rivals Western peers, the carry trade remains profitable, funded by cheap yen to buy high-yielding dollar assets.
Industry Trends: The AI Capital Drain
A new driver, the "AI Trade," has exacerbated the yen's weakness. Japanese institutional and retail investors are aggressively selling yen to purchase U.S. technology stocks. The logic is simple: while Japan manufactures excellent semiconductor materials, the massive value capture in AI software and data center infrastructure occurs in American equity markets.
This structural outflow differs from traditional carry trades. It is not just about seeking higher bond yields; it is a chase for equity growth that the Tokyo Stock Exchange currently cannot match. As long as U.S. tech giants dominate the generative AI landscape, capital flight from Tokyo to Silicon Valley will pressure the yen.
Geopolitics and Geostrategy
Japan’s geopolitical position actively undermines its currency defense. As a critical node in the U.S.-led "Chip 4" alliance, Japan has committed to reshoring semiconductor supply chains to insulate against Chinese aggression. However, this reindustrialization requires massive imports of energy and raw materials, priced in dollars.
Consequently, Japan runs a persistent trade deficit in the very commodities needed to rebuild its defense and industrial base. This "security premium" forces continuous yen selling to fund national security objectives, neutralizing the impact of Ministry of Finance intervention threats.
Cyber and Technology: The Digital Deficit
The financial sector faces a new "digital deficit." Corporate risk assessments for 2025 identify cyber attacks as a primary threat. Japanese financial institutions are ramping up spending on U.S.-made cybersecurity infrastructure to comply with new active cyberdefense laws. This necessity drives further yen selling to pay for American software licenses and cloud security services.
Furthermore, the delay in a fully realized "Digital Yen" (CBDC) has left Japan reliant on existing SWIFT infrastructure, limiting its ability to bypass dollar-denominated settlement rails.
Patent Analysis and Innovation
Japan remains an intellectual property powerhouse, particularly in hardware. Patent filings in 2025 grew, led by innovations in electrical machinery and measurement instruments. However, a "Patent-Value Mismatch" exists. Japanese firms own the patents for critical robotic components and silicon wafers, but U.S. firms own the platforms that integrate them.
This commercialization gap means the economic rent from Japanese innovation often accrues in dollars, not yen. Japanese multinationals effectively act as high-end component suppliers to the U.S. tech ecosystem, reinforcing the dollar’s dominance.
Management and Leadership
The BOJ’s communication strategy remains its weakest link. Governor Ueda’s refusal to adopt a hawkish tone during press conferences contradicts the urgency of the bond market. This leadership gap emboldens speculators who interpret "caution" as "paralysis." Effective central banking requires managing expectations; the current leadership has allowed the market to dictate the narrative, turning potential policy wins into currency routs.
Conclusion
The USD/JPY rally is a symptom of a deeper imbalance. It reflects a world where capital seeks the growth of the U.S. AI sector over the stability of Japanese bonds. Unless the BOJ disrupts this dynamic with shock-and-awe tightening—or the U.S. economy falters—the path of least resistance remains higher. The 158.00 level is not a ceiling; it is the next threshold in a fundamental repricing of Japan’s role in the global economy.

S&P 500 Daily Chart Analysis For Week of Dec 19, 2025Technical Analysis and Outlook:
In the most recent weekly trading session, the S&P 500 Index demonstrated significant downward movement followed by a notable recovery, bringing it closer to our primary target for the Outer Index Rally at 6,945.
At this time, the current market positioning indicates robust potential for continued upward momentum, with the principal objective being to reach the Key Resistance level of 6,905. This milestone is expected to contribute towards achieving the anticipated target of the Outer Index Rally at 6,945.
Nonetheless, it is essential to recognize that, given prevailing market dynamics, there is a considerable probability that prices will experience a pullback before realigning with the projected upward trajectory.

Bitcoin(BTC/USD) Daily Chart Analysis For Week of Dec 19, 2025Technical Analysis and Outlook:
The Bitcoin market in this week's trading session continued to trade within an Active Inner Trading Zone defined by the Mean Resistance level at 93,500 and the Mean Support level at 89,300.
Given the current dynamics of the cryptocurrency market, it is advisable for traders to monitor price action in this Active Trading Zone closely. A breakout may lead to additional targets, including an Interim Inner Coin Rally at 98,000 and a subsequent Interim Coin Rally at 102,500. Conversely, on the downside, the established Mean Support levels are situated at 84,700 and 82,500, with the prospect of an Outer Coin Dip occurring at 78,500.

$JPIRYY - BoJ Raises Rates to Highest Since 1995(December/2025)ECONOMICS:JPIRYY
December/2025 +0.75%
source: Bank of Japan
- The Bank of Japan unanimously raised its key short-term interest rate by 25bps to 0.75% at its December meeting,
the highest level since September 1995 and in line with consensus.
The move marked its second rate hike this year after a similar increase in January, with policymakers signaling further tightening if the outlook outlined in October materializes.

GBP/EUR Outlook: Sterling Plunges on Inflation MissMarket Volatility and Economic Shifts
The British Pound (GBP) crashed violently on Wednesday. Markets reacted instantly to the UK’s surprising inflation data. Headline inflation dropped to 3.2% in November. This figure missed the 3.5% forecast significantly. Core inflation also fell to 3.2%, signaling deep economic cooling. Traders immediately bet on a Bank of England (BoE) rate cut. The sudden drop reshapes the short-term currency landscape completely.
Geostrategy and Monetary Divergence
A clear strategic gap now exists between European powers. The BoE must prioritize growth, forcing a dovish pivot. Officials will likely cut rates to stabilize the economy. In contrast, the European Central Bank (ECB) holds firm. ECB President Lagarde maintains a strict, neutral policy stance. This divergence draws global capital away from London. Investors now favor the stability of the Eurozone.
High-Tech Trading and Cyber Impact
Modern currency moves often stem from automated systems. High-frequency trading algorithms executed massive sell orders on Wednesday. These bots react to data variances in milliseconds. The inflation "miss" triggered pre-programmed selling cascades. This cyber-driven volatility punishes currencies instantly. Human traders struggle to match this algorithmic speed. Such technological dominance defines current market liquidity.
Business Models and Industry Trends
Currency devaluation impacts UK corporate strategy deeply. Importers face immediate cost spikes, squeezing profit margins. Management teams must renegotiate supply chain contracts quickly. Conversely, the high-tech export sector gains a competitive edge. Cheaper Sterling makes UK innovation more attractive abroad. This shift rewards companies with agile, export-oriented business models.
Innovation and Patent Analysis
A lower exchange rate can stimulate scientific investment. UK firms often rely on foreign capital for R&D. A cheaper Pound makes UK assets and patents attractive targets. Foreign investors may acquire undervalued British intellectual property. This trend could accelerate cross-border mergers in biotech and science. However, retaining top talent becomes harder with a weaker currency.
Forecast: The Policy Path Ahead
Attention now locks onto the BoE’s forward guidance. Investors demand a clear roadmap for 2026 interest rates. A confirmed dovish stance will drive Sterling lower. Meanwhile, the Euro stands resilient despite mixed German data. The policy gap between the UK and the EU is widening. This structural divergence points to further GBP/EUR downside.

$GBIRYY - U.K CPI (November/2025) ECONOMICS:GBIRYY 3.2%
November/2025 (-0.4%)
source: Office for National Statistics
- The annual inflation rate in the UK slowed to 3.2% in November,
the lowest in eight months, compared to 3.6% in October and forecasts of 3.5%.
The figure is also lower than the BoE's prediction of 3.4%, led by a slowdown in food and non-alcoholic beverages.

USD/ARS Outlook: Milei’s Inflation-Linked PivotArgentina has officially changed how it manages the Peso. President Javier Milei’s government introduced a new currency band tied to inflation. This move replaces the old fixed system. The goal is to stop the Peso from becoming too expensive. Markets reacted calmly, with the Peso shifting slightly. This analysis explores why this matters for the USD/ARS pair.
Macroeconomics: The Inflation Link
The Central Bank of Argentina (BCRA) changed its trading rules. Previously, the Peso devalued by a fixed 1% monthly. Now, the trading band adjusts based on official inflation data. This prevents the currency from lagging behind real prices. The bank aims to build $17 billion in reserves. This liquidity is vital for stabilizing the economy. GDP is forecast to grow 3.5% next year, signaling a recovery.
Geopolitics & Strategy: Pleasing the IMF
This monetary shift is a strategic diplomatic move. The International Monetary Fund (IMF) openly urged Argentina to rebuild reserves. By loosening controls, Milei aligns with Western financial standards. This compliance is crucial for regaining access to international debt markets. It signals to global investors that Argentina is serious about paying its debts. This reduces the risk of default and attracts foreign capital.
Management & Leadership: The "Turnaround CEO"
View Milei’s administration as a corporate restructuring team. He acts like a CEO saving a bankrupt company. The "culture" has shifted from spending to austerity. He prohibited the Central Bank from printing money to fund the government. This is a massive leadership change. It forces the public sector to manage budgets strictly. This discipline builds trust in the management of the Argentine economy.
Industry Trends: The Tourism Flip
Currency value dictates tourism flow. A strong Peso made Brazil cheap for Argentines. Record numbers flocked to Brazilian beaches, spending money abroad. Conversely, foreign tourism to Argentina dropped 14% because it became too expensive. The new policy corrects this. A weaker Peso makes Argentina attractive to visitors again. This supports local hotels and restaurants that were losing business to neighbors.
Business Models: Exporters vs. Importers
The previous rigid exchange rate hurt Argentine exporters. Their costs rose with inflation, but their revenue stayed flat due to the currency peg. The new inflation-linked band fixes this broken business model. Farmers and manufacturers can now predict margins accurately. They no longer fear that inflation will eat their profits. This stability encourages them to sell goods abroad, bringing dollars into the country.
Technology & Cyber: Fintech Stability
A predictable currency is essential for the technology sector. Volatile exchange rates force tech companies to focus on financial hedging rather than product innovation. Stability allows fintech startups to plan long-term. It also reduces the need for citizens to use complex crypto-channels to hide wealth. A normalized economy reduces the incentive for digital black markets and cyber-financial crimes.
Science & Patent Analysis
Scientific progress requires long-term investment. Investors tend to avoid funding research in countries with unstable currencies. Milei’s push for a market-based currency helps value intellectual property (IP) correctly. International firms can now assess the value of Argentine patents without currency risk. This clarity could boost foreign direct investment (FDI) into Argentina’s scientific and biotech sectors.
Conclusion
The USD/ARS pair is entering a phase of controlled adjustment. The government will let the Peso weaken, but only to match inflation. This is a smart, calculated decline. It protects reserves and supports local industry. For traders, this means the trend is predictable. The volatility of the past may be replaced by a steady, managed trend.

$USUR - Unmployment Rate (November/2025)ECONOMICS:USUR 4.6%
November/2025
source: U.S. Bureau of Labor Statistics
- The US unemployment rate increased to 4.6% in November 2025 from 4.3% in August, exceeding market expectations of 4.4% and marking the highest level since September 2021.
The number of unemployed stood at 7.8 million, little changed from September, while employment levels were also broadly stable.
The labor force participation rate was little changed at 62.5%, reflecting a largely steady labor force.
The broader U-6 unemployment rate in the United States, which includes discouraged workers and those working part-time for economic reasons, rose in November, reflecting a sharp increase in involuntary part-time employment.

$USNFP - Non-Farm Payrolls (November/2025)ECONOMICS:USNFP
November/2025
source: U.S. Bureau of Labor Statistics
- U.S job growth totaled 64K in November, compared with a 105K loss in October and market expectations of a 50K increase.
Employment rose in health care and construction, while federal government continued to lose jobs.
Meanwhile, the unemployment rate rose to 4.6%, more than expected.

USD/CLP Plunges: Kast Victory & AI Copper BoomMarket Reaction to Political Shift
The Chilean peso has surged following José Antonio Kast’s decisive presidential victory. Markets reacted instantly to the news. The USD/CLP exchange rate dropped to 913.58, strengthening significantly against the dollar. Kast secured 58% of the vote in the December 14 runoff. This marks Chile’s sharpest shift to the political right in decades. Investors view his platform as highly business-friendly. Consequently, capital inflows have accelerated, driving the peso’s value upward. The local stock index, S&P CLX IPSA, also hit record highs. Financial markets clearly favour this new political direction.
Geopolitics and Geostrategy: A New Stance
Kast’s victory signals a major geostrategic pivot for Chile. He campaigned on strict border controls and mass deportations. This focus on security addresses voter frustration with rising violence. However, these policies carry geopolitical risks. Aggressive border measures could strain diplomatic relations with neighbouring countries. Geostrategically, a stable Chile attracts foreign direct investment. Yet, potential social tensions from strict policing could rattle investors later. The administration must balance domestic security with regional stability to maintain market confidence.
Macroeconomics: Fiscal Discipline Returns
The new administration promises aggressive fiscal tightening. Kast plans to cut public spending by roughly $6 billion. He aims to achieve this by eliminating "political waste." This contrasts sharply with the previous administration's approach. Critics argue these cuts endanger social programs like state pensions. Supporters view them as essential for economic health. This proposed fiscal discipline reduces the risk of sovereign debt expansion. Consequently, bond yields have compressed, and credit risks have lowered. Markets interpret these moves as positive for the Chilean peso’s long-term stability.
Industry Trends: The AI and Copper Connection
Global technology trends are inadvertently boosting the Chilean peso. The Artificial Intelligence (AI) boom requires massive data processing capacity. Building data centres demands significant amounts of copper. Chile is the world’s leading copper exporter. Copper prices have rallied to near $12,000 per tonne due to this surging demand. Supply bottlenecks further drive up prices. This "science of scarcity" directly benefits Chile’s trade balance. High-tech industries effectively subsidise the Chilean peso through their raw material needs.
Technology and Innovation: Powering the Future
The intersection of high-tech innovation and mining is critical here. Clean energy infrastructure also relies heavily on copper. As patents for green technologies expand, copper demand grows structurally. Projections indicate this investment cycle will persist for years. This provides a long-term floor for the peso. The mining sector may see increased demand for advanced extraction technologies. Innovation in mining efficiency will be key to meeting global supply needs. Chile sits at the centre of this technological resource war.
Leadership and Business Models
Kast proposes a CEO-style approach to governance. His "emergency" government aims to slash bureaucracy and jump-start growth. He plans to deregulate key sectors and lower taxes. This suggests a shift toward neoliberal business models in government operations. However, management challenges loom. Kast lacks a congressional majority. He must build cross-party coalitions to pass laws. Leadership success depends on negotiation, not just executive orders. Failure to unite Congress could dilute his ambitious economic reforms.
Technical Analysis: Key Levels to Watch
Traders should monitor specific technical thresholds for USD/CLP. The 910 level acts as immediate support. Resistance sits between 945 and 965. Momentum indicators currently suggest the peso is overbought. This means the currency might weaken slightly in the short term. Global factors are expected to resume dominance soon. Once the "election euphoria" fades, U.S. interest rates will drive the pair. Traders must remain vigilant for a potential reversal.
Conclusion: A Delicate Balance
The USD/CLP outlook remains cautiously optimistic. Kast’s win provides a short-term confidence boost. Simultaneously, the global AI boom supports copper prices. These factors combine to strengthen the Chilean currency. However, governance risks persist due to a divided Congress. The administration faces a difficult balancing act between reform and social stability. For now, the trend favours the peso, but volatility remains a threat.

XAUUSD – Key Resistance Ahead in the Ongoing Bullish CycleAlthough gold has been moving with weaker momentum compared to silver, it still remains firmly within its broader bullish cycle. The most important level ahead is the $4,400 zone, and a breakout above this area would confirm the beginning of gold’s next major bullish wave.
This upcoming move is also supported by the macro outlook and fundamental conditions, suggesting that a continuation to the upside is likely in the near future.
At the same time, the impact of global economic, political, and especially geopolitical/military developments on gold should not be overlooked, as they continue to play a crucial role in shaping its long-term trajectory.

NZD/AUD Forecast: The Climb to 0.90 Amid Diverging Rates
Current Status: The New Zealand Dollar (NZD) has stabilized against the Australian Dollar (AUD), trading at 0.8728 . After bottoming near 0.86 in November, the cross is recovering, driven by a recalibration of interest rate expectations and shifting economic currents.
Macroeconomic Analysis: The Central Bank Divergence
A primary driver of the NZD/AUD recovery is the reassessment of monetary policy trajectories. The Reserve Bank of New Zealand (RBNZ) faces persistent domestic inflation, tempering expectations for aggressive rate cuts. Conversely, the Reserve Bank of Australia (RBA) maintained its cash rate at 3.60% in December, maintaining a hawkish stance due to upside inflation risks. This narrowing policy gap, where the RBNZ is no longer significantly "out-dovin" the RBA, provides crucial support for the Kiwi dollar.
Geostrategy & Geopolitics: The China Factor
Both currencies remain sensitive to Chinese economic stability, but their exposure differs significantly. The AUD serves as a liquid proxy for Chinese industrial demand, facing volatility as Beijing recalibrates stimulus measures for 2026. In contrast, the NZD ties closely to soft commodities like dairy and meat, which see resilient demand despite broader geopolitical friction. As trade routes stabilize, lower volatility in New Zealand's export markets contributes to the currency's "safe harbor" appeal relative to the risk-sensitive Aussie.
Industry Trends: AgTech vs. Mining Tech
New Zealand’s shift toward high-margin agricultural technology (AgTech) is altering its export profile. Innovation in sustainable farming and automated dairy processing boosts productivity, offsetting headwinds from traditional commodity price fluctuations. Meanwhile, Australia’s mining sector grapples with high capital costs for green energy transitions. This structural divergence suggests New Zealand’s export economy is entering a phase of higher efficiency, supporting long-term valuation.
Economics: The Housing Market Constraints
Economic resilience is visible in the housing sector. Australian data indicates a 7.2% rise in home values since early 2025, driven by supply shortages. This "wealth effect" keeps consumption high, forcing the RBA to stay restrictive. New Zealand’s housing market shows more balanced supply-demand dynamics. This stability allows the RBNZ more flexibility, potentially reducing the risk of a policy error that could devalue the currency.
Forecast: The Path to 0.90
Current projections estimate the NZD/AUD cross will climb toward 0.90 by early 2027 . This forecast assumes a gradual normalization of the interest rate differential. The recovery will likely be non-linear; periods of Australian dollar strength are inevitable if global risk sentiment spikes. However, as the easing cycle proves shallower than feared and the RBA eventually pivots, the fundamental floor for the NZD is expected to rise.
Conclusion: The NZD/AUD is no longer trapped in a one-way bearish trend. Investors should watch the spread between Australian and New Zealand 2-year swap rates as the key indicator for the next leg higher.

S&P 500 Daily Chart Analysis For Week of Dec 12, 2025Technical Analysis and Outlook:
In the course of the recent weekly trading session, the S&P 500 Index exhibited significant gyrational volatility, reaching a Key Resistance level at 6,895 before retracting to the Major Mean Support level delineated at 6,816.
At present, this market positioning indicates strong potential for continued downward movement, with the primary objective focused on targeting the Mean Support level at 6,755 via heavily traded Mean Support at 6,816.
Nevertheless, it is crucial to recognize that, given current market dynamics, there is a substantial probability of a robust price surge to retest the critical Key Resistance at 6,900, which may be accompanied by a strong rebound to the Outer Index Rally target at 6,945.

Bitcoin(BTC/USD) Daily Chart Analysis For Week of Dec 12, 2025Technical Analysis and Outlook:
During the most recent trading session, the Bitcoin market navigated within a channel defined by the Mean Resistance level at 93,500 and the Mean Support level at 89,300.
Current market sentiment suggests an upward move, with price action pointing to a retest of the Mean Resistance level at 93,500. Additional targets include the Interim Inner Coin Rally at 98,000 and a subsequent, significant objective: the next Interim Coin Rally at 102,500.
Given the prevailing dynamics of the cryptocurrency market, there exists a potential for an intermediate pullback to the Mean Support level of 89,300. This pullback could extend to further Mean Support levels at 86,400 and 82,400, ultimately culminating in the anticipated Outer Coin Dip at 78,500 before a notable upward momentum is expected to occur.

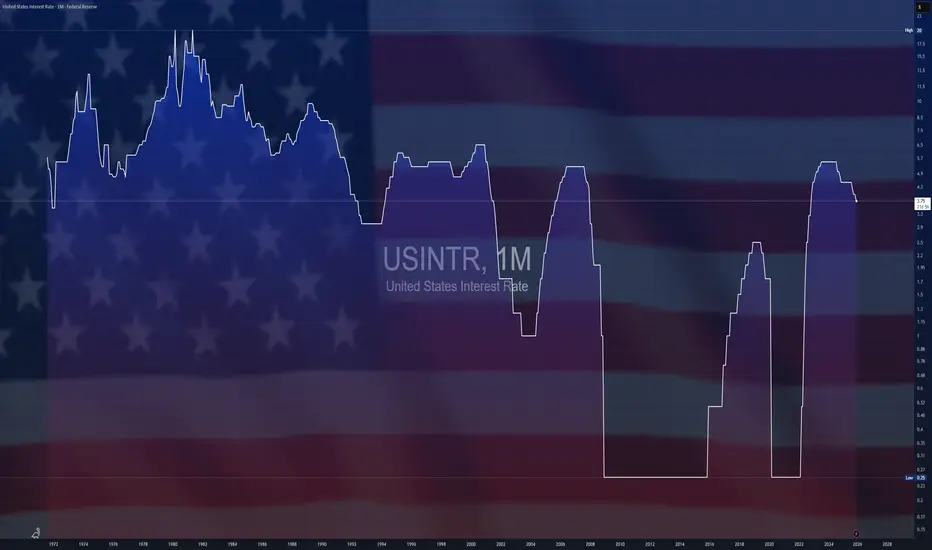
$USINTR - Fed Signals Single Cut in 2026 (December/2025)ECONOMICS:USINTR 3.75%
December/2025 (-0.25%/bps)
source: Federal Reserve
-The Federal Reserve lowered the funds rate by 25bps to 3.5%–3.75%, marking the lowest level since 2022, but signaled a tougher road ahead for further reductions.
The policymakers left their projections unchanged from September, signaling only one 25bps cut in 2026.
Three members of the commitee continued to vote against the cut, which hasn’t happened since September 2019.
USD/CAD: Will the Great Divergence Break the Greenback?The financial world stands on the precipice of a defining moment for North American currency markets. The USD/CAD pair hovers near 1.3855, ticking nervously as traders count down to a rare double-header of central bank decisions. December 10, 2025, marks a pivotal divergence point where economic pathways between the United States and Canada split sharply. This is not merely a technical adjustment; it is a fundamental collision of monetary policy, geopolitical strategy, and industrial resilience. The outcome will likely dictate the Loonie’s trajectory for the coming year.
Macroeconomics: A Tale of Two Trajectories
The macroeconomic landscape reveals a stark contrast between the two nations. The Federal Reserve prepares to slash interest rates for the third consecutive time, targeting a range of 3.50%-3.75%. Markets price this move at nearly 88% probability. The US labor market displays clear signs of cooling, necessitating easier financing conditions to prevent a recession. Conversely, the Bank of Canada (BoC) stands firm. Canada’s economy defied expectations with a robust 2.6% annualized GDP growth in Q3, crushing earlier forecasts. This resilience compels the BoC to hold rates at 2.25% to prevent reigniting inflation, which remains sticky at 2.2%.
Geostrategy: The Fertilizer Chess Game
Beyond interest rates, a high-stakes geopolitical trade war complicates currency valuation. The US administration’s threat of severe tariffs on Canadian fertilizer imports paradoxically jeopardizes US food security. American farmers rely heavily on Canadian potash, importing over half of Canada’s production. Tariffs here act as a double-edged sword: they aim to punish Canada but simultaneously drive up input costs for the US agricultural sector. This strategic misstep weakens the US Dollar’s purchasing power domestically while forcing the administration to print subsidies, further diluting the currency.
Industry Trends: Agriculture Under Siege
The agricultural industry sits at the epicenter of this financial storm. The promise of $12 billion in aid to US farmers highlights the structural damage already inflicted by trade barriers. This subsidy model creates a vicious cycle of dependency rather than innovation. While Canadian fertilizer producers face tariff headwinds, their product remains essential, granting them significant pricing power. US farmers face a "margin squeeze" that ripples through the broader economy, softening the US economic outlook and diminishing the appeal of the Greenback relative to the resource-backed Loonie.
Management & Leadership: Powell vs. Macklem
Leadership styles at the central banks further amplify market volatility. Fed Chair Jerome Powell operates under intense political pressure and conflicting data, forcing a reactionary "data-dependent" approach. His leadership currently signals caution and retreat. In contrast, BoC Governor Tiff Macklem displays a steady hand, anchoring policy to tangible growth metrics like the recent 180.6K job surge. This stability in Canadian monetary leadership attracts foreign capital seeking predictable returns, creating a natural demand for the Canadian Dollar over the politically volatile USD.
Business Models: Supply Chain Resilience
The trade dispute forces companies to rethink business models. Canadian exporters are diversifying markets beyond the US, strengthening long-term resilience. Meanwhile, US importers face a supply chain crisis, unable to quickly source alternative fertilizer at competitive rates. This rigidity in the US supply chain exposes a critical weakness in the American business model for agriculture. Investors recognize this structural flaw, leading to capital flows that favor the adaptability of the Canadian export sector, thereby supporting the CAD against the USD.
Conclusion: The Loonie’s Rebellion
The confluence of diverging interest rates and self-inflicted US trade wounds creates a perfect storm for USD/CAD bears. The Federal Reserve’s dovish pivot contrasts sharply with the Bank of Canada’s confident hold, widening the yield spread in favor of Canadian assets. Combined with the strategic failure of fertilizer tariffs, fundamental drivers point toward a weaker US Dollar. Traders must watch the 1.3850 level closely; a break below likely signals the start of a prolonged downtrend for the pair. The divergence is real, and the Loonie is ready to rebel.

$CNBOT- China’s Trade Surplus Reaches $1T (November/2025)ECONOMICS:CNBOT
November/2025
source: General Administration of Customs
- China’s trade surplus topped a record of $1 trillion in the first 11 months of the year a deepening slump in shipments to the US.
In November alone, the surplus reached $112 billion,
the third-largest on record and well above expectations,
as exports rebounded 5.9% year-on-year after October’s unexpected drop,
outpacing a 1.9% rise in imports.

S&P 500 Daily Chart Analysis For Week of Dec 5, 2025Technical Analysis and Outlook:
In the recent weekly trading session, the S&P 500 Index recorded significant gains, achieving our primary target at the Key Resistance level of 6,895. Presently, this market position indicates potential downward movement, with the primary target set at Mean Support at 6,816, and the possibility of further decline to Mean Support at 6,755.
Nevertheless, it is essential to acknowledge that, in light of the current market dynamics, there exists a considerable probability of a repeat retracement from the Key Resistance at 6,895, accompanied by a robust bounce from Mean Support at 6,816.

EUR/USD Daily Chart Analysis For Week of Dec 5, 2025Technical Analysis and Outlook:
In the most recent trading session, the Eurodollar currency rose sharply, reaching the Mean Resistance level at 1.167. Current market conditions indicate that the price may pull back to the critical Mean Support level at 1.160.
It is also crucial to monitor the breakout levels for this currency. On the upside, there is potential for a rise to the Mean Resistance at 1.167 once again and possibly extending to 1.175. Conversely, on the downside, a breakout could take it to the Mean Support at 1.160, with the possibility of retesting the completed Outer Currency Dip at 1.148.

Bitcoin(BTC/USD) Daily Chart Analysis For Week of Dec 5, 2025Technical Analysis and Outlook:
In the most recent trading session, the Bitcoin market experienced a Pump-and-Dump scenario and continued the downward trend observed over the past week. The price has reached the Mean Resistance level of 93,500.
Market sentiment is declining, with current price action focusing on identifying the Mean Support level at 88,000. Additional support is identified at 84,500, with a further significant drop possible to the Outer Coin Dip at 78,500.
Given the current dynamics of the crypto market, there is potential for an intermediate rebound from the Mean Support level of 88,000 back up to the Mean Resistance level of 93,500. Furthermore, an external extension may target the Interm Inner Coin Rally at 98,000.

$EUIRYY- E.U CPI (November/2025)ECONOMICS:EUIRYY 2.2%
November/2025
source: EUROSTAT
- The annual inflation rate in the Eurozone edged up to 2.2% in November from 2.1% in October, slightly above expectations of 2.1%.
Prices grew faster in the services sector, while energy costs continued to decline but at a slower pace.
Meanwhile, core inflation held steady at 2.4%.

Chipotle Mexican Grill | CMG | Long at $30.56Chipotle NYSE:CMG stock has dropped dramatically since 2024, but the company has been *highly* overvalued for many, many years (69x p/e in June last year). As of Friday, November 7, 2025, the stock price entered my "crash" simple moving average zone (green lines). I do not suspect this is truly bottom, though. The company's growth is likely to slow into 2026 as people continue to spend less, and the stock finally starts to enter a reasonable p/e value (currently 27x). I anticipate further entry possibilities near $25 in the short-term if the economy continues to show more and more weakness. Entry into the "major crash" simple moving average zone, or gray lines, near $20-$24 isn't out of the question either. Thus, a personal entry at $30.56 is simply a starter position.
Growth
Earnings per share anticipated to rise from $1.60 in 2025 to $1.82 by 2028.
Revenue expected to rise during that time from $11.9 billion to $16.6 billion.
www.tradingview.com
Health
Extremely healthy, financially
Altman's Z Score / Bankruptcy risk: 7.5 (very low risk)
Quick Ratio: 1.5 (low debt)
Action
While there is risk of continued near-term pain for NYSE:CMG , the longer outlook is reassuring if true. Thus, at $30.56, Chiptole is in a personal buy zone (starter position) with risk of a continued drop to $25 or, "major crash" territory in the low $20s. These will be other personal entry points.
Targets into 2028
$35.00 (+14.5%)
$39.00 (+27.6%)
