Early But Still ValidIt seems like the Dow Jones went on to test $33,982 coming down towards target
T1 @ $31,068.00
Overall outlook seems bearish.
Will update soon.
Economy

DO NOT BUY BITCOIN YET … The whole entire stock market and crypto are going to be crashing much worse.
Why? - monkeypox/Orthopoxvirus 18,400 cases
- monkeypox global cases 50,000
COVID-19 aka SARS-Cov-2
- Global: 602 million cases / Deaths: 6.50 million
USA: 94.2 million cases/ deaths: 1.04 million
The Epidemic Is NOT OVER.
Now for the government
On September 1st they going to take 90 billion off the market which will cause volatile insane of all the markets and cryptos.
Last time in June the took 40 billion out which is why cause everything to crash.
As for bitcoin we are still in a high sell Pressure we aren’t bottom yet. 12K along with a dip has stronger floors & 10K with a dip as well which will cause the bulls to take the full recovery.. if I were you please do not buy bitcoin yet it’s still too early and we aren’t bottom yet.
Stay safe

S&P 500 Daily Chart Analysis For August 26, 2022 Technical Analysis and Outlook
The current market fate is the newly created Mean Res 4205 - inverse from Mean Sup 4205. This was a critical sell zone if you short minded. The current downtrend is expected to continue to Inner Index Dip 3965. Interim bullish moves are possible within the current downtrend.

GOLD - LONG SPECULATION For gold based on the performance of the dollar and the world economy, I place SPECULATIONS as part of my knowledge, which I will gladly verify in the time frame specified on the chart.

Bitcoin In a Sucker's Rallyhello frends its ur pal coinholio and i have an opinion abou the marked
my thinkings is that the bit coin is not at a good price. too much people think that fed will pivot at the first sign of a down turn and we will get qe to maek price again. me no thinks that will happen sooner enough until market is alredy worse than it be right now. there is a rally in stocks that bitcoin follow right now because some peeps think we can land softly, but i think we will land on our bungholes, let me explain the reason why:
fed pause is not fed stimmy
if internet rates make a rise, the fed will stop making them go. but fed will not give stimmy until everyone gets fired and we are balls deep in a recession. me thinks not only the soft landing narrative is false, it will break down in the next few months and bitty will be mad. recession will come sooner at the end of the year and stimmy in mid to late 2023. the numbers of peoples with job is still very high but its one of the only raisins that we arent in official recessino, spy lags behind, but bitty will follow spy price action and get crushed to oblivion in a recession.
people is buying less stuffs, less stuffs is being producted, there is less supply, less demand, less of the real wagerinos. we is at the cusp of recession and its coming sooner than u think. my source is a forest rat, i met him in a forest and his name is benjamin and he told me that things are looking bad and i should move into the forest with him. then we discusted the market and he said he sold his house a few months ago. some people use like, leading and coincidence indicators to make decides about this but woodland creatures i thin can tell a more accurate story about whas gonna happen. im gonna not post much cuz they dont have internet in the forest but i put a lot of money into james bond and took him into the forest cuz apparently he does goodly during slowing economix gross.
thank you for watching if u like my video please smash that like button and subscribe to my channel and dont forget to enable the notifications so i can tell u which berries are safe to eat and which ones give u the runs

S&P 500: Daily outlookS&P 500 forming a bearish Gartley pattern that I found out in Daily chart, what we could to see a bearish movement to the previously lower like 3600 pts.
Also, remember that this occur what happen what the FED could to hike interest rate right now in September put the global financial market in worst situation of the bear market. And also tightening the America monetary policy.
Talking about technical analysis, we see that S&P 500 forming a higher low in 3 occasion that maybe, I thinking that stock market could to be a possible market crash what FED do, and also cooling down the inflation rate
But now, S&P 500 show us that stock market could to be weak during the next days, and also very correlated with Bitcoin and cryptocurrencies to short this assets.
I hope that this idea support you!!!

EUR/USD Daily Chart Analysis For August 26, 2022Technical Analysis and Outlook:
Eurodollar attempted to settle above our Mean Res 1.005. The European currency must close above 1.000 to have a possibility to generate sustainable upside momentum. However, as the currency market continues to trade under the 1.000 threshold, bears will have a fair chance to push it to and under Key Sup 0.9940 and completed Inner Currency Dip 0.9914, and further continue to Outer Currency Dip 0.9765.

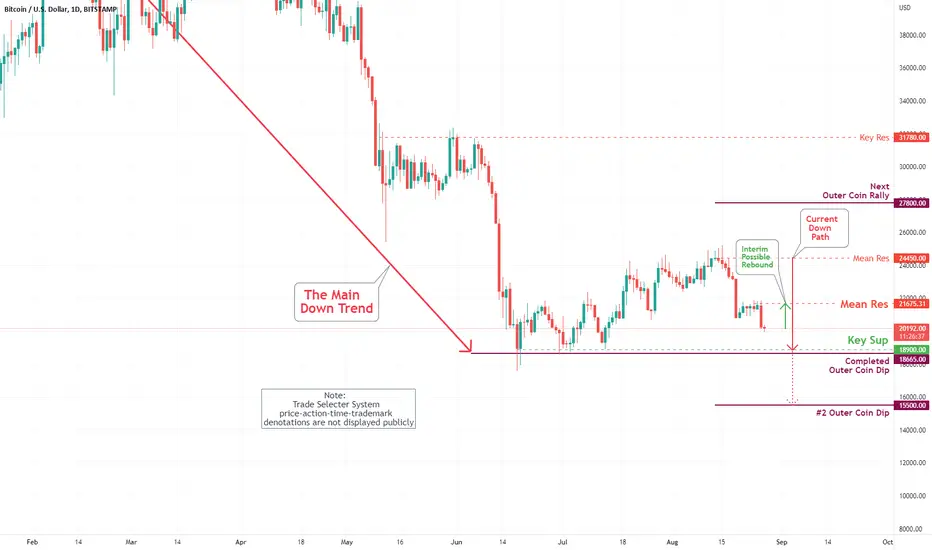
Bitcoin (BTC/USD) Daily Chart Analysis For August 26, 2022Technical Analysis and Outlook:
On the Bitcoin chart, the harsh price bar refers to the current down path, which is designated at Key Sup at $18,900 and completed Outer Coin Dip at $18,665, a descriptor of Bitcoin's volatile market price action. However, outside of these predictable analysis indicators designated by TradeSelecter, other economic and political determinants BTC's broader bearish sentiment.
Fed vs Bitcoin- would be much to long to explain about global economy mechanics.
- everything is in chart.
- if you get those moves, u will understand that "everything is linked" ( or inversed )
- Check my previous Analysis about " brrrrrr " there :
Happy Tr4Ding !
GEO: HEAVILY SHORTED, SQUEEEZE COMINGZero resistance until $21 per share, shorts will have to buy back, 85% of shares are owned, and 15% are shorted. Do the math.

Personally I think Red path wins here.Opinion:
- Biden inflation pivot ahead of mid-terms
BIDEN: WE ARE SEEING PROGRESS ON GASOLINE PRICE REDUCTIONS AND INFLATION.
- FOMC minutes announcing 50bps or lower futures hikes to
"Gauge the effect of previous hikes"
- Mid-terms nearing and political funding needs
- E.U cost of living crisis/ German PPI @ 37% / Continued conflict in Ukraine & commodities crisis
GERMAN PPI YOY ACTUAL 37.2% (FORECAST 31.8%, PREVIOUS 32.7%) $MACRO
With these factors in mind and an acknowledgement that we do need more QT and hikes; all the while, taking into account that any further tightening will place us on a 3rd quarter of negative GDP growth. It is my opinion that instead the political needs will be more important. This makes me think that the E.U in the name of self-preservation will subsidize house-holds, while increasing barriers to debt over winter. ("Controlled" inflationary action). U.S should as announced by the FOMC minutes go through a period of hike stabilization (Re-instating stability in the procurement of structured leverage / Inflation action)
From here I see 2 option:
1. Politics forcing us into hyper-inflation and bitcoin aswell as other assets experience a fast recovery.
2. Politics forcing us into hyper-inflation and bitcoin aswell as other assets experience a short lived fast recovery. (A.K.A tightening and QT break). Lasting possibly until the end of the mid-terms.
What I do not think is possible:
A return to BTC sub 9k when inflation is running high.
What to keep in mind:
Inflation comes second to job market.
Recession/Depression is a much worse evil than inflation.
Notes on how I personally use my charts/NFA:
Each level L1-L3 (S1-S3) and TP1-TP3 has a deployment percentage. The idea is to flag these levels so I can buy 11% at L1 , 28% at L2 and if L3 deploy 61% of assigned dry powder. The same in reverse goes for TP. TP1: 61%, TP2:28% and TP3:11%. If chart pivots between TP's and L's these percentages are still respected. I like to use the trading range to accumulate by using this tactic.
Just my personal way of using this. This is not intended or made to constitute any financial advice.
This is not intended or made to constitute any financial advice.
FED Macro Situation Consideration:
All TP's are drawn within the context of a return to FED neutral policy. I do not expect these levels to be reached before tightening is over.
NOT INVESTMENT ADVICE
I am not a financial advisor.
The Content in this TradingView Idea is for informational purposes only, you should not construe any such information or other material as legal, tax, investment, financial, or other advice. Nothing contained within this idea constitutes a solicitation, recommendation, endorsement, or offer to buy or sell any securities or other financial instruments in this or in in any other jurisdiction in which such solicitation or offer would be unlawful under the securities laws of such jurisdiction.
All Content on this idea post is information of a general nature and does not address the circumstances of any particular individual or entity. Nothing in the idea/post constitutes professional and/or financial advice, nor does any information on the idea/post constitute a comprehensive or complete statement of the matters discussed or the law relating thereto. You alone assume the sole responsibility of evaluating the merits and risks associated with the use of any information or other Content on the idea/post before making any decisions based on such information.

S&P 500 Daily Chart Analysis For August 19, 2022 Technical Analysis and Outlook
The current market destiny is the newly created Mean Sup 4205. The Mean Sup 4162, as specified in S&P 500 Daily Chart Analysis For August 12, is open for business. However, a high probability is an immediate rebound to Key Res 4302 and Inner Index Rally 4330.

EUR/USD Daily Chart Analysis For August 19, 2022Technical Analysis and Outlook:
The Eurodollar has peeled off our Mean Res 1.032 and is heading for a retest of our Key Sup 1.0017 and Completed Currency Dip 0.9960. The predominant trend is down.

📊SPX: another fall is near❓📊 Since mid-June, market participants have witnessed the recovery of the stock market, that has dipped significantly after the aggravated geopolitical situation and rising interest rates. The S&P500 index reached $4300 and is now testing serious resistance (resistance line). After a very impressive recovery, the rally in the market may stall due to increased concerns about the state of the global economy.
On the chart (left), you can clearly see how the market reacted to the last three rate increases (+0.5%; +0.75%; +0.75%). The latest increase of 0.5% on April 4 turned out to be unfavorable for the market (-18.17%). Further two increases of +0.75% had a positive effect and the market rose by +6.79% and +7.80%, coming close to offsetting the previous decline. Raising the rate to 3.0% is currently estimated at 75% probability. Until that time (09/21/2022), growth is expected to continue. Going forward (in the second half of September), the market may face profit taking from long position holders, which could cause a fall, if not a sharp fall. However, there is also the possibility that there will be intense short selling pressure. It is especially necessary to pay attention to the price area near the $4590 level.
It's not just America that's worried about a recession right now. Germany and other eurozone countries are hit hard by the energy crisis. China's economic growth concerns also came out this week, following the release of disappointing statistics on retail sales, industrial production and fixed investment on Monday.
If concerns about the continuation of the "bear" market are justified, then we can expect a fall of -20% (based on historical data).
To top it all off, the Fed has just begun to cut its balance sheet. We know that interest rates will rise in the short term, and not just in the US. Inflation in advanced economies is on the rise. The global economy is suffering, and the central banks of almost every major economy are tightening their policies. In such conditions, the growth of shares is not to be expected.

USD/TRY now looks to the CBRTUSD/TRY now looks to the CBRT
- USDS/TRY clinches the second session in a row with gains on the back of the continuation of the bid bias in the greenback, always amidst persistent risk-off tone and helped further by rising US yields.
- In the meantime, the lira is expected to remain under scrutiny ahead of the interest rate decision by the Turkish central bank (CBRT) later in the week. Consensus among investors, however, sees the central bank staying on the sidelines and keeping the One-Week Repo Rate unchanged at 14.00%.
What to look for around TRY
- The upside bias in USD/TRY remains unchanged and stays on course to revisit the key 18.00 zone.
- In the meantime, the lira’s price action is expected to keep gyrating around the performance of energy and commodity prices - which are directly correlated to developments from the war in Ukraine - the broad risk appetite trends and the Fed’s rate path in the next months.
- Extra risks facing the Turkish currency also come from the domestic backyard, as inflation gives no signs of abating (despite rising less than forecast in July), real interest rates remain entrenched in negative figures and the political pressure to keep the CBRT biased towards low interest rates remains omnipresent. In addition, there seems to be no Plan B to attract foreign currency in a context where the country’s FX reserves dwindle by the day.
*Key events in Türkiye this week: Budget Balance (Monday) – CBRT Interest Rate Decision (Thursday).
Eminent issues on the back boiler: FX intervention by the CBRT. Progress (or lack of it) of the government’s new scheme oriented to support the lira via protected time deposits. Constant government pressure on the CBRT vs. bank’s credibility/independence. Bouts of geopolitical concerns. Structural reforms. Presidential/Parliamentary elections in June 23.
USD/TRY key levels
- So far, the pair is gaining 0.13% at 17.9604 and faces the immediate target at 17.9874 (2022 high August 3) seconded by 18.2582 (all-time high December 20) and then 19.00 (round level). On the other hand, a breach of 17.1903 (weekly low July 15) would pave the way for 16.3438 (100-day SMA) and finally 16.0365 (monthly low June 27).
- USD/TRY adds to Monday’s gains near the 18.00 mark.
- The current consolidation remains capped by 18.00.
- The CBRT is expected to keep the current status quo.
The lira depreciates further and motivates USD/TRY to once again challenge the upper end of the current range just below the 18.00 yardstick on Tuesday.

Does it make too much sense?The daily NASDAQ hasn't fallen below the 900d MA since the Great Recession.
Leading up to the Great Recession, there were 2 traps on the NASDAQ (one pushed the 0.38 fib and the other pushed the 0.5). When the second trap hit the 0.5 fib level, the NASDAQ crashed. In other words, it bounced off the 900d twice before capitulation set in. The current market saw the NASDAQ break through the 0.38 level (assuming because of market aggression and the fact that the dollar is inflated) and it reached the intersection of the 100d and 200d MAs earlier this year, and now it's approaching the 0.5 level again.
The economy is chalked.... The economy was saved during COVID via a bubble. Print and hand out money to keep things going (probably necessary). But the Fed didn't react quick enough with the rate increases, especially once everyone realized our "leaders" had no clue what they were talking about related to COVID. So, the bubble grew. Oh, and Ukraine, China, etc....
I have a chart on my page that overlays the inflation rate over time and unemployment rate over time. Every time the inflation rate spiked, unemployment follows on a lag. So, I'm expecting unemployment to increase in the coming months, and this lines up well with the movements described above. I mean, we're already in one, but our government is either that far gone or that stupid... idk which is worse.
So, there are so many things that say the crash is coming, but does it make too much sense?
TVC:NDQ
NASDAQ:NDX
