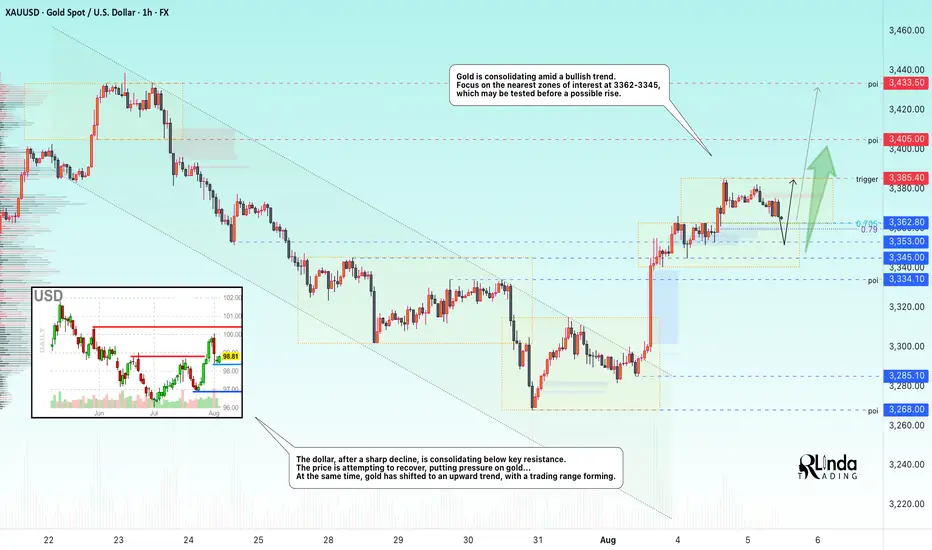
GOLD → Consolidation and correction before growthFX:XAUUSD continues to consolidate after a strong rally. The market is returning to a bullish trend, but a correction is possible before growth continues...
Gold is rising amid expectations of Fed policy easing. The market is finding support amid:
a 90.5% probability of a Fed rate cut in September, weak US employment data, and dovish comments from Fed officials.
The market is waiting for news that could determine further movement. ISM Services PMI data: strong figures could temporarily support the dollar, while weak figures could increase pressure on the USD. Questions about the Fed's independence after Trump fired the head of the BLS. Gold is maintaining its upward momentum, but its dynamics will depend on macro statistics and the Fed's response.
Technically, the focus is on the local trading range of 3385 - 3363 - 3353.
Resistance levels: 3385.4, 3433
Support levels: 3362, 3353, 3345
A retest of support and holding the price above key support could trigger a continuation of the uptrend, but it is important to pay attention to the fundamental background.
Best regards, R. Linda!
Elliott Wave
GOLD → Consolidation after the rally...FX:XAUUSD is not falling back after a strong rally, but is consolidating against resistance at 3362.8. Continued high demand could allow the market to strengthen...
The price of gold halted its two-day rally, trading around $3362.8 on Monday morning after weak US employment data. This heightened concerns about the US economy and increased the likelihood of a Fed rate cut in September to 80%.
Additional pressure on the dollar came from the dismissal of BLS chief Erika McAntfer, which raised suspicions of statistics manipulation. Market attention is also focused on US-Canada trade talks, which could affect investor sentiment. Gold is consolidating for now, but its further growth will depend on the dynamics of the dollar and macroeconomic data.
Resistance levels: 3362.8, 3383, 3433
Support levels: 3345, 3334
As the market has now entered a consolidation phase, MM may form a retest of support before a possible rise in order to accumulate liquidity. However, a breakout of resistance at 3362.8 could trigger further growth.
Best regards, Linda!

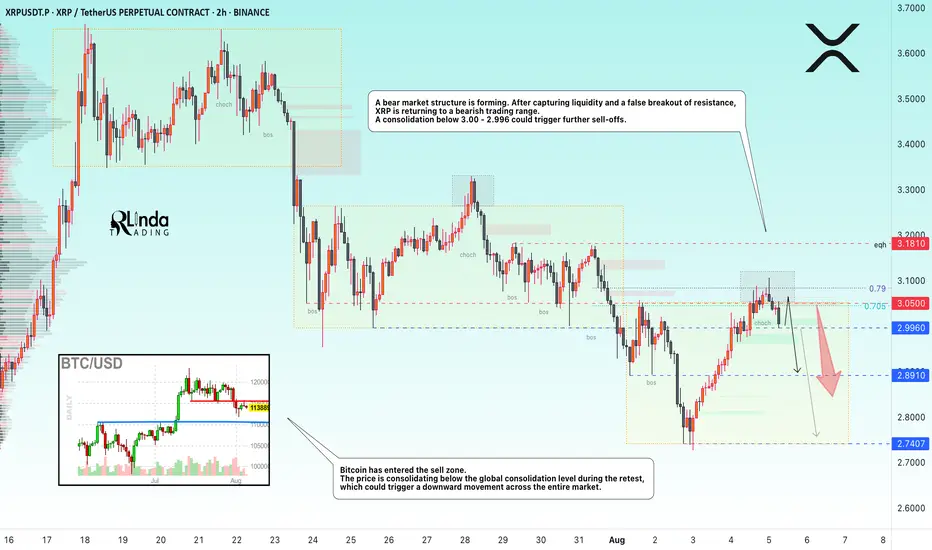
XRPUSDT → Hunting for liquidity ahead of a possible declineBINANCE:XRPUSDT.P is forming a downward market structure after a false breakout of global resistance. Bitcoin is in a correction phase and, after a slight rebound, may continue its movement...
Bitcoin has entered the sell zone. The price is consolidating below the global consolidation boundary of 115,500 during the retest, and if Bitcoin continues to decline, this could trigger a downward movement across the entire cryptocurrency market.
XRP is forming a bearish market structure. After capturing liquidity and a false breakout of resistance, the price is returning to a bearish trading range. There is no potential for continued growth at this time. A consolidation of the price below 3.00 - 2.996 could trigger further sell-offs.
Resistance levels: 2.996, 3.050, 3.181
Support levels: 2.996, 2.891, 2.74
The local bearish structure will be broken if the price starts to rise, breaks 3.050, and consolidates above it. In this case, XRP may test 3.181 before falling further.
At the moment, after a false breakout of resistance, the price is consolidating in the selling zone, and the downward movement may continue. I consider 2.74 - 2.655 to be the zone of interest in the medium term.
Best regards, R. Linda!
Bitcoin Bounces Back — Is $120K the Next Stop?!Bitcoin ( BINANCE:BTCUSDT ) reacted well to the 50_SMA(Daily) and the Heavy Support zone($112,000-$105,800 and started to rise again.
The question is, can Bitcoin reach $120,000 again and even create a new All-Time High(ATH)!?
In terms of Elliott Wave theory , it seems that Bitcoin has managed to complete the main wave 4 in the descending channel . To confirm the end of the main wave 4 , we must wait for the upper line of the descending channel to break. The structure of the main wave 4 is a Zigzag Correction(ABC/5-3-5) .
I expect Bitcoin to trend higher in the coming hours and attack the resistance area and the upper line of the descending channel(First Target: $117,490) .
Do you think Bitcoin's main correction has begun, or does Bitcoin still have a chance to create a new ATH?
Second target: $119,991
Cumulative Long Liquidation Leverage: $113,526-$112,591
Note: Stop Loss: $111,070
Please respect each other's ideas and express them politely if you agree or disagree.
Bitcoin Analyze (BTCUSDT), 2-hour time frame.
Be sure to follow the updated ideas.
Do not forget to put a Stop loss for your positions (For every position you want to open).
Please follow your strategy and updates; this is just my Idea, and I will gladly see your ideas in this post.
Please do not forget the ✅' like '✅ button 🙏😊 & Share it with your friends; thanks, and Trade safe.

Dow Jones Potential DownsidesHey Traders, in today's trading session we are monitoring US30 for a selling opportunity around 44,300 zone, Dow Jones is trading in a downtrend and currently is in a correction phase in which it is approaching the trend at 44,300 support and resistance area.
Trade safe, Joe.

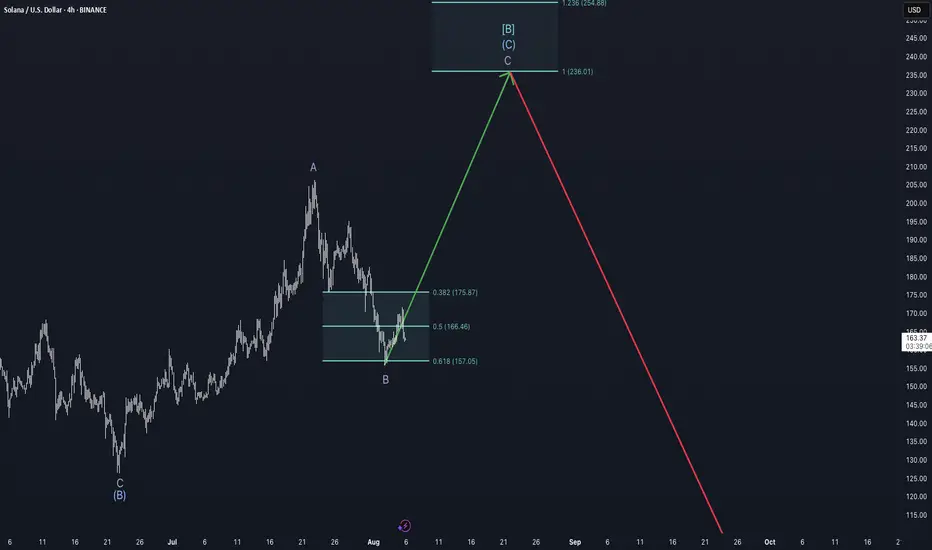
Bulls will be disappointed - Weekly Update August 5-11thSolana appears to be in the final leg of a complex corrective structure. According to the current Elliott Wave count, the larger cycle degree is unfolding in a downward wave c, while the primary degree is in an upward wave B, subdividing into intermediate wave C, which itself is in minor wave C—now developing.
The corrective decline from the July high has retraced toward the 0.618 Fibonacci retracement level (~$157) of the prior move, marking a typical zone for the end of Wave B within a flat or zig-zag formation. From this low, Solana has begun to push higher, indicating the likely beginning of Wave C to the upside. Based on Fibonacci extensions, the potential target zone for this move lies between $236 (1.0 extension) and $254 (1.236 extension).
From a market structure perspective, funding rates across major perpetual futures markets for SOL remain slightly negative or neutral, indicating that the majority of traders are not aggressively long at this stage. This often provides a more stable environment for an upward move, as it suggests the absence of overcrowded long positions that could lead to sharp liquidations. For reference, data from Velo (as of August 5) shows funding on Binance SOLUSDT Perpetual at 6.07%, confirming this neutral-to-slightly-bearish bias in funding.
Additionally, open interest has been neutral since the local low around $157. This is visible on futures data platforms such as Velo.xyz.
However, the liquidity heatmap does not currently support a strong magnet effect toward the $236–$254 zone. There is no significant cluster of stop liquidity or resting orders above $230 that would attract price purely through liquidation mechanics. In contrast, notable liquidity still resides below current levels, making the setup more technically driven than structurally supported by liquidity.
Given these conditions, the case for a C-wave rally remains technically intact, but traders should be cautious: the absence of upper-side liquidity and the corrective macro context imply that this move, even if successful, is likely a countertrend rally within a broader bearish cycle structure.
In conclusion, as long as price holds above the $157–$166 support zone and maintains impulsive structure on lower timeframes, the outlook remains short- to mid-term bullish toward the $236–$254 area. Yet, any breakdown below $157 would invalidate this wave count and suggest that Cycle Wave c may already be resuming to the downside.
Let's learn & Apply Elliott Wave Rules on chart: BTCUSD BitcoinHello Friends,
Welcome to RK_Chaarts,
Friends, Today we are going to learn 3 Rules of the Elliott Wave theory, there are three principles and some patterns. Impulses move in a 1-2-3-4-5 pattern, either as an impulse or a motive wave. However, within impulses, there are three rules:
Rule No 1:
Wave 2 will never retrace more than 100% of Wave 1.
Rule No 2:
Wave 3 will never be the shortest among Waves 1, 3, and 5; it can be the largest, but never the smallest.
Rule No 3:
Wave 4 cannot overlap Wave 1, except in diagonals or triangles; in impulses, it cannot overlap.
We've checked these three rules and marked them with separate tick marks on the chart with different colors, making them clearly visible. You can review the chart and verify these rules yourself, learning how wave principles are applied and checked.
We've explained all this through a drawing on the chart, so we won't elaborate further here. Moving forward, let's analyze what the wave theory suggests about the current market trend. This entire analysis is shared for Educational purposes only.
I hope you'll consider this educational post as a learning resource, Definitely, I encourage you to review the chart as an image or picture to better understand the concepts we've worked hard to explain.
Our effort will be successful if you gain a deeper understanding and learn something new from this post. If you find this helpful and informative, our hard work will have paid off. Please keep this in mind as you review the material.
Now let's explore how wave counts within wave counts, or lower degrees within higher degrees, unfold through complete wave theory patterns and following theory Rules all the times.
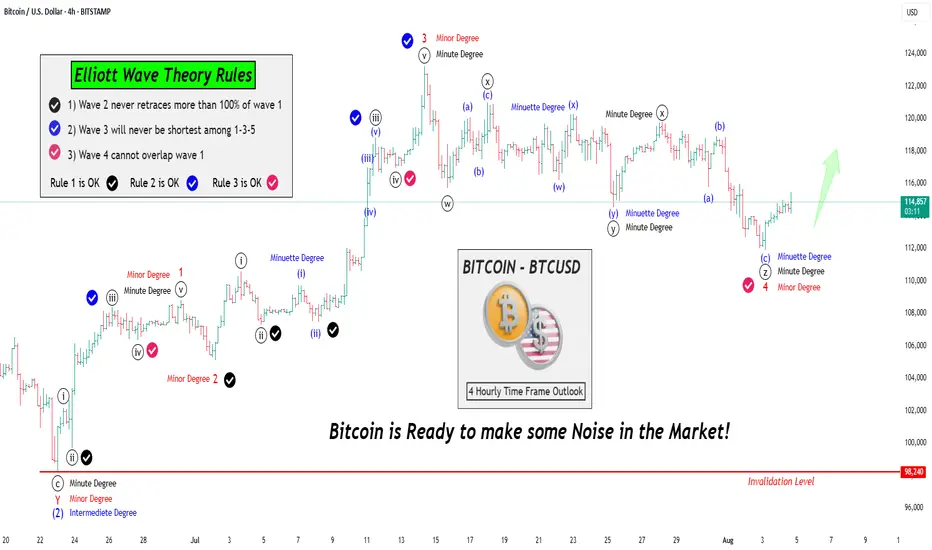
Let's take a closer look at the Bitcoin chart we've analyzed using Elliott Waves. From this perspective, it's clear that the Intermediate Degree Wave (2) concluded around June 23rd.
After this, we observe that the internal wave counts of the lower degree, specifically Wave 1-2-3 (in red) have completed their cycle of Minor degree. Furthermore, Red Wave 4 of same Minor degree has been moving sideways, characterized by a downward trend.
Notably, the fall of Red Wave 4 is classified as a Minor Degree movement. Interestingly, this downward movement appears to have terminated in an even lower degree, namely the Minute Degree, which we've marked in black as ((w))-((x))-((y))-((xx))-((z)) that means Wave 4 of Minor degree (in Red) is complete.
Given that Red Wave 4 Minor has reached its conclusion, it's highly plausible that Wave 5 has initiated. This development suggests that Bitcoin is poised to make a significant move.
Moving on to the analysis, we observe that:
- Rule 1: Wave 2 has not retraced more than 100% of Wave 1, so this rule is intact.
- Rule 2: Wave 3 is not the shortest among Waves 1, 3, and 5, so this rule is also valid.
- Rule 3: Wave 4 does not overlap Wave 1, so this rule is also satisfied.
Bitcoin is all set to shake things up! We eagerly anticipate further rallies in the market.
This post is shared purely for educational purpose & it’s Not a trading advice.
I am not Sebi registered analyst.
My studies are for educational purpose only.
Please Consult your financial advisor before trading or investing.
I am not responsible for any kinds of your profits and your losses.
Most investors treat trading as a hobby because they have a full-time job doing something else.
However, If you treat trading like a business, it will pay you like a business.
If you treat like a hobby, hobbies don't pay, they cost you...!
Hope this post is helpful to community
Thanks
RK💕
Disclaimer and Risk Warning.
The analysis and discussion provided on in.tradingview.com is intended for educational purposes only and should not be relied upon for trading decisions. RK_Chaarts is not an investment adviser and the information provided here should not be taken as professional investment advice. Before buying or selling any investments, securities, or precious metals, it is recommended that you conduct your own due diligence. RK_Chaarts does not share in your profits and will not take responsibility for any losses you may incur. So Please Consult your financial advisor before trading or investing.
Elliott Wave Science: Bitcoin Steadily Chases $400KAfter some back and forth, I have located the needed confirmations to find high confidence that Bitcoin stretches toward the $400K mark by September-December 2026. I will continue to track the waves day by day, week by week, while applying the unbiased science of Elliott Wave Theory.

AUDUSD Breakout and Potential RetraceHey Traders, in today's trading session we are monitoring AUDUSD for a buying opportunity around 0.64700 zone, AUDUSD was trading in a downtrend and successfully managed to break it out. Currently is in a correction phase in which it is approaching the retrace area at 0.64700 support and resistance zone.
Trade safe, Joe.

MTF 2nd bearish macro outlook on Eth, final wave of (Y) coming?This is an idea I've had for a while (unpublished) but looking at local structure, I have to revive this..
It's a very rare expanding triangle idea as the Y wave of the macro WXY wave.
The December 2024 high took out the March 2024 high. And, it's not uncommon, especially in crypto, for B/W wave to take out the previous high (i.e. overshoot). But, considering that the pink a-b-c-d-e's April 2024 low (c) hit the exact 1.618 extension, and the high likelihood of (d) about to hit 4k+ and overshoot the December high of 2024, there is a likelihood that you're seeing an expanding triangle play out.
If you see a rejection at previous December 2024 high (i.e. a swing failure pattern), you must entertain the idea of expanding triangle at the very least.
The unfortunate part is, if this is true, the (e) wave has a huge range, from ~$1400 to $700. The minimum requirement of (e) is to take out the (c) low but can extend to 1.618 at $700.
Will have to see the local structure playout once we get close to (c) or below.
More evidence for expanding triangle is the volume and the open-interest. From March 2024, volume has been steadily increasing (not visible on Bitstamp chart here, but go look at Binance Ethereum chart, for example) and open-interest has been increasing since March 2024, all the while price has kept peaking at ~$4k. For bulls, this should be very concerning as it means the kettle's been boiling hotter and hotter and the pressure's been building up - and long-to-short ratio is still very much positive. A swing failure pattern at (d) and with late longs entering in the market at the peak, it's possible a cascade of liquidation could result in a quick move down to (e).

Nasdaq and S&P500 Short: A multi-factor analysisIn this long video, I go through why I think the equity markets are going to crash in August.
Here are the important points:
1. I talk about the stealth liquidity which is the reverse repo balance being drawn down and almost emptied.
2. The risk-off asset classes rising: Gold, Japanese Yen.
3. The risk-on asset classes falling: Nasdaq, Bitcoin, Ethereum.
Here's my outlook for the markets from now till September FOMC:
1. The equity markets, USDJPY, Bitcoin, and Ethereum will crash.
2. 3-month treasury yield will fall below 4.25% and even below 4%.
3. Fed will cut target rates to be within the 3-month treasury yield.
As usual, good luck in your trading and keep your risks tight!

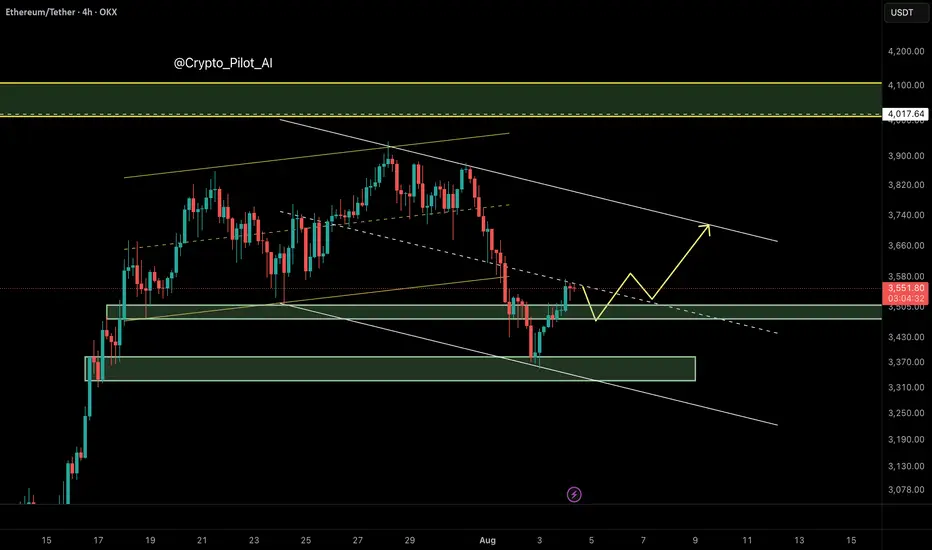
Ethereum (ETH/USDT) – Bearish Channel Structure Developing
⸻
🔍 Technical Overview
Ethereum has broken down from its ascending channel, invalidating the earlier bullish projection toward $4,000. After failing to hold the channel midline around $3,577, price dropped sharply to $3,360, forming a new bearish descending channel.
Currently, ETH is trading near the midline of this bearish channel, which typically acts as a decision point — not a buying zone — in smart money models.
⸻
🧠 NEoWave Interpretation
We may be inside a Complex Corrective Wave, possibly a Running or Contracting Flat evolving after the March top. The current structure resembles a B-wave trap, where price fakes out the upside before shifting momentum sharply downward. The break below the ascending channel midline confirms this bearish shift.
⸻
📊 Smart Money Summary
• 🟥 BOS confirmed on 1H and 4H (lower highs and lower lows)
• 🔻 Midline failure acted as a smart money trap, followed by a liquidity sweep below $3,490
• 📦 Bullish Order Block around $3,490–$3,520 has been tapped, prompting a minor reaction
• 🟡 Current resistance sits near the channel top ~ $3,715
⸻
🎯 Trade Scenarios
📌 Bearish Continuation:
If price fails to reclaim above $3,715, a retest and rejection from the channel top could trigger continuation toward $3,300–$3,250.
📌 Bullish Reversal (less likely for now):
Only a clean break and hold above $3,720 would suggest that bulls are regaining control, opening path toward $3,900–$4,000 — though this scenario is weakened after structural damage.
⸻
⚠️ Trader Tip:
Avoid buying into midline reactions in weak channels. Better long setups form after stop-hunts, ideally near bullish OBs + internal BOS confirmations.
⸻
✅ Conclusion
Ethereum remains under bearish pressure after losing its ascending structure. Unless price reclaims the $3,715 resistance zone with momentum, downside continuation remains likely.
⸻
📌 Save this analysis
💬 Share your thoughts or alt wave counts in the comments.
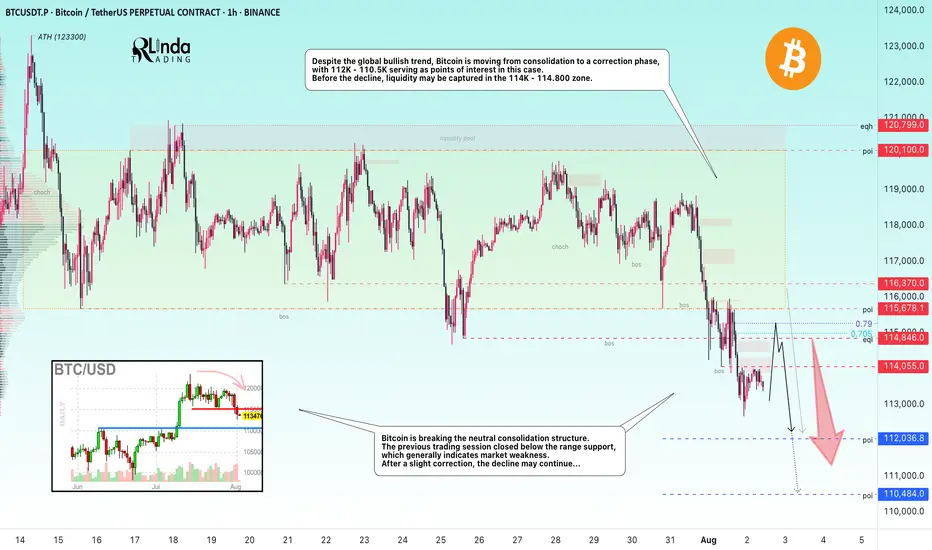
BITCOIN → From consolidation to distribution. Market weaknessBINANCE:BTCUSDT.P is moving from consolidation to a correction phase. The price broke through the support zone of 114.5–115.5, closing within the Friday trading session in the sell zone...
Previous idea from July 22: BITCOIN → Consolidation and compression to 116K. Correction?
The fundamental background is shifting to neutral, the hype has temporarily ended, and there are no bullish drivers yet. And for the health of the market, a correction is needed. Bitcoin is breaking the neutral consolidation structure. The previous trading session closed below the support range, which generally indicates market weakness. Despite the global bullish trend, Bitcoin is moving from consolidation to a correction phase, with 112K - 110.5K serving as points of interest in this case. Before the fall, liquidity may be captured in the 114K - 114.800 zone.
Resistance levels: 114.05, 114.85, 115.67
Support levels: 112.03, 110.48
After a strong movement, the market may enter a correction or local consolidation, during which it may test the specified resistance zones before continuing its downward movement to the zone of interest and liquidity at 112 - 110.5.
Best regards, R. Linda!
XAU/USD – Bearish Momentum Building: Circle 2 Top In?OANDA:XAUUSD
We have now completed a 1-2-3-4-5 structure to the downside (in white).
Following that, we got a counter-correction in the form of an A-B-C, which potentially marks the completion of our yellow (Circle) Wave 2 🟡.
However, it’s not confirmed just yet — we still have two additional Fibonacci levels at 3400 and 3418, which could act as resistance zones and final topping areas for Circle 2.
We are now anticipating a 1-2-3-4-5 impulse into Circle 3, as already illustrated in yellow 🟡.
So at the moment, bias remains bearish 🔻.
Should we break above the Fibonacci levels mentioned, I do have an alternative scenario in mind — an ABCDE triangle formation that may have developed over the past months.
If that becomes relevant, I’ll make a separate upload for it 📌.
For now, I'm actively looking for sell positions, and I’ve already entered shorts ✅.

2009-2025 Elliott Wave: BitcoinBitcoin is a decentralized digital currency, without a central bank or single administrator, that can be sent from user to user on the peer-to-peer bitcoin network without the need for intermediaries. Transactions are verified by network nodes through cryptography and recorded in a public distributed ledger called a blockchain. The cryptocurrency was invented in 2008 by an unknown person or group of people using the name Satoshi Nakamoto. The currency began use in 2009 when its implementation was released as open-source software.

Crude Oil Resumes Its WeaknessCrude oil rised and then fell sharply from above 78 dollars back in June, after tensions in the Middle East. The drop unfolded as an impulse into wave A, so even if this is just a counter-trend move down from 78, it still appears incomplete. After we recently spotted a corrective rally in wave B that nicely stopped at projected $70 resistance near 61,8% Fibo. retracement, we can now see it resuming lower within projected wave C towards 60-59 area at least, if not even lower.

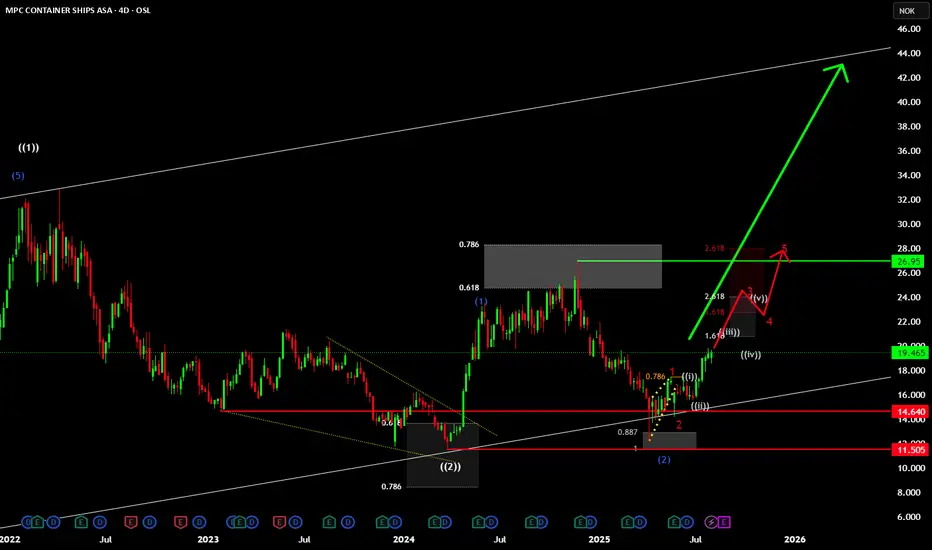
MPCC - updateMPCC has also seen quite a rise of the share price and currently I´m convinced that this is not the end of the road and price will at least rich the upper channel line over the next years to complete the wave 3 (white count).
Currently, a leading diagonal started the rally and we have seen two 1-2 setups which is a very bullish sign. I´m looking for the price to take out the high indicated by the green line before it will need to pull back again. This pullback in the future will give us the chance to stock up on this company shares.
Hoegh Autoliner - updateThe development has been nothing short of being great since my last update on this Norwegian stock. The price fell more than I anticipated but nevertheless it followed my overall plan.
I remain extremely bullish on this company but it´s too early to give more precise price targets.
As of now we can assume that we will see price reach the 161% Fibonacci extension projected of the red 1-2 setup seen in the chart. This move will have several set-backs which I´m looking to use for additional buys.
Looks like the future is bright for the company ... as of now at least!

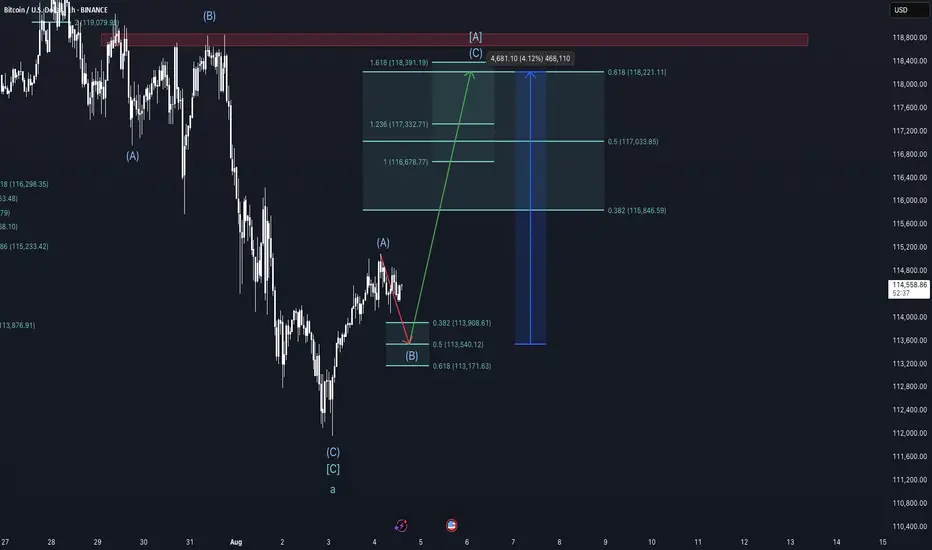
Bear trap on its way - Bitcoin Weekly Update August 4-10thThis week brings a series of macroeconomic and geopolitical developments that may influence global risk sentiment and, consequently, Bitcoin’s price trajectory.
On Monday, the U.S. releases Factory Orders, a key indicator of industrial demand. Surprises in this data can affect risk assets broadly, as they reflect business investment activity. Weak numbers would likely increase expectations of monetary easing, which tends to support Bitcoin.
On Tuesday, the spotlight turns to the ISM Non-Manufacturing PMI, a leading indicator for the U.S. services sector, which accounts for roughly 70% of GDP. A significant deviation from expectations—especially a decline—could reinforce rate-cut expectations and provide tailwinds for speculative assets like Bitcoin.
Thursday is a critical day, with the Bank of England's interest rate decision in focus. While direct effects on crypto are limited, a hawkish stance could weigh on global risk appetite if inflation concerns resurface. Also on Thursday, the U.S. releases its weekly Initial Jobless Claims—a timely barometer of labor market strength. A rising trend here would suggest economic cooling, strengthening the case for looser policy and potentially benefiting crypto.
However, the most geopolitically sensitive event this week is the reintroduction of country-specific reciprocal tariffs by the United States, taking effect on August 7. Affected countries include Canada (35%), Mexico (30%), and Brazil (50%). These measures could re-escalate trade tensions and trigger short-term market volatility. Retaliatory responses from these countries would likely fuel risk-off sentiment, pressuring assets across the board.
From a technical standpoint, Bitcoin remains within a multi-degree corrective structure according to the Elliott Wave framework. On the cycle degree, we are in a B-wave; on the primary degree, in an A-wave; on the intermediate degree, in a B-wave; and on the minor degree, in a C-wave. This implies that a short-term move lower is still expected, but once complete, a relief rally of approximately 4% could follow before the onset of a larger correction, likely Primary Wave B.
Chart structure suggests that Minor Wave C is in its late stages. Early signs of exhaustion, such as waning downside momentum or bullish reaction at key support zones, could offer clues of an approaching bottom. However, such a rebound should be viewed as temporary and not a trend reversal.
Taking a view between the lines on the on-chain data, the liquidity heatmap shows major liquidity around the red rectangle drawn into the chart, suggesting higher prices. Also, the rather low funding rate on futures suggest an exhausted downward trend and a trend reversal in the near future is likely.
Conclusion:
This week’s calendar offers several macroeconomic catalysts with the potential to move markets. U.S. economic data and tariff policy developments will likely shape near-term sentiment. Technically, Bitcoin remains in a corrective phase with limited downside left before a short-term recovery becomes more probable. Traders should stay alert for signs of a local bottom to position for a tactical bounce—but be cautious, as a larger correction likely looms beyond that.
This is no financial advice and for educational purposes only.
GOLD (XAUUSD) Wave analysis -Update 5/8/2025 GOLD (XAUUSD) Wave analysis -Update 5/8/2025
See the chart

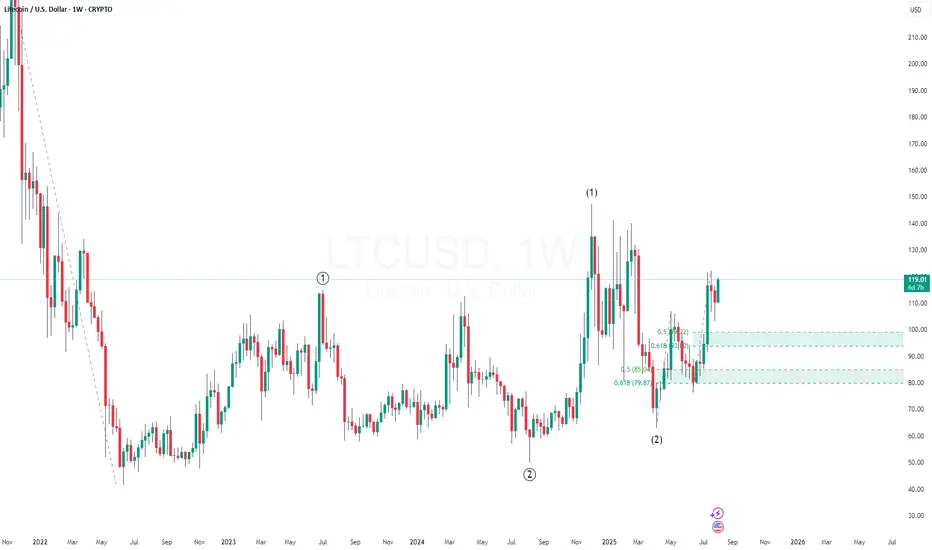
LTC Could Be Gearing Up for a Massive Wave 3 post 1-2, 1-2 Litecoin (LTC) appears to have completed a 1-2, 1-2 wave pattern, a classic bullish setup in Elliott Wave theory that often precedes an explosive move.
This nested formation signals strong internal momentum, where both the higher and lower degree structures are aligned for upside. If the count holds, LTC is now positioned to launch into Wave 3 of the larger Wave 3 — typically the most powerful and extended rally in the entire wave cycle.
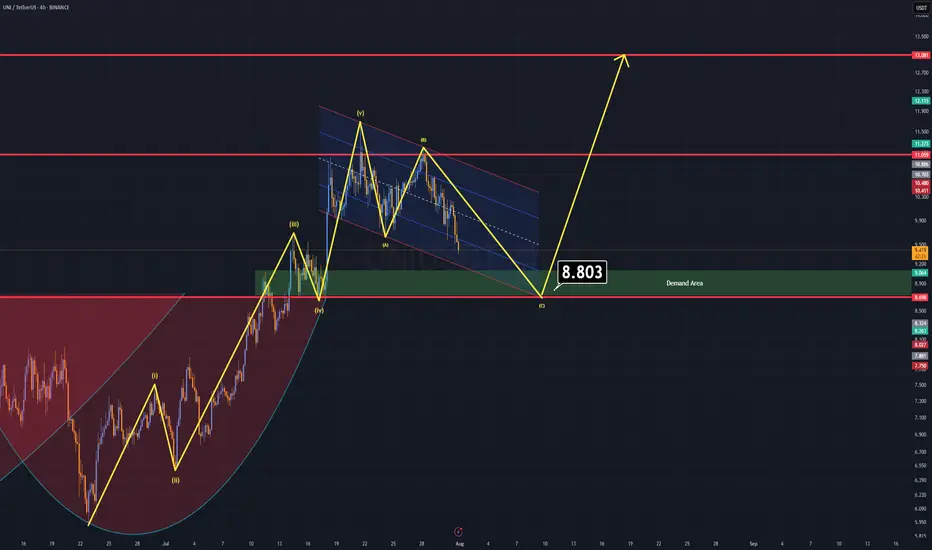
UNI Analysis (4H)UNI – Correction Might Bring Opportunity
Currently, UNI is forming an A–B–C corrective pattern, and based on technical structure, this correction may complete around the $8.8 level.
Key Zone to Watch: $9.0 – $8.5
There's a strong demand zone just below $9, supported by historical price action.
On the daily time frame, a broken cup & handle formation aligns perfectly with this area — the old neckline may now act as support, increasing the confluence.
This overlap of structure and demand makes the $9–$8.5 zone a favorable entry for a long position.
Once price reaches this area, expect a significant upward correction as part of the next move in the cycle.
Good Luck.
BTC - 1H Elliott Wave AnalysisWelcome back to another Elliott Wave Analysis for Bitcoin! :)
In this analysis we want to focus on the short term. We have been in a correction displayed as pink ABC and it seems that this correction is coming or has come to an end in the pink Wave C.
It is hard to say if the pink Wave C has finished yet. The last low at 111'850 USD is the 1 to 1 ratio of the pink Wave A to the pink Wave C which is a common target for Wave C.
Looking at the sub-count in white we think another low in white Wave 5 would look cleaner but it is not given to happen.
For now we added the white Wave 4 resistance of which we touched the 0.5 FIB retracement at 115'830 USD which is a rather deep but valid Wave 4. We also added the 0.618 FIB at 116'213 USD which would be the invalidation for the white Wave 4. If we hit it the probabilities shift to the case that the low at 111'850 USD is already the end of pink Wave C.
If we get white Wave 5 the first target would be at the 1 to 1 FIB at 111'319 USD which is right below the last ATH of which we bounced recently but that seems a bit shallow.
The next target would be at around 109'700 USD where we got some confluence between the 1.38 FIB target for white Wave 5 measured with the white Wave 1 as well as the 1.618 FIB target if we measure of the white Wave 4. It is also close to the 0.5 FIB of a bigger support area.
Be aware that the bigger support area below goes down to 103'000 USD which is the 0.786 FIB of the support area.
Due it looking likely that pink Wave C is finished we also added the support area for the potential Wave 2 in the bullish scenario.
It is between the 0.5 FIB at 113'640 USD and the 0.786 FIB at 112'616 USD. From this area we would like to see a bounce if the low is already in.
Thanks for reading.
We would appreciate a follow and boost if you like the analysis! :)
NO FINANCIAL ADVICE.
