Elliott Wave

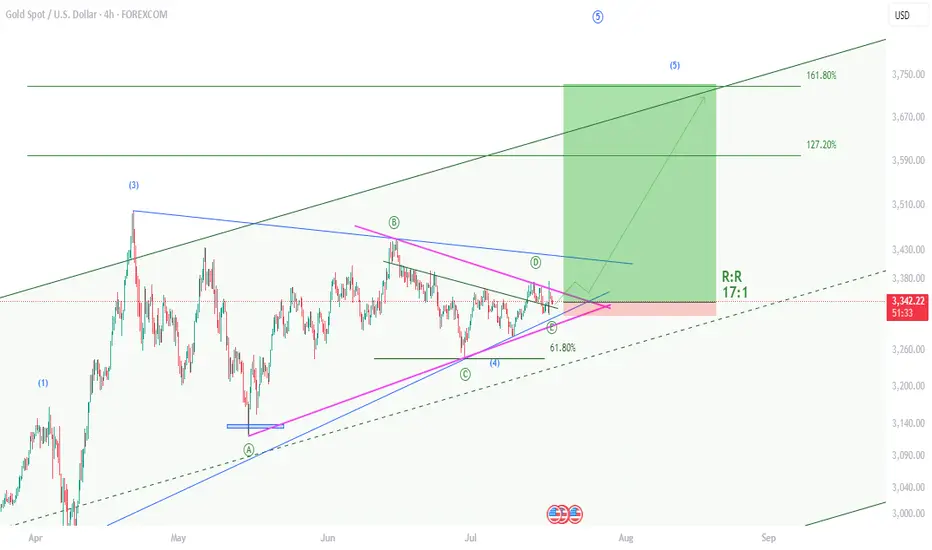
XAUUSD , Bullish Setup , R:R 17Hello friends
I am back after a long time and I want to share the results of my efforts of several years with you.
Gold is starting a 5th wave of bullishness and yesterday it gave us the necessary confirmations by rejecting the previous ceiling. I have identified the best buying position for you now. With a reward to risk 17
Take advantage of this opportunity.
If you are interested in Elliott waves or work in this field at a professional level, contact me and share your analysis with me.
I hope we will all be profitable together.
Elliott Wave View: XAUUSD (Gold) Should Continue RallyElliott Wave sequence in XAUUSD (GOLD) suggest bullish view against September-2022 low in weekly. In daily, it should remain supported in 3, 7 or 11 swings to continue rally to extend higher. In daily, it ended ((4)) correction in 7 swings sequence at 3120.20 low in 5.15.2025 low against April-2025 peak. Above May-2025 low, it should continue rally targeting 3589 or higher levels, while pullback stays above 3246.55 low. In 4-hour, it placed 1 at 3452.5 low in proposed diagonal sequence. Within 1, it ended ((i)) at 3252.05 high, ((ii)) at 3245.20 low, ((iii)) at 3365.93 high, ((iv)) at 3245.20 low & finally ((v)) ended at 3452.50 high. It ended 2 in 7 swings correction at 3246.55 low in 6.29.2025. Within 2 pullback, it ended ((w)) at 3340.18 low, ((x)) at 3398.35 high & ((y)) at 3246.55 low in extreme area. It provided short term buying opportunity in extreme area, corrected 0.618 Fibonacci retracement of 1.
Above 2 low, it is showing nest in 1-hour sequence expecting further rally. It needs to break above 6.15.2025 high of 3452.5 to confirm the upside to extend daily sequence. Short term, it placed ((i)) of 3 at 3365.70 high, ((ii)) at 3282.43 low, (i) of ((iii)) at 3374.96 high & (ii) of ((iii)) at 3319.50 low. It is showing higher high since 2 low in 5 swings, which can be nest or a diagonal sequence, if breaks below 7.09.2025 low before rally higher above 6.29.2025 low. In (i), it ended i at 3330.32 high, ii at 3309.91 low, iii at 3374.02 high, iv at 3353.43 low & v at 3374.96 high. In (ii) pullback, it placed a at 3340.76 low, b at 3366.38 high & c as diagonal at 3319.50 low. It already broke above (i) high, confirmed upside can be possible as long as it stays above 3319.50 low.
Currently, it favors pullback in ii of (iii), while placed i at 3377.48 high. It expects pullback in 3 swings to hold above 3319.50 low before rally continue in iii of (iii). The further upside confirms when it breaks above 3452.50 high. Five swings rally from 6.29.2025 low, suggests more upside should be unfold. The next leg higher expects to erase the momentum divergence in 1-hour to be (iii) of ((iii)). Alternatively, if it breaks below 7.09.2025 low, it can be pullback against 6.29.2025 low, while ended ((i)) in diagonal at 3377.48 high. Gold is choppy after April-2025 peak. It can even do double correction, if breaks below 6.29.2025 low, correcting against May-2025 low before rally continue. We like to buy the pullback in 3, 7, or 11 swings pullback as it is bullish in weekly sequence.

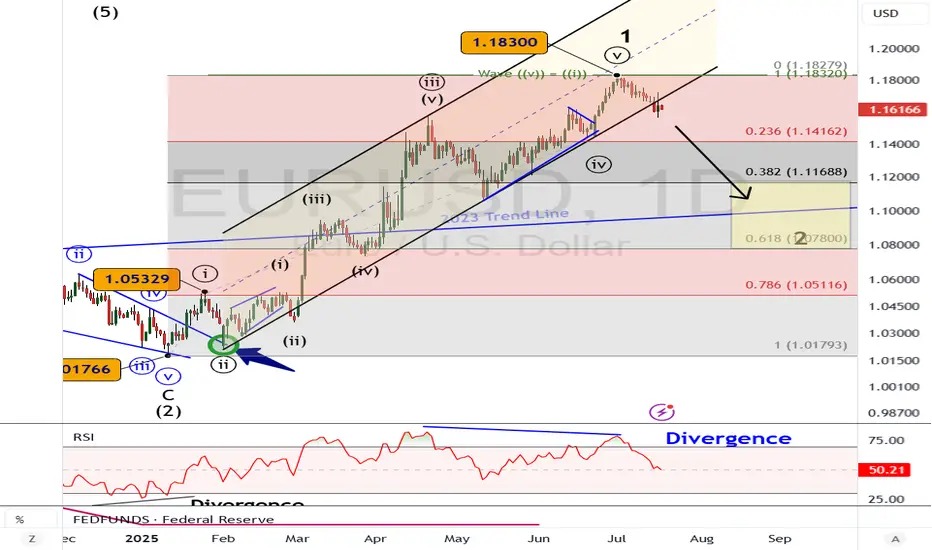
EURUSD Elliott Wave: Top in PlaceExecutive Summary
Wave 1 rally from January 2025 to July 2025 appears complete
Decline to 1.1170 and possibly 1.08 in wave 2.
The support shelf near 1.1170 may contain the decline.
We now have enough evidence in place to consider a medium-term (or longer) top in place for EURUSD.
The weekly chart above shows a rally from the January 2025 low that reached the upper parallel at the July high. This rally appears to be complete and a sideways to lower consolidation is likely underway.
On January 24, we forecasted a rally with a second target of 1.18. EURUSD reached the target topping at 1.1830.
Now, it’s time to flip the scrip as a correction is likely underway to correct that strong rally.
The 6-month rally in EURUSD appears to have ended this month and a correction is likely underway to 1.1170 and possibly lower levels.
The top of EURUSD on July 1 is labeled as wave 1. The decline underway appears incomplete and would be wave 2.
Within the wave 1, wave ((v)) measures equal to wave ((i)) at 1.1832, just a couple of pips within the actual high. Additionally, there is RSI divergence within the wave ((v)) and wave ((iii)) highs. This is a common pattern within a fifth wave of an Elliott wave impulse pattern.
The next trend (lower) will likely carry to below 1.1170.
Near this level is the 38% Fibonacci retracement level of the 6-month rally. Additionally, there is a support shelf of broken resistance and congestion appearing between 1.1033 - 1.1275.
At the lower end of that price zone is a broken trend line dating back to 2023. Therefore, this price zone will offer up a strong level of support that may launch the next rally or at least a small bounce.
BOTTOM LINE
The Elliott wave impulse pattern from January to July 2025 appears over. A downward correction appears to have begun and may visit 1.1170 and possibly lower levels.
As the downward trend takes hold, we’ll review its structure to determine where we are at within the larger wave sequence.
#Banknifty directions and levels for July 17thIn the previous session, both Nifty and Bank Nifty moved with ups and downs. Structurally, the sentiment still remains the same.
Even if the market opens with a gap-up, we can expect some rejection near immediate resistance.
So, my expectation is that the market may behave similarly to the previous session.
If it starts with a pullback, we may see rejection afterward.
On the other hand, if it starts with a decline, we can expect a pullback later.
The key point to note is that clear directional moves are likely only if a strong candle forms after consolidation.

#Nifty directions and levels for July 17thGood morning, Friends! 🌞
Here are the market directions and levels for July 17th:
There have been no major changes in the global market; it continues to maintain a moderately bearish sentiment.
Meanwhile, our local market is showing a moderately bullish tone on the lower time frame. Today, Gift Nifty is indicating a neutral to slightly gap-up start.
So, what can we expect today?
In the previous session, both Nifty and Bank Nifty moved with ups and downs. Structurally, the sentiment still remains the same.
Even if the market opens with a gap-up, we can expect some rejection near immediate resistance.
So, my expectation is that the market may behave similarly to the previous session.
If it starts with a pullback, we may see rejection afterward.
On the other hand, if it starts with a decline, we can expect a pullback later.
The key point to note is that clear directional moves are likely only if a strong candle forms after consolidation.

FLOKI Isn’t Missing the Party🚀 CRYPTO:FLOKIUSD Price has broken above the May peak, confirming a bullish continuation. With momentum building, price is now eyeing the next upside target near $0.00018.
#elliottwave #memecoins #altseason

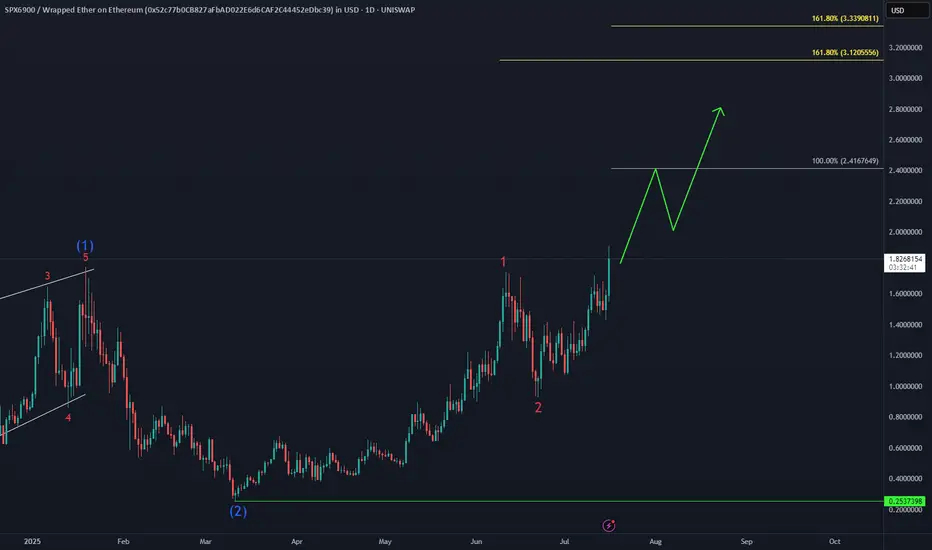
#SPX6900 Bullish SequenceThe Gate Is Open – Send It 🚀🚀🚀
UNISWAP:SPXWETH_52C77B.USD just smashed into a new all-time high, unlocking the next bullish targets at $2.4 and $3.1.
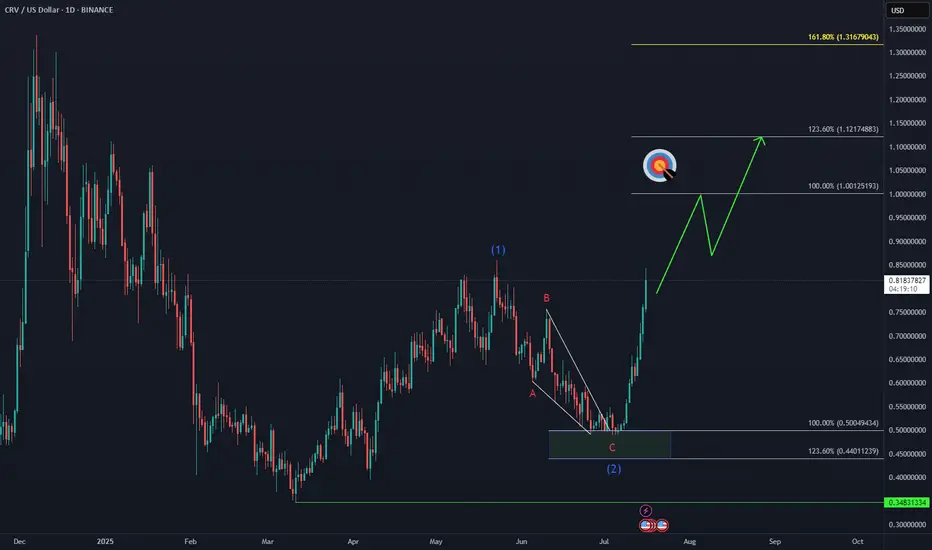
CRV Marching Toward Target📈 CRYPTO:CRVUSD is approaching a key breakout level, with bulls aiming to surpass the May peak and reach the $1.00 initial target.
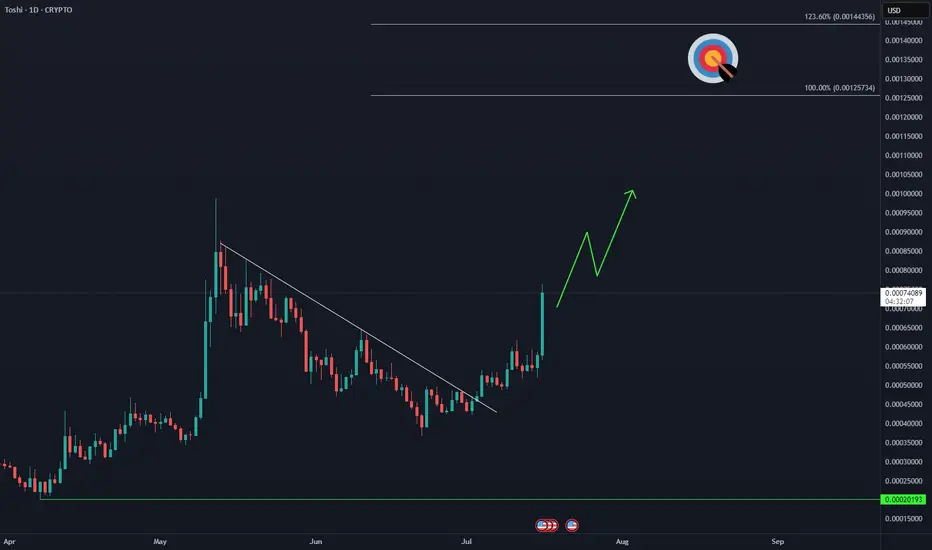
TOSHI Bulls on the Move🚀 COINBASE:TOSHIUSD is showing signs of acceleration, aiming to break above the May peak and extend toward the $0.0012 target zone.
[$CLSK] CleanSpark Inc. - Farming [$BTC] LongNASDAQ:CLSK
no finanical advice
📑market outlook
+ Fed rate cut priced in --> short term risk-on environment
+ total FIAT-debasement in motion --> Precious &Crypto are poomping
- geo-political risk can drag down the 'weaker ANTI-Fiat' risk-on positions
💡idea
we want to farm BTC indirectly by selling covered-calls /placing cash secured puts
🧪approach
derivatives options with i.e. 0.1 BTC ~ 10,000 USD
🏁target
get 2% yield per month
⚠️ caution
Only weekly options: --> Crypto Cycle could take hits of -50% which would basically demolish your position
--> check weekly volume/sentiment on BTC
Don't forget:
⏳ Theta is our alley. Always have been!

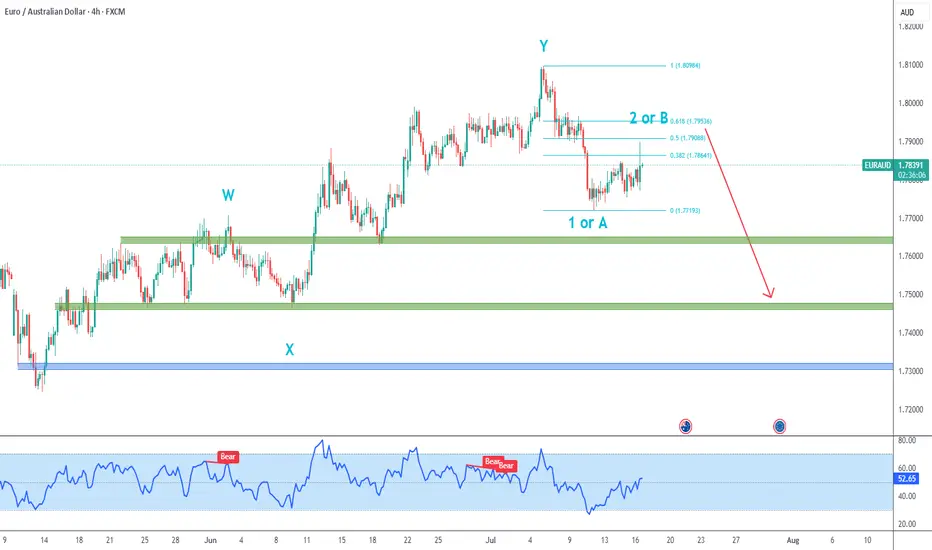
CADJPY Short-Term UpsideIn the bigger picture, the pair is currently inside black wave 2 or B, which is happening as a flat correction (blue ABC).
We should still have some upside in the short term.
The gray area is an interesting zone to begin looking for short trades.

#btc #btcusd #elliottwave short sell setup wave 4 16Jul24This count is based on my assumptions so anything can happen not a trading or financial advice just for educational purposes only kindly do your own ta thanks trade with care good luck.

EURAUD 4H Chart DownsideI expect further downside for EURAUD.
Ideally, I´d prefer the current upside correction to reach 50% pullback (at 1.79088).
Intermediate targets are the green zones which served as resistance & support levels during the uptrend, and final target is the blue zone close to the May pivot low.
Coffee smells goodAnother day, another breakout trade. I went long at the 0.5 retracement, we’ve had a nice reaction so far. Stop loss under the 0.5 Fibonacci. I expect coffee to reach a new high. There’s plenty of commodities that look strong vs the dollar, coffee has lagged for weeks now but if you zoom out there’s signs we can put in a new high.
Not financial advice. Do what’s best for you.

Bitcoin - Will hit 135k in the short-term, Elliott and FIBOBitcoin is rising! That's what everyone sees at the moment, but we don't want to get drunk and establish our profit target. Where to take profit? Because we are in the price discovery mode, there is no previous price action above the current price. At this moment we really cannot use any horizontal lines, gaps, volume profiles, imbalances, previous ranges, or previous swing highs to establish our profit target. So we have to use special tools, such as Fibonacci extension or Elliott Wave.
The Fibonacci extension is a great tool - in bitcoin's case we have a 1:1 FIB extension sitting at 135,096. This level is also in confluence with a major trendline that we can see on the chart. This gives us a really good profit target in the short term for this particular trade. This is also an opportunity to short Bitcoin here, if you trade futures. From the Elliott Wave perspective, we are in wave (3), so I made a prediction on where this wave should terminate and also where wave (5) should terminate. I think my analysis definitely makes sense! Please share your analysis in the comment section, only copy your link here.
Trading tip at the end: Avoid the Obvious / Market Traps - Some obvious trading situations are kind of a trap where the chances are that everyone else has also spotted a wonderful trade situation which eventually sets you up for a disaster. Many people get trapped in some obvious good looking trades. Some obvious trades can sometimes be the market traps as they are hyped, professional traders stay away from these traps. Write a comment with your altcoin + hit the like button, and I will make an analysis for you in response. Trading is not hard if you have a good coach! This is not a trade setup, as there is no stop-loss or profit target. I share my trades privately. Thank you, and I wish you successful trades!

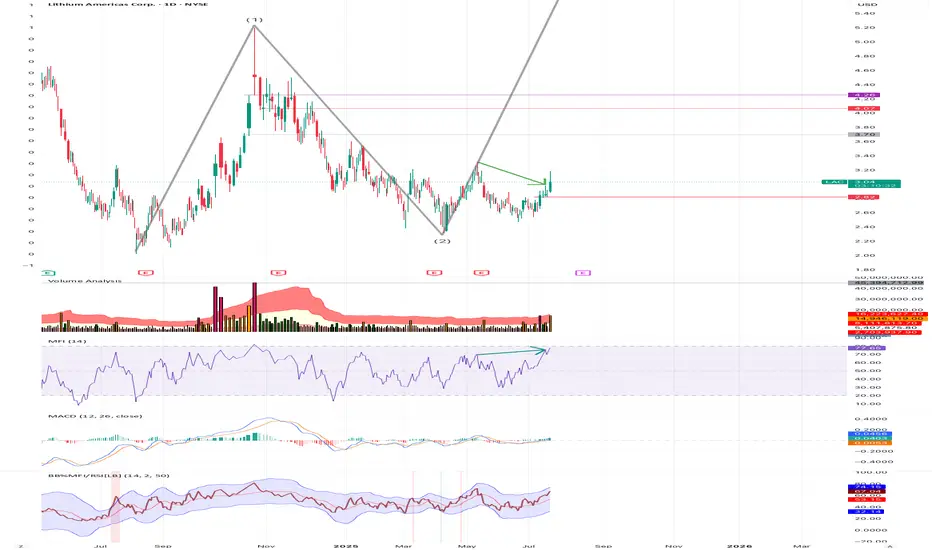
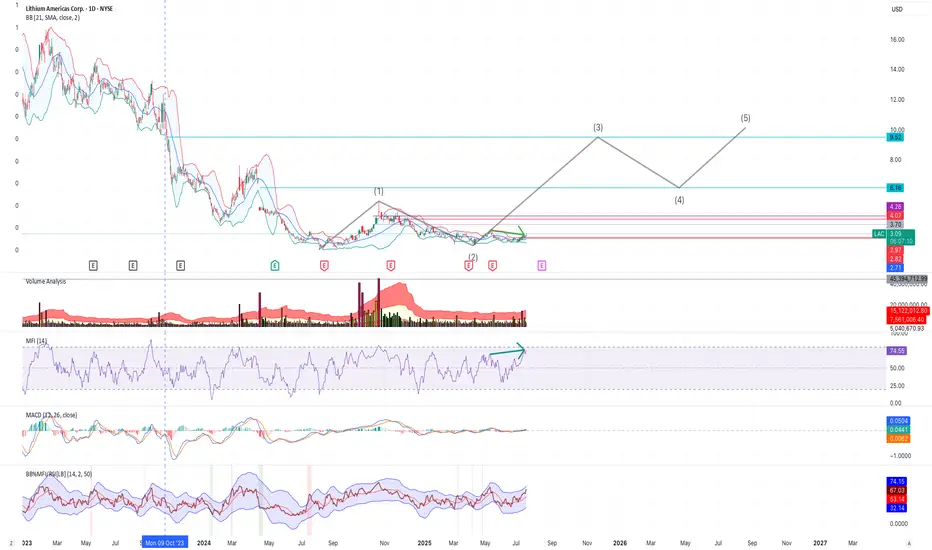
$LAC up from here: support, elliot wave, price actionI believe LAC may have begun its 3rd elliot wave, with a bottom at $2.33. There also appears to be nice recent strong base support around $2.80. In addition, there appears to be a deviation between price and money flow, as shown with the green arrows - with a potential correction available to push price beyond $3.30 very soon.
I have entered and will watch its daily action and volume with an upside expectation limit around $9-10, then a 4th wave down, etc. Of course, I am not a financial advisor and I have been wrong before and will be wrong again. I trade within this reality and control my risk.
Gold Roadmap: Next Stop $3,325 After Ascending Channel Break?Gold ( OANDA:XAUUSD ) failed to touch the Potential Reversal Zone(PRZ) in the previous idea , and I took the position at $3,351 = Risk-free.
Gold is moving in the Resistance zone($3,366-$3,394) and has managed to break the lower line of the ascending channel .
In terms of Elliott Wave theory , with the break of the lower line of the ascending channel, it seems that gold has completed the Zigzag correction(ABC/5-3-5) .
I expect Gold to trend downward in the coming hours and succeed in breaking the Support zone($3,350-$3,325) and attacking the Support line again , and probably succeeding in breaking this line this time.
Note: Stop Loss (SL) = $3,396
Gold Analyze (XAUUSD), 1-hour time frame.
Be sure to follow the updated ideas.
Do not forget to put a Stop loss for your positions (For every position you want to open).
Please follow your strategy; this is just my idea, and I will gladly see your ideas in this post.
Please do not forget the ✅ ' like ' ✅ button 🙏😊 & Share it with your friends; thanks, and Trade safe.

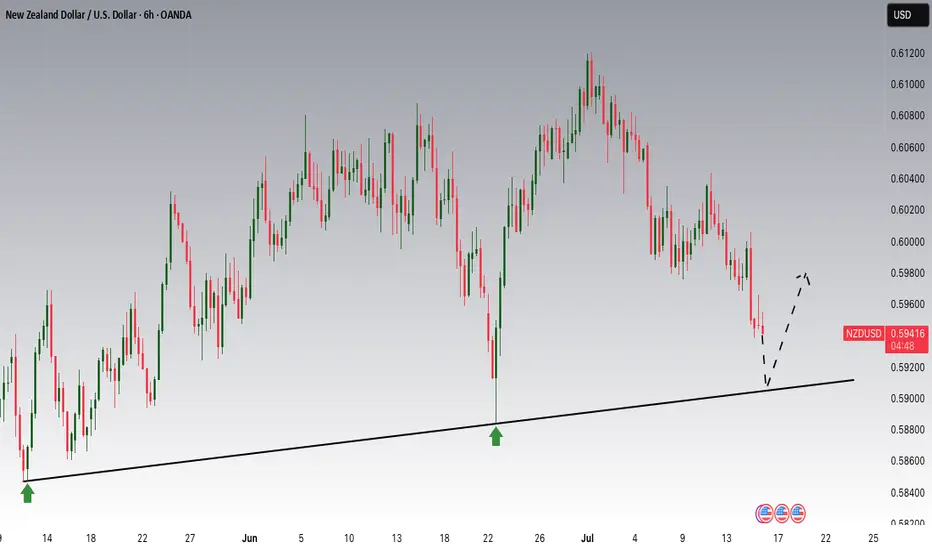
NZDUSD is Nearing an Important SupportHey Traders, in today's trading session we are monitoring NZDUSD for a buying opportunity around 0.59100 zone, NZDUSD is trading in an uptrend and currently is in a correction phase in which it is approaching the trend at 0.59100 support and resistance area.
Trade safe, Joe.
The 3rd Nevada Lithium Elliot WaveI believe LAC may have begun its 3rd elliot wave, with a bottom at $2.33. There also appears to be nice recent strong base support around $2.80. In addition, there appears to be a deviation between price and money flow, as shown with the green arrows - with a potential correction available to push price beyond $3.30 very soon.
I have entered and will watch its daily action and volume with an upside expectation limit around $9-10, then a 4th wave down, etc. Of course, I am not a financial advisor and I have been wrong before and will be wrong again. I trade within this reality and control my risk.
Bitcoin: New All-Time High — What’s Next?Bitcoin had an incredible run, breaking the old all-time high ($111,980) with strong bullish momentum and setting a fresh ATH at $123,218 (Binance). We just witnessed the first major corrective move of ~6% and a decent bounce so far — but the big question is:
What’s next? Will Bitcoin break higher over the summer or form a trading range here?
Let’s dive into the technicals.
🧩 Higher Timeframe Structure
May–June Range:
BTC was stuck between $110K–$100K, forming an ABC corrective pattern. Using trend-based Fib extension (TBFE) from A–B–C:
✅ C wave completed at $98,922 (1.0 TBFE)
✅ Upside target hit at $122,137 (-1 TBFE)
Full Bull Market TBFE:
➡️ 1.0 → $107,301 → previously rejected
➡️ 1.272 → $123,158 → recent rejection zone
Pitchfork (log scale):
➡️ Tapped the upper resistance edge before rejecting.
Previous Bear Market Fib Extension:
➡️ 2.0 extension at $122,524 hit.
2018–2022 Cycle TBFE:
➡️ 1.618 at $122,011 tapped.
Macro Fibonacci Channel:
➡️ Connecting 2018 low ($3,782), 2021 ATH ($69K), 2022 low ($15,476) →
1.618–1.666 resistance band: $121K–$123.5K.
✅ Conclusion: Multiple fib confluences mark the $122K–$123K zone as critical resistance.
Daily Timeframe
➡️ FVG / Imbalance:
Big daily Fair Value Gap between the prior ATH and $115,222 swing low.
BTC broke the prior ATH (pATH) without retest → a pullback to this zone is likely.
Lower Timeframe / Short-Term Outlook
We likely saw a completed 5-wave impulse up → now correcting.
The -6% move was probably wave A, current bounce = wave B, next leg = wave C.
➡ Wave B short zone: $120K–$121K
➡ Wave C target (1.0 TBFE projection): ~$113,326
➡ Confluence at mid-FVG + nPOC
Trade Setups
🔴 Short Setup:
Entry: $120,300–$121,000
Stop: Above current ATH (~$123,300)
Target: $113,500
R:R ≈ 1:2.3
🟢 Long Setup:
Entry: Between Prior ATH and $113,000
Stop: Below anchored VWAP (~$110,500)
Target: Higher, depending on bounce confirmation.
🧠 Educational Insight: Why Fibs Matter at Market Extremes
When markets push into new all-time highs, most classic support/resistance levels disappear — there’s simply no historical price action to lean on. That’s where Fibonacci extensions, channels, and projections become powerful tools.
Here’s why:
➡ Fibonacci extensions (like the 1.272, 1.618, 2.0) help estimate where trend exhaustion or profit-taking zones may appear. They are based on the psychology of crowd behavior, as traders anchor expectations to proportional moves from previous swings.
➡ Trend-Based Fib Extensions (TBFE) project potential reversal or continuation zones using not just price levels, but also the symmetry of prior wave moves.
➡ Fibonacci channels align trend angles across multiple market cycles, giving macro context — like how the 2018 low, 2021 ATH, and 2022 low project the current 1.618–1.666 resistance zone.
In short:
When you don’t have left-hand price history, you lean on right-hand geometry.
That’s why the $122K–123K zone wasn’t just random — it’s a convergence of multiple fib levels, cycle projections, and technical structures across timeframes.
⚡ Final Thoughts
Bitcoin faces major resistance around $122K–$123K backed by multiple fib and structural levels. A retest of the prior ATH zone (~$112K–$113K) looks probable before the next big directional move. Watch lower timeframe structure for signs of completion in this corrective phase.
_________________________________
💬 If you found this helpful, drop a like and comment!
Want breakdowns of other charts? Leave your requests below.

Gold is getting ready to rise.Gold has been resting too long and the neutral triangle is no longer valid in terms of time and a contracting triangle seems to be forming.
In any case, there is at least one more bullish wave left for gold.
Good luck
NEoWave Chart

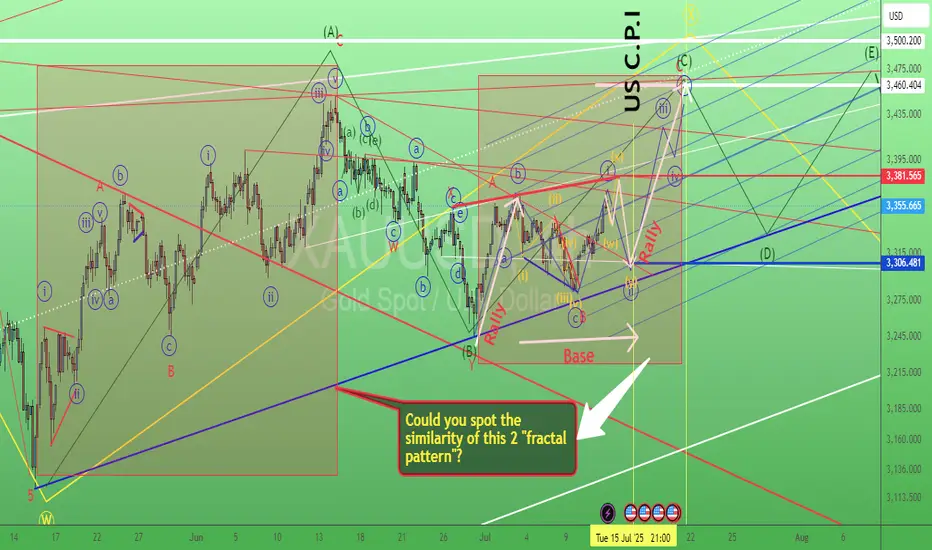
Gold swing trade setup 13/July/25XAUUSD. Based on the latest "speed" development of chart instead of forming a triangle pattern gold probably building a "flat" "Base" before rallying toward 3460 +/- Coming Tuesday US CPI could be the "trigger" for launching the rocket..