Bitcoin Bearish Shark Detected – CME Gap Below $115K in Sight?Today's analysis is on the 15-minute timeframe , following the previous analysis I shared with you on the 1-hour timeframe .
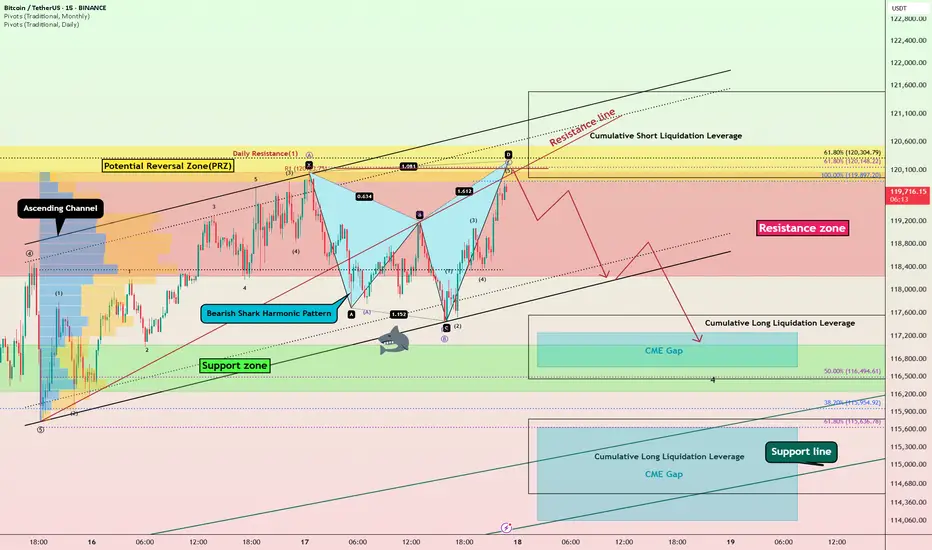
Bitcoin ( BINANCE:BTCUSDT ) is currently trading in the Resistance zone($120,100-$118,240) near the Potential Reversal Zone(PRZ) and Cumulative Short Liquidation Leverage($121,490-$119,965) .
From a technical perspective , it looks like Bitcoin is completing the Bearish Shark Harmonic Pattern on the 15-minute timeframe .
From an Elliott wave theory perspective, it looks like Bitcoin is completing the microwave 5 of wave C of the Zigzag Correction(ABC/5-3-5) .
I expect Bitcoin to start falling from the top of the ascending channel and at least decline to the lower line of the descending channel, and if the ascending channel breaks this time, we should wait for the CME Gap($117,255-$116,675)/CME Gap($115,060-$114,947) to fill.
Cumulative Long Liquidation Leverage: $117,556-$116,465
Cumulative Long Liquidation Leverage: $115,773-$114,513
Do you think Bitcoin can create a new ATH again?
Note: Stop Loss(SL)= $121,620
Please respect each other's ideas and express them politely if you agree or disagree.
Bitcoin Analyze (BTCUSDT), 15-minute time frame.
Be sure to follow the updated ideas.
Do not forget to put a Stop loss for your positions (For every position you want to open).
Please follow your strategy and updates; this is just my Idea, and I will gladly see your ideas in this post.
Please do not forget the ✅' like '✅ button 🙏😊 & Share it with your friends; thanks, and Trade safe.
Elliott Wave
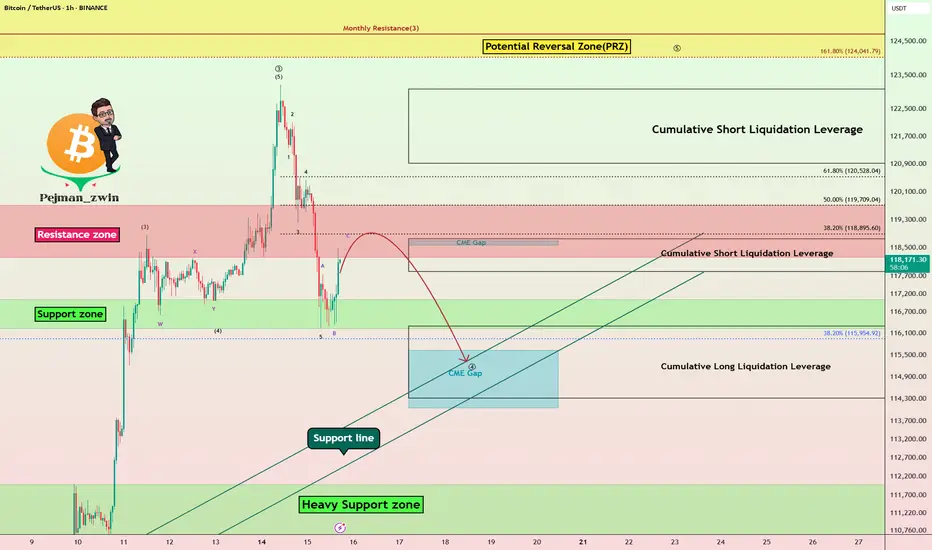
Bitcoin Struggles Below $120K:Will the CME Gap Pull Price Lower?Bitcoin ( BINANCE:BTCUSDT ) has been experiencing a high momentum bullish trend in recent days, which few people expected, especially when it crossed $120,000 . However, in the past 24 hours , Bitcoin has fallen back below $120,000 .
Bitcoin is currently trading in the Resistance zone($119,720-$118,240) and Cumulative Short Liquidation Leverage($118,757-$117,829) on the 1-hour time frame .
In terms of Elliott Wave theory , Bitcoin appears to be completing a main wave 4 . Main wave 4 is likely to have a Zigzag Correction(ABC/5-3-5) .
I expect Bitcoin to attack the Support lines and fill the CME Gap($115,060-$114,947) in the next hour.
Cumulative Short Liquidation Leverage: $123,087-$120,922
Cumulative Long Liquidation Leverage: $116,305-$114,325
Do you think Bitcoin can create a new ATH again?
Note: Stop Loss(SL)= $121,000
Please respect each other's ideas and express them politely if you agree or disagree.
Bitcoin Analyze (BTCUSDT), 1-hour time frame.
Be sure to follow the updated ideas.
Do not forget to put a Stop loss for your positions (For every position you want to open).
Please follow your strategy and updates; this is just my Idea, and I will gladly see your ideas in this post.
Please do not forget the ✅' like '✅ button 🙏😊 & Share it with your friends; thanks, and Trade safe.
AUDUSD Potential UpsidesHey Traders, in today's trading session we are monitoring AUDUSD for a buying opportunity around 0.64500 zone, AUDUSD is trading in an uptrend and currently is in a correction phase in which it is approaching the trend at 0.64500 support and resistance area.
Trade safe, Joe.

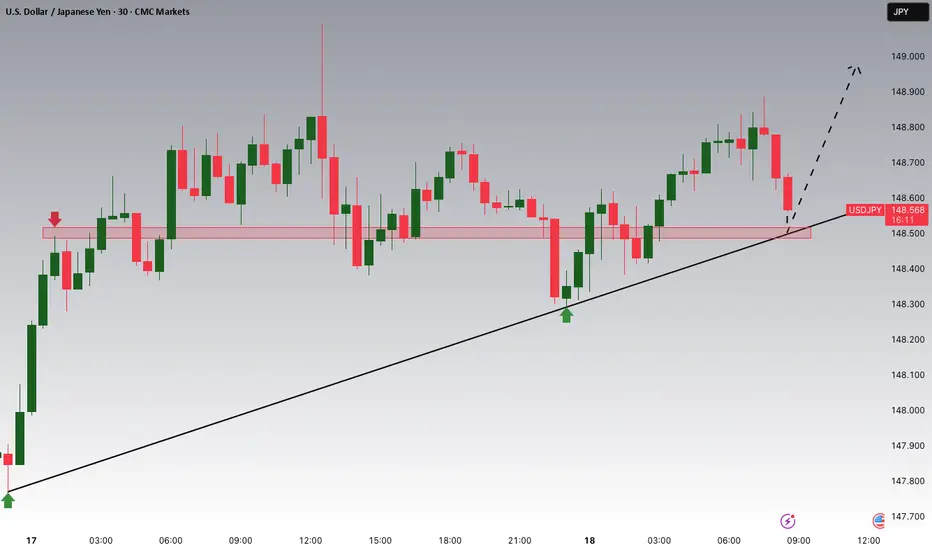
USDJPY Potential UpsidesHey Traders, in today's trading session we are monitoring USDJPY for a buying opportunity around 148.500 zone, USDJPY for a buying opportunity around 148.500 zone, USDJPY is trading in an uptrend and currently is in a correction phase in which it is approaching the trend at 148.500 support and resistance area.
Trade safe, Joe.
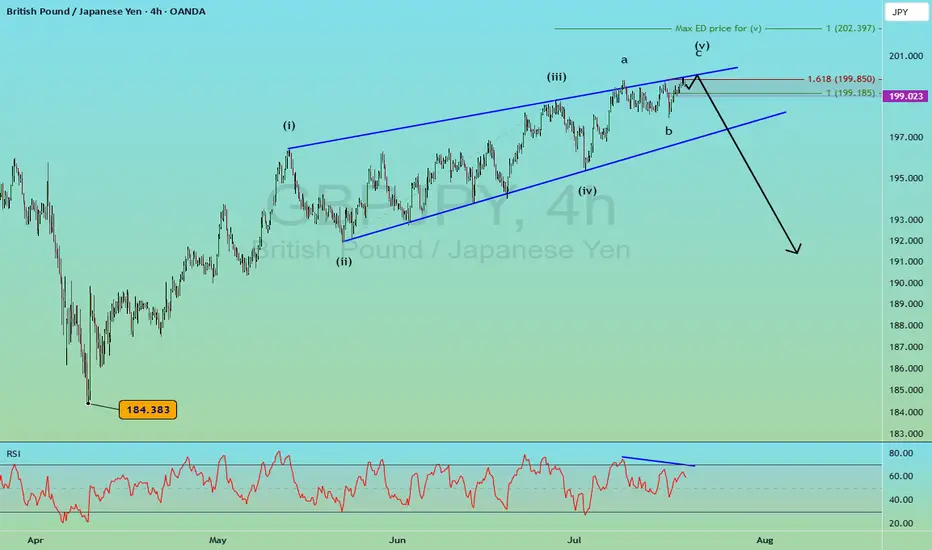
GBPJPY Large Reversal Pattern [Elliott Wave]Executive Summary:
GBPJPY shaping a diagonal pattern.
Large bearish reversal could push down to 184.
Above 202.40 voids the pattern as labeled.
I typically don't conduct Elliott wave analysis on cross pairs simply because they are the children of the two main currencies involved. GBPJPY is the child of GBPUSD and USDJPY.
With that said, I still scroll through charts looking for compelling patterns and GBPJPY caught my attention.
First, it's knocking on the door of 200...a nice round number.
Secondly, the rally from 184 in April to now appears to be a very mature Elliott wave ending diagonal pattern .
Diagonals shape in 5 waves. Remember, wave 3 cannot be the shortest of waves 1,3,5. Since wave 3 is shorter than wave 1, that means wave 5 cannot be longer than wave 3.
So we simply measure out wave 3 and apply it to the end of wave 4, and, voila, we have a maximum target for wave 5 at 202.40 .
That maximum target doesn't mean GBPJPY has to go that high, but this market is ripe for a large bearish turn. If GBPJPY does push above 202.40, then my wave labeling is incorrect.
Ending diagonals tend to be fully retraced which implies a decline back to 184 ... 1500 pips from today's price.
GBJPY may dance around in the 199 handle for a day or two.
A break below 199 could be an early warning signal of the bearish reversal. A break below the blue support trend line helps confirm the pattern.
If this bearish reversal takes hold, then GBPUSD or USDJPY likely experiences a large decline too.
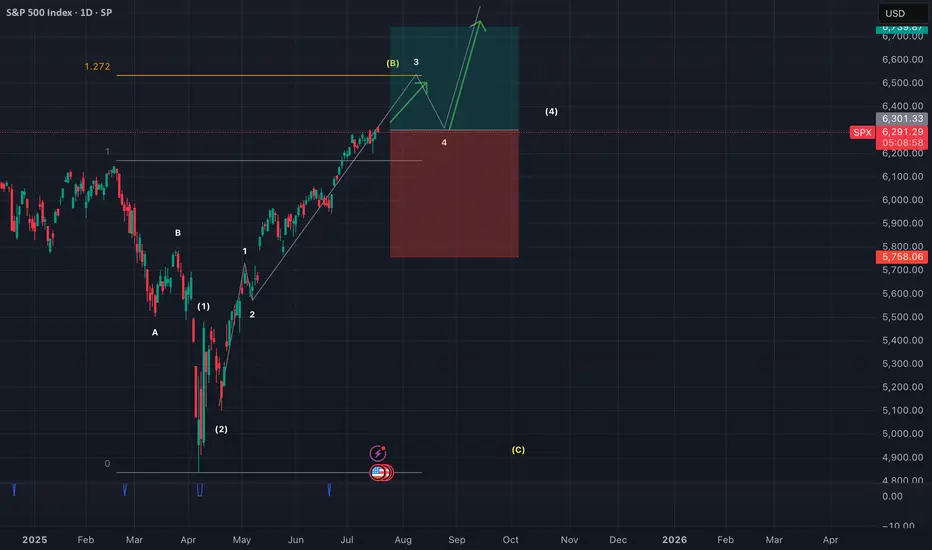
SPX500 in bullish impulseSPX500 currently at 3rd wave of wave (3) (both 2.618% extended). Expecting a retrace at 6517 region for wave 4.
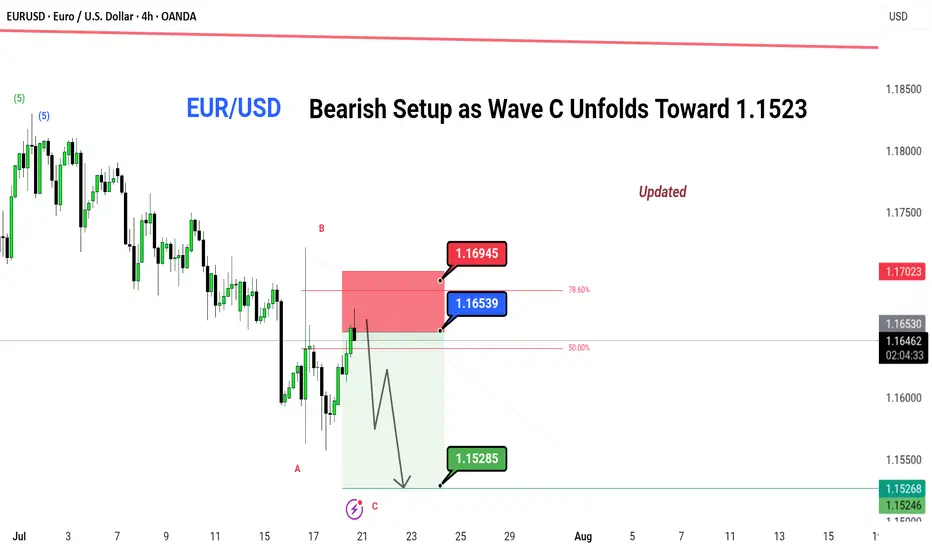
EUR/USD – Bearish Setup as Wave C Unfolds Toward 1.1523📉 EUR/USD – Bearish Setup as Wave C Unfolds Toward 1.1523
Price has retraced into the key 78.6% fib zone after completing Wave B. With clear rejection from the supply area and lower highs forming, Wave C is now in play. Expecting bearish continuation with potential downside targets around 1.1523.
🔻 SHORT BIAS (Wave C in Play)
📍 Entry Zone: 1.16530–1.16945
🎯 Target: 1.15285
⛔ Invalidation: Above 1.17023
📊 Timeframe: 4H
📈 Pattern: ABC Zig-Zag Correction
📌 Updated Analysis by: @greenfire_forex
🧠 Note: Wait for confirmation before entering. Risk management is key.
#EURUSD #ElliottWave #BearishSetup #ABCPattern #WaveC #PriceAction #ForexAnalysis #TradingView
---
Let me know if any correction , would like to suggest
Doge/USD-1 month cash data-Huge bullish moveIt is an update to a previous analysis.
Still, I see a huge bullish movement in Doge. the previous movement was complex corrective movement in the form of WXYXZ

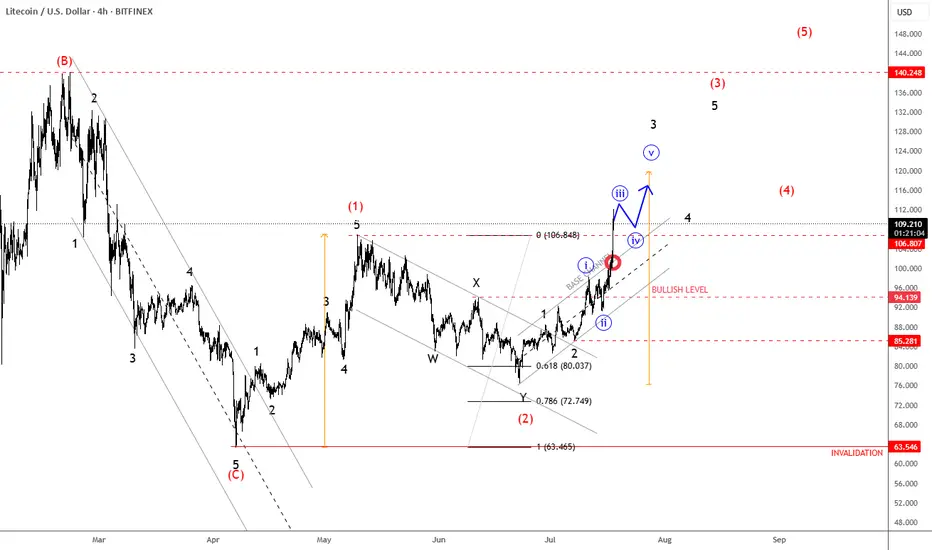
Litecoin Continues Its Bullish Cycle As ExpectedLitecoin Continues Its Bullish Cycle As Expected, which can send the price even higher from technical point of view and by Elliott wave theory.
We talked about Litecoin back on May 30, when we spotted a bullish setup formation with waves (1) and (2) that can extend the rally within wave (3) of a five-wave bullish impulse.
As you can see today on July 18, Litecoin with ticker LTCUSD is now breaking strongly back above May highs after we noticed a complex W-X-Y correction in wave (2). Now that ALTcoin dominance is stepping strongly in, we may easily see more gains within a projected five-wave bullish cycle during the ALTseason, just be aware of short-term pullbacks.
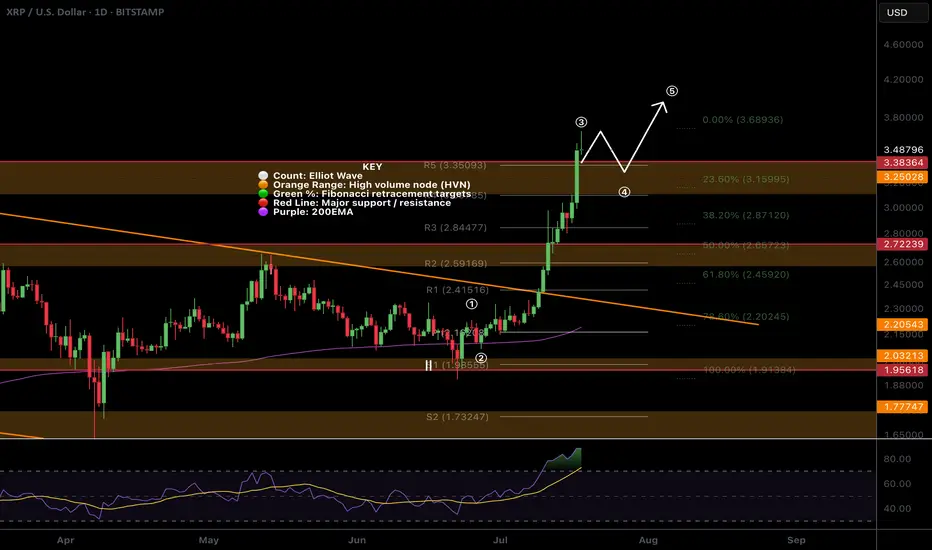
$XRP All time high! Time to sell or...?CRYPTOCAP:XRP appear to have completed wave 3 with a poke above all time high, typically this os behaviour of a wave 5.
The daily R5 pivot point has been breached so there is a significant chance of a decent pullback now but I wouldn't bet against the trend!
Wave 4 could be shallow, targeting the previous all time high, High Volume Node with waver 5 completing near $4.
Daily RSI is overbought but no bearish divergence yet which will likely emerge during wave 5.
Safe trading
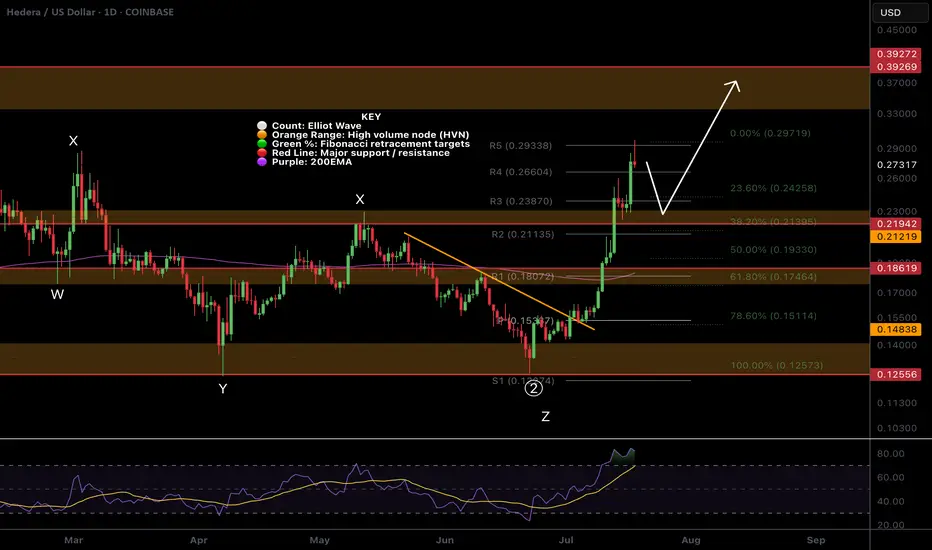
$HBAR Pull Back Started, What is the target?CRYPTOCAP:HBAR doing extremely well, the R5 daily pivot point has been hit and a pull back should be expected before continuation!
It appears wave 3 is now complete and wav4 i expected to pull back to the 0.382 Fibonacci retracement which adds confluence to the High Volume Node in the same place at $0.22 our previous take profit #2 target.
Daily RSI is overbought but no bearish divergence yet! Price behaviour can often pop above the swing high just made to trap new buyers before dumping hard! Watch out for that, that would be the bearish divergence print also.
The next take profit is $0.39
Safe trading
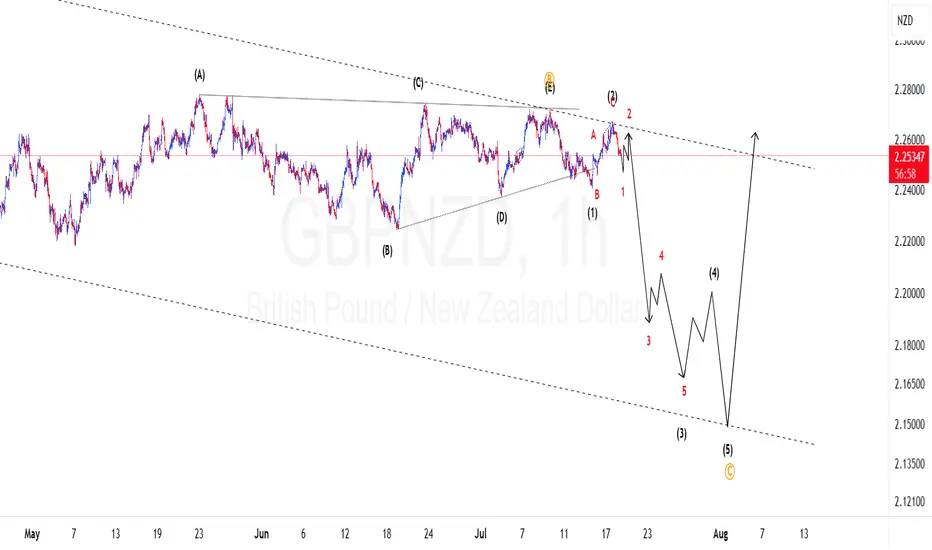
GBPNZD Elliotwaves update: Are Bears still on control?We have been on this in the past two weeks and now we can see clear signs of bears controlling the price. We had a triangle correction completed and made an impulsive wave to the downside which confirmed our bias. Now are are on the first wave of wave 3 and we should anticipate momentum to the downside to increase. To take advantage of the drop one should find areas where price might find resistance and other confluences like Fibonacci to take a trade.
EURAUD → Correction for accumulation before growthFX:EURAUD reaches the zone of interest during a correction and forms a false breakdown of local support. Traders can switch to the buy side to support the trend.
Against the backdrop of a global bullish trend and a correction in the euro, the currency pair is following this movement, the essence of which is to consolidate funds for further growth. Liquidation is forming in relation to the liquidity zones of 1.785, 1.78, and 1.773, and the market imbalance is changing. The current movement is bringing the price to the zone of interest: the liquidity area of 1.773 and the order block. The capture of liquidity relative to 1.773 leads to the formation of a false breakdown and a pullback to the area of interest for buyers. Accordingly, price consolidation above 1.776 and 0.7 Fibonacci could support the main trend and allow the price to strengthen.
Support levels: 1.776, 1.773, 1.763
Resistance levels: 1.786, 1.795
The euro clearly demonstrates an upward trend, the structure of which has not been broken during the correction. Correction is a perfectly healthy movement within a trend, allowing positions to be opened at more favorable prices. If the bulls hold their defense above 1.776, momentum towards the specified targets may form.
Best regards, R. Linda!

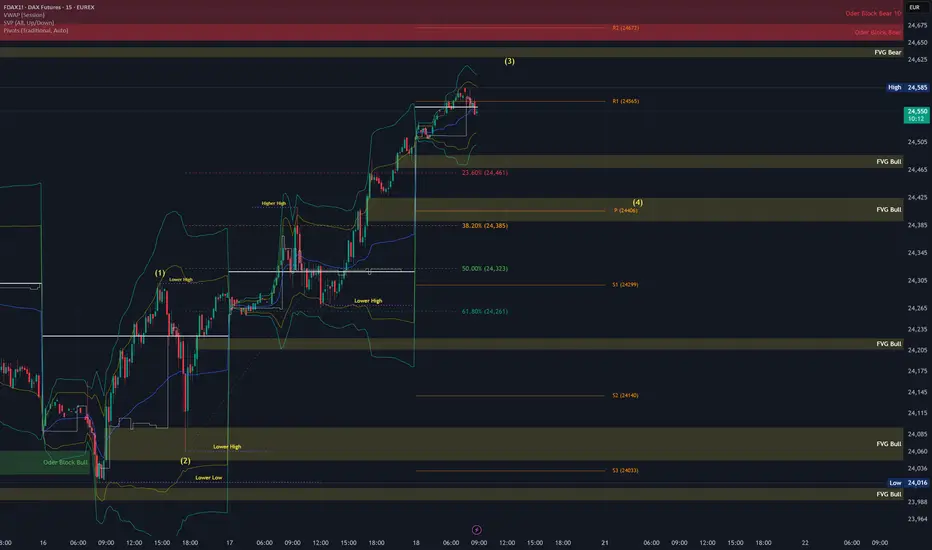
FDAX Today 1. Wave (3) likely near completion:
Price hit the 1.618 extension of Wave 1, which is textbook for a Wave 3 target.
There’s also confluence with the 23.6% retracement from the previous swing high (24,703), and we're near a Bearish FVG + Order Block zone.
High-probability zone for a short-term rejection or distribution top.
2. Wave (4) could start today
If Wave 3 is topping into OpEx, dealers might unwind long gamma hedges, contributing to volatility + pullback.
Elliott Wave Analysis: SPY Poised To Extend Higher In Bullish SeElliott Wave sequence in SPY (S&P 500 ETF) suggest bullish sequence in progress started from 4.07.2025 low. It expects two or few more highs to extend the impulse sequence from April-2025, while dips remain above 6.23.2025 low. SPY ended the daily corrective pullback in 3 swings at 480 low on 4.07.2025 low from February-2025 peak. Above there, it favors upside in bullish impulse sequence as broke above February-2025 high. Currently, it favors wave 3 of (1) & expect one more push higher from 7.16.2025 low in to 630.31 – 651.1 area before correcting in wave 4. In 4-hour, it placed 1 at 596.05 high, 2 at 573.26 low as shallow connector & extend higher in 3. Within 3, it placed ((i)) at 606.40 high, ((ii)) at 591.89 low, ((iii)) at 627.97 high & ((iv)) at 618.05 low.
In 1-hour above ((ii)) low of 591.89 low, it ended (i) at 605.96 high, (ii) at 603.17 low, (iii) at 626.87 high as extended move, (iv) at 620 low & (v) as ((iii)) at 627.97 high. Wave ((iv)) ended in 3 swing pullback as shallow connector slightly below 0.236 Fibonacci retracement of ((iii)). Within ((iii)), it ended (a) at 619.8 low, (b) at 624.12 high & (c) at 618.05 low on 7.16.2025 low (this week). Above there, it favors rally in ((v)) of 3 targeting in to 630.31 – 651.1 area before correcting in 4. Within ((v)), it placed (i) at 624.73 high, (ii) at 623.08 low & favors upside in (iii) of ((v)). We like to buy the pullback in clear 3, 7 or 11 swings correction at extreme area in 4 and later in (2) pullback, once finished (1) in 5 swings.

XRP Special UpdateJust wanted to give y'all a heads up that XRP is within the target box for (5) of ((3)). If you look up my old posts from March and even as far back as January, you will see I have not changed this chart at all. It is doing exactly what the pattern had been telling us it would. I went ahead and sold the rest of my position, so I am now flat XRP. Will it move higher still yet? I believe it will, yes. However, it could turn around very soon so I found it better to collect my profits while I had the opportunity. A wise man once said, "profit is a thief, take it while you can." Don't get greedy in this game, or you will come to regret it!
FYI: I think the 1.382 is a reasonable place for this pattern to end. If we can get a 3-wave retracement, there is a high probability I re-enter with tight stops for another leg higher.

Ethereum Primed for Breakout as Institutional Interest SurgesBlackRock's aggressive ETH accumulation—$276M in February, $98M just this week—signals institutional conviction as Ethereum approaches a breakout towards $3,000. With real-world asset (RWA) tokenization exploding to $21B+ (Ethereum commanding 59% market share) and stablecoin volume hitting record $717B monthly highs, ETH is positioned as the backbone of traditional finance's blockchain migration.
The convergence of institutional buying, technical breakout signals, and Ethereum's dominance in the fastest-growing crypto sectors creates a perfect storm for the next major price surge 🚀
intel.arkm.com

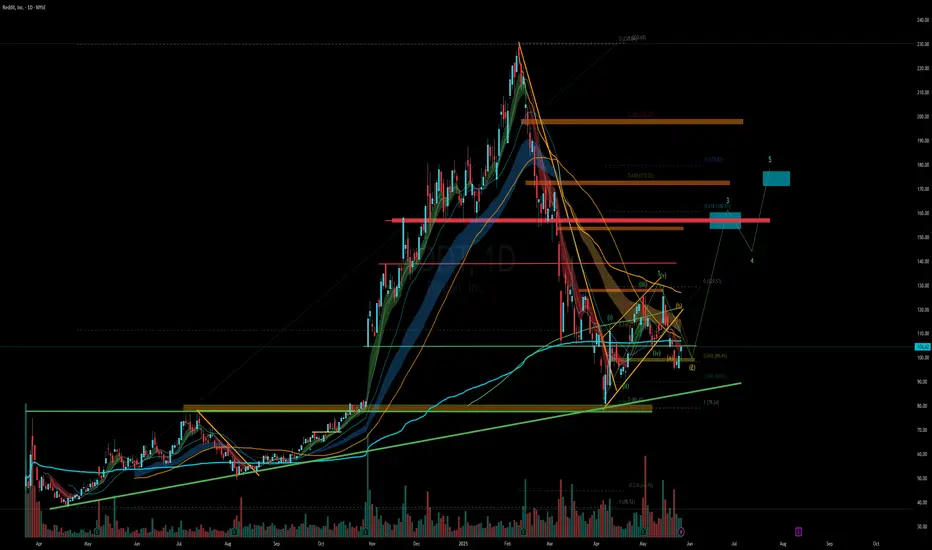
RDDT - Ready for Round 2?RDDT is setting up a base here, let's see if it holds this previous support level around 80.
Target 1 - 160
Target 2 - 180
Stop loss - 75
TRON TRX Eying New ATH📈 After 6 months of sideways accumulation, CRYPTOCAP:TRX is finally picking up momentum. A weekly close above $0.317 could trigger acceleration toward the next targets at $0.50–$0.60 🚀

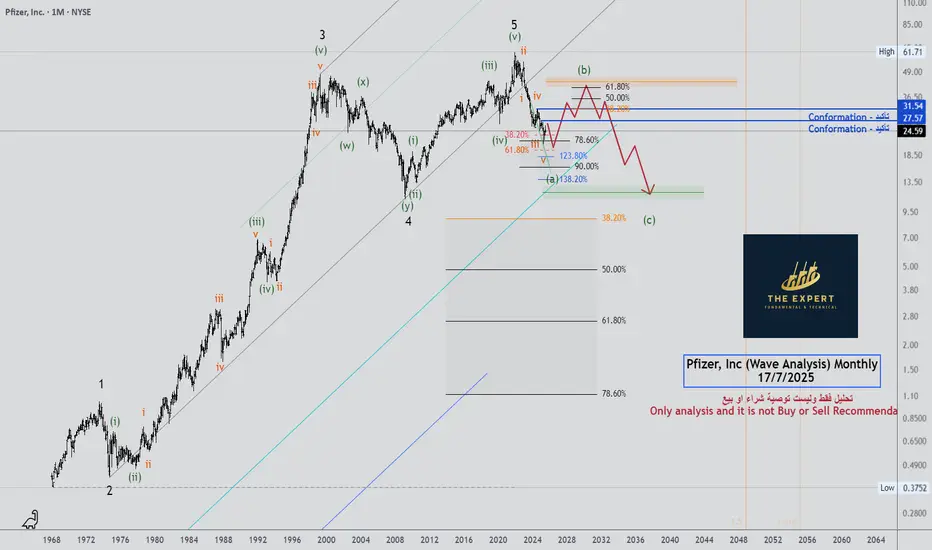
Pfizer, Inc (Wave Analysis) Monthly - Update 17/7/2025Pfizer, Inc (Wave Analysis) Monthly - Update 17/7/202
See the chart
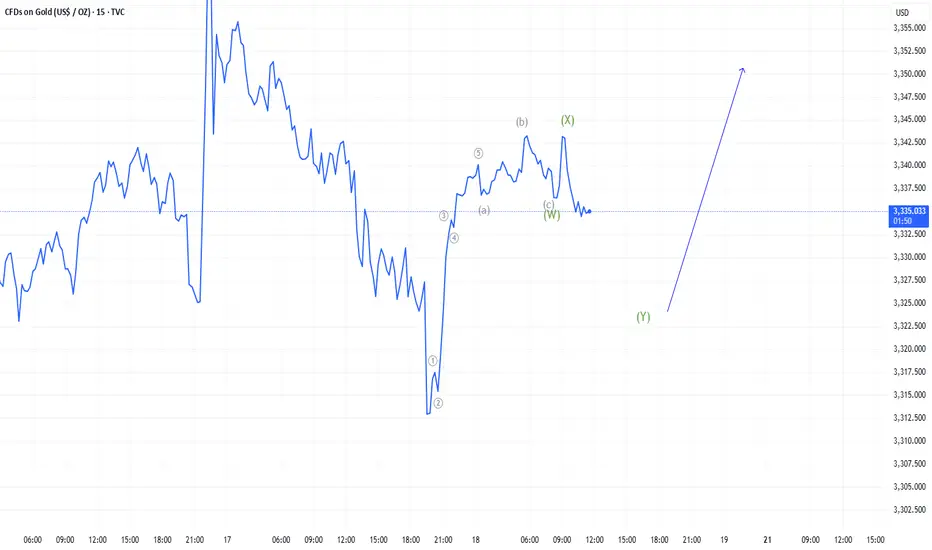
GOLD → The triangle is contracting. Retest of support...FX:XAUUSD tested a local high of 3375 but quickly returned to consolidation. The reason is manipulation by the US administration related to Powell, inflation, and interest rates...
Demand for gold has risen sharply amid global risks: Trump's aggressive tariff plans, strong inflation, and uncertainty about the Fed's actions have increased interest in defensive assets. Despite the temporary strengthening of the dollar, gold remains a popular hedging instrument. Technical analysis also points to a bullish outlook. However, growth potential is limited until the Fed clarifies its interest rate policy
Technically, on the D1 chart, it is clear that the price is consolidating, with the range continuing to narrow. Due to the bullish factors listed above, we can expect growth to continue. However, it is difficult to say where and when the growth will begin due to the uncertainty factor. All attention is on the support at 3320-3312, the triangle support, as well as the consolidation support at 3287.
Resistance levels: 3365, 3375
Support levels: 3320, 3312, 3287
Since the opening of the session, the price has spent part of its daily range, so there may not be enough potential for the decline to continue. A false breakdown of support and consolidation of the price above the key zone may attract buyers, which will trigger growth towards resistance.
Best regards, R. Linda!

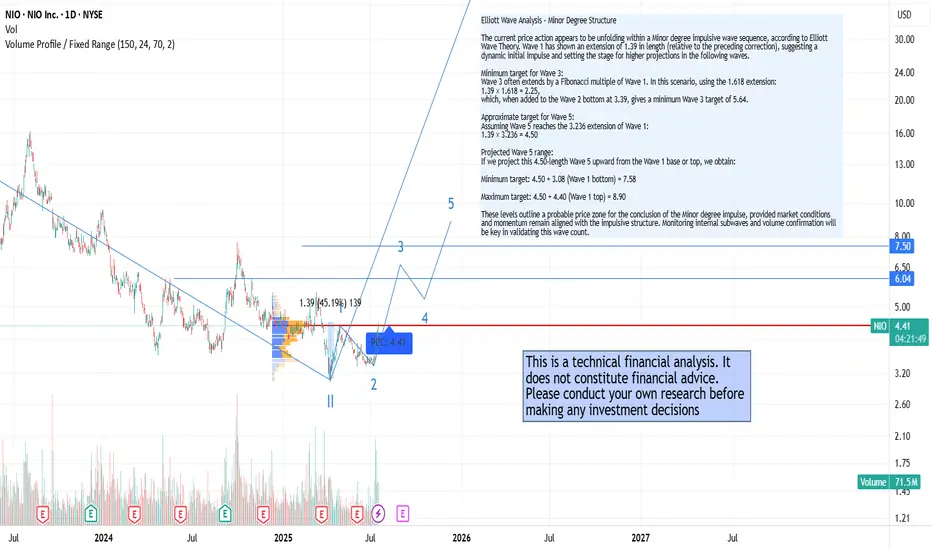
New Highs Ahead?In recent sessions, Nio Inc. has shown a price acceleration consistent with a Minor degree impulsive wave, as outlined by Elliott Wave Theory. Wave 1 has extended by a factor of 1.39, and the current price structure suggests a possible completion of Wave 3 and an early development of Wave 5, with clear technical targets already in place.
This technical scenario aligns with recent positive developments on the fundamental side:
🔹 Stronger delivery numbers – The latest quarterly results reveal robust year-over-year growth in vehicle deliveries, highlighting the company’s ability to scale production and meet rising demand. This performance is further enhanced by an improved product mix, with a shift toward higher-end or newer models, which contributes to stronger revenue per unit and improved brand positioning.
🔹 Battery swap network expansion – The company is steadily expanding its battery swap infrastructure. This innovative model, which allows EV drivers to swap a depleted battery for a fully charged one in just a few minutes, differentiates the company from traditional EV players. It also reduces charging time anxiety, increases convenience, and aligns with long-term goals for energy and fleet efficiency—particularly in dense urban areas and high-mileage use cases like ride-hailing or logistics.
🔹 New market entries – The company is actively pursuing international expansion, with strategic launches in Europe, including growing presence in countries like Germany, the Netherlands, and Norway. At the same time, it's establishing key partnerships in the Middle East to prepare for future entry into high-potential markets such as the UAE and Saudi Arabia. This geographic diversification not only broadens the customer base but also strengthens global brand positioning in the premium EV segment.
🔍 Key Highlights – NIO Mid-2025 Update
📈 Vehicle Deliveries
June 2025: 24,925 vehicles delivered (+17.5% YoY)
Q2 2025: 72,056 vehicles (+25.6% YoY)
1H 2025 total: 114,150 units (+30% YoY)
Cumulative deliveries: 785,714 units as of June 30, 2025
🔋 Battery Swap Network
Global footprint: Over 2,700 stations (2,400+ in China, ~60 in Europe)
China: ~2,651 stations, with 159 in Shanghai
Europe: ~60 stations, notably in Germany and Norway
Utilization: Peak stations in Shanghai exceed 100 swaps/day; global average ~30–40
💡 Takeaway
These strong operational metrics confirm accelerating growth and strategic infrastructure expansion, reinforcing NIO’s unique value proposition in the EV sector. The fundamental momentum aligns with bullish technical signals, including an unfolding Elliott Wave pattern projecting higher targets.
Based on the current Elliott Wave projection:
Minimum target for Wave 3: 5.64
Projected Wave 5 range: between 7.58 and 8.90
In summary, we’re observing a technically and fundamentally aligned scenario where price action is increasingly supported by improving financials and strategic execution on the ground.
This is not a financial advise, please do your own research.