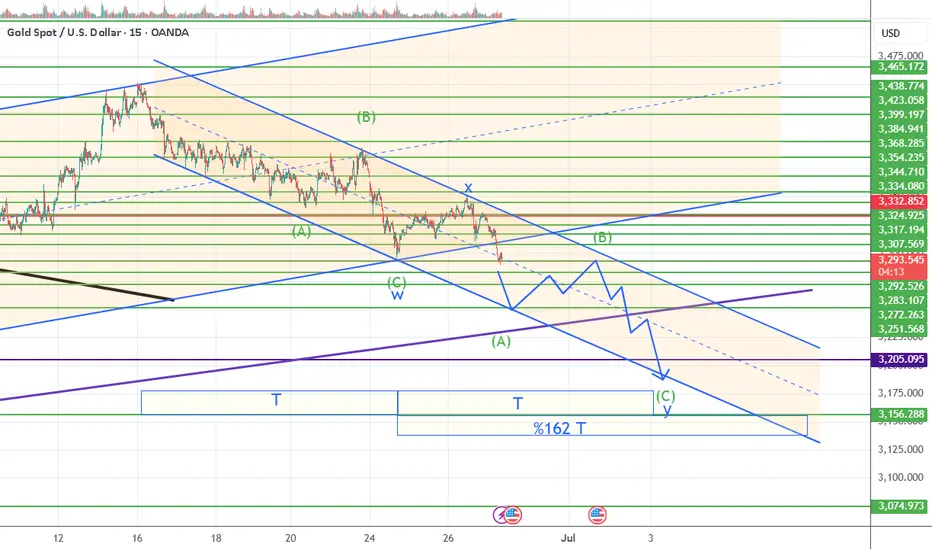
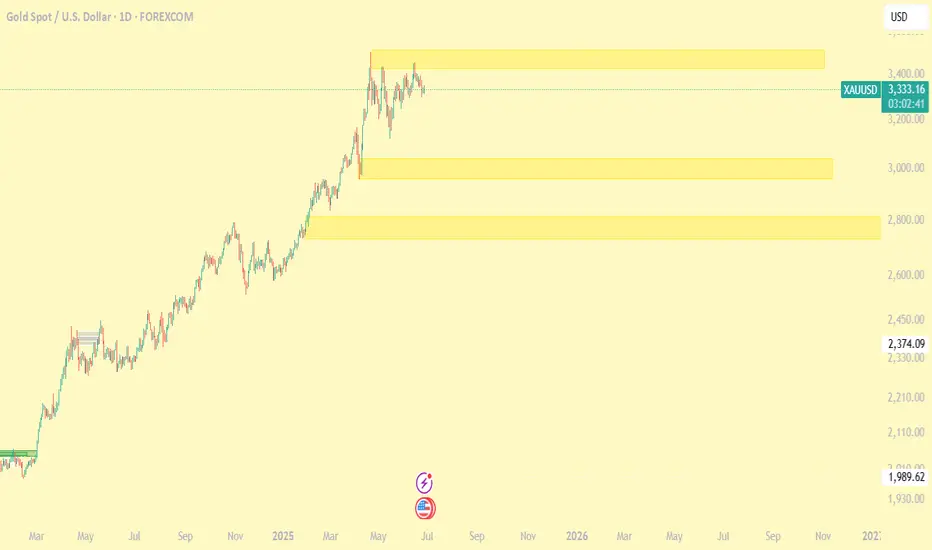
XAUUSD Gold Correction Movesit s a correction, it s messy, it is complicated but also it is necesery, so this is a sell until the brake of channel, until probably next week friday or so.. i expect 3251-3205 or maybe little bit lower targets
Elliott Wave
EURJPY 1H Chart
I expect at least one more liquidity-grabbing leg up for blue wave 5, before a correction begins.
First target for the correction is 168 (blue area), which is the beginning of this latest upside wave.
Note that you should trade wave expectations... wait for a reversal pattern and clear bearish price action before taking any shorts.

XRPBTC May Face Another Rally This YearXRPBTC pair can be trading in a larger weekly (A)(B)(C) flat correction, where wave (C) can be now in progress as a five-wave bullish impulse back to 2021 highs.
XRPBTC is currently slowing down due to BTC dominance, but notice that it's now testing February 2025 lows, so wave 4 correction can be coming to an end, which can extend the rally for wave 5 of (C) towards 0.000040 area and it can bring the ALTseason.

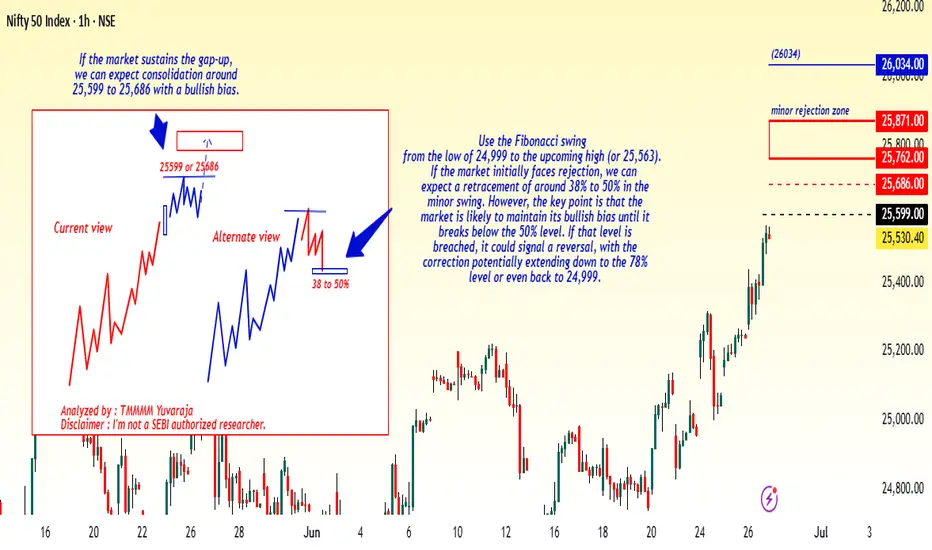
#Nifty directions and levels for June 27Good morning, Friends! 🌞
Here are the market directions and levels for June 27:
Market Overview
Both the global markets and our local markets are showing bullish sentiment. Gift Nifty is also indicating a positive start of around 30 points today.
So, what can we expect today?
In the previous session, Nifty performed well and Bank Nifty also supported the move.
Structurally, the trend still appears bullish. So, if the market opens with a strong candle formation,
we can expect a further continuation of the rally.
However, my personal opinion is based on sub-wave calculations, the upcoming wave could be the 4th wave—which is typically a consolidation phase.
So, after the gap-up, the market may consolidate around the immediate resistance zone.
On the other hand, if the gap-up does not sustain or if the market faces rejection near the immediate resistance,
it could lead to a correction of around 38% to 50% in the minor swing.
The key point here is: until the market breaks below the 50% level, the overall bias may remain bullish. But if the 50% mark is broken,
it could lead to a reversal, with deeper correction possible.
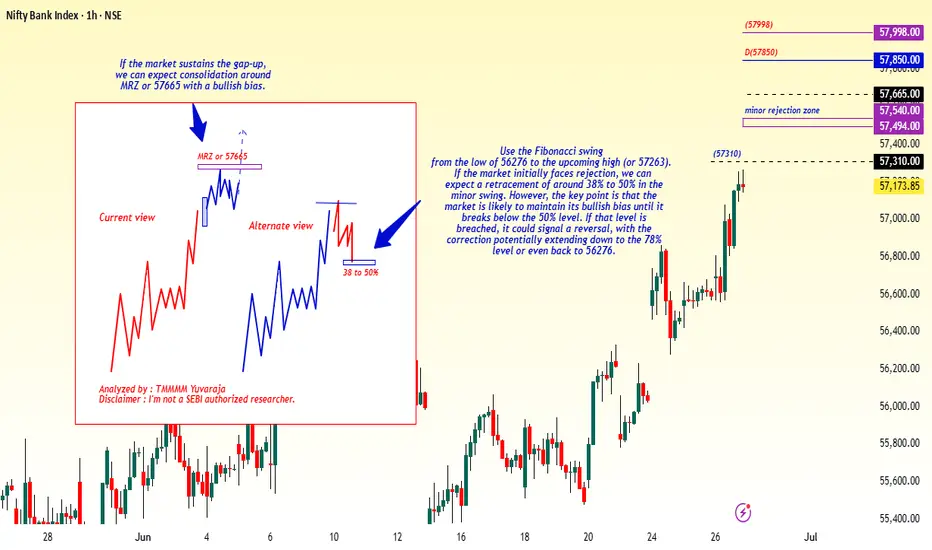
#Banknifty directions and levels for June 27Structurally, the trend still appears bullish. So, if the market opens with a strong candle formation,
we can expect a further continuation of the rally.
However, my personal opinion is based on sub-wave calculations, the upcoming wave could be the 4th wave—which is typically a consolidation phase.
So, after the gap-up, the market may consolidate around the immediate resistance zone.
On the other hand, if the gap-up does not sustain or if the market faces rejection near the immediate resistance,
it could lead to a correction of around 38% to 50% in the minor swing.
The key point here is: until the market breaks below the 50% level, the overall bias may remain bullish. But if the 50% mark is broken,
it could lead to a reversal, with deeper correction possible
Bitcoin Top is In! Bear considerationsPrice has been carving out an unclear correction off the high. The recent structure has many squinting. Is it done or the calm before another wave of selling?
I am weighing two bearish scenarios here. One is more aggressive than the other. But both start with the same idea. No new high before another low.
Let’s start at the top.
The initial move down off the recent high could count as an impulse. Whether that is a wave 1 or a wave A is still up for judgment. Either way, that first leg sets a bearish tone at the larger degree.
Here’s where it gets interesting. The correction since then shows traits of a flat. A running one at the moment.
This opens the door to two active bearish projections:
A wave C collapse, implying a completed A B C correction and a downside resolution.
A wave 3 drop, for a possible top if this is an impulsive sequence.
That is the fork in the road. And it all hinges on the next move.
Right now, the smallest degree impulse off the low is doing some heavy lifting.
If that pivot holds and we only get an internal retracement like a micro wave 2, the door is still open for upside continuation.
But if that impulse gets invalidated, I would expect bears to press. First for a break below 100k, then toward the 95k area.
Here is how to think about it:
Hold the small impulse → Potential upside
Break the impulse base → Wave C or 3 likely underway
Context still leans bearish. Lower highs are still in play. But we are hunting a specific structure to confirm it.

Down for goldHi traders,
Last week gold went lower then expected (wavecount updated).
The last wave down could be wave 2 or it's part of a big Triangle/ Flat.
Next week we could see this pair to go lower to sweep the liquidity below the lows and fill the 4H bullish FVG.
After that it could go up again.
Let's see what price does and react.
Trade idea: Wait for a small correction up on a lower timeframe to finish and trade (short term) shorts.
If you want to learn more about trading FVG's & liquidity sweeps with wave analysis, please make sure to follow me.
This shared post is only my point of view on what could be the next move in this pair based on my technical analysis.
Don't be emotional, just trade your plan!
Eduwave

More upside for EUHi traders,
Last week EU started with a gap down. After the fill it swept the lows and after that it made the next impulsive wave up.
So next week after the finish of the correction down we could see more upside.
Let's see what the market does and react.
Trade idea: Wait for the finish of the correction down and a change in orderflow to bullish on a lower time frame. After a small correction down you could trade longs again.
If you want to learn more about trading with FVG's, liquidity sweeps and Wave analysis, then make sure to follow me.
This shared post is only my point of view on what could be the next move in this pair based on my technical analysis.
Don't be emotional, just trade your plan!
Eduwave

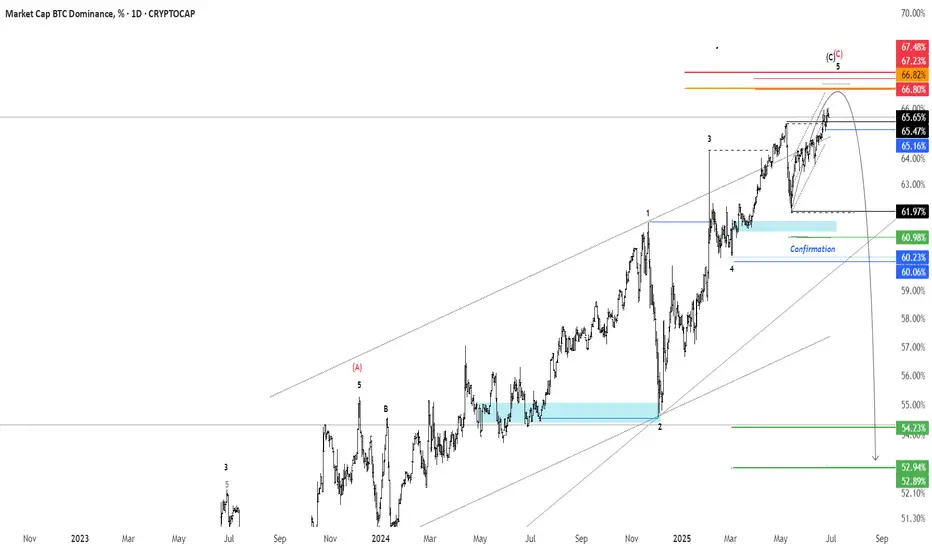
BTC.D - 1D Timeframereversal zone 66.8 : 67.2%
Confirmation : 60.23%
Targets : 52.94% / 31.03
invalid : 67.48%
$HUT Macro Chart Preparing for Breakout?NASDAQ:HUT looks poised for a strong breakout with a wave 3 long term target of $58 and a short term resistances of $21 and $33
HUT is moving strong almost up 100% from the recent swing low, overcoming its weekly 200EMA with ease. A test of the 200EMA as support is likely before continuation.
Price is consolidating under major resistance High Volume Node (HVN) and the weekly pivot point. Consolidation under resistance often leads to a breakout.
A series of 1-2s appears to be taking place on the Elliot Wave count finding support at the 'BTC-Miners golden pocket' of 78.6 Fibonacci retracement.
Analysis is invalidated below $10.10
Safe trading


BTC - A New Oregon Trail or Fool's Gold?The ranch hand (chart) reckons Bitcoin hit a big wave‑3 peak, then swung into a corrective wave‑4 saddle.
Now it's circling the watering hole, teetering around a key resistance near $110k—the cowboy‑critical line in the sand.
If that line holds strong, expect another surge—an “inverse wave‑4, strong 5” push higher toward $115–120k.
But if it buckles, a darker scenario’s afoot: a red‑inked, five‑wave drop galloping down toward $85k.
Bottom line: keep your hat on—$110k is the frontier. Break above that, and the herd’s heading north; if not, saddle up for a ride downhill.
BYBIT:BTCUSDT.P
BITSTAMP:BTCUSD

BIST30 (XU030) - 1 DThe corrective move in the BIST30 index, which began in July 2024, has completed the first two legs of a three-wave structure and is currently unfolding the final downward leg. While the overall pattern appears to be a classic flat (regular) correction, the possibility of it evolving into a WXY complex correction—albeit less likely—still remains valid. I anticipate that this correction will conclude with one final leg to the downside. Both time-based and price-based target levels have been marked. In my assessment, the likelihood of the correction ending within the initially identified support zone is higher than the probability of a deeper retracement.

Preparing for price correctionThe previous scenario is still valid, except that the price correction is taking time and is turning into a diametric.
We are currently in wave-(f) of the diametric
Good luck
NEoWave Chart

The S&P did it!The S&P 500 has reached a new ATH. The monthly RSI looks strong as well. This could trigger an explosion into the target area.

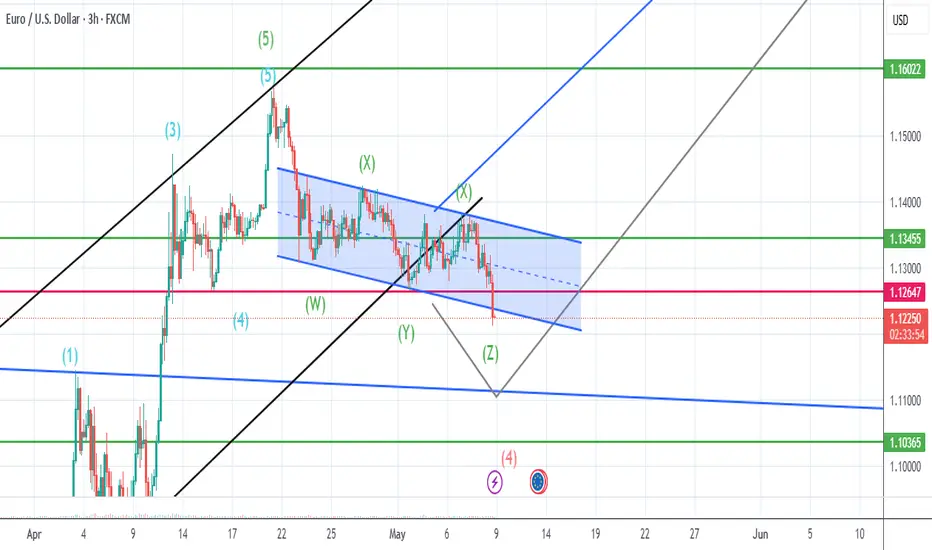
should be going up after correction ends.cant be certain when it comes down to correction waves, it might be here 1.1211 it might go little bit more down around 1.1152 or 1.10 but when it ends it will go for higher than 1.17 also correction wave lenght will give us a better idea where the tp should be so i will keep my first buy position and will add when i am certain when next impulse wave started.
Bitcoin Reaches PRZ with Bearish Signals — Is a Drop Imminent?Bitcoin ( BINANCE:BTCUSDT ) has reached the Potential Reversal Zone(PRZ) as I expected in yesterday's post .
Bitcoin is trading in the Heavy Resistance zone($110,720-$105,820) , Potential Reversal Zone(PRZ) , and near the Resistance lines .
In terms of Elliott Wave theory , it seems that Bitcoin has managed to complete the main wave 5 with the help of the Ending Diagonal . The structure of wave 5 can be different.
Also, we can see the Regular Divergence(RD-) between Consecutive Peaks.
I expect Bitcoin to drop to at least $105,400 .
Cumulative Short Liquidation Leverage: $107,334-$108,250
Cumulative Long Liquidation Leverage: $105,037-$103,392
Note: We could be in for a bit of excitement in the financial markets during Federal Reserve Chairman Powell's speech.
Note: Stop Loss(SL)= $109,020 = We can expect more pumps.
Please respect each other's ideas and express them politely if you agree or disagree.
Bitcoin Analyze (BTCUSDT), 1-hour time frame.
Be sure to follow the updated ideas.
Do not forget to put a Stop loss for your positions (For every position you want to open).
Please follow your strategy and updates; this is just my Idea, and I will gladly see your ideas in this post.
Please do not forget the ✅' like '✅ button 🙏😊 & Share it with your friends; thanks, and Trade safe.


Gold Short: Wave 5 of C In this video, I explained my change in the Gold Elliott Wave counts on the cycle level (red font numbering) and how I think the Gold price movement will go down in a double combination (because the previous 2 waves are double combinations).
I also go through how I set the short target using Fibonacci extensions.

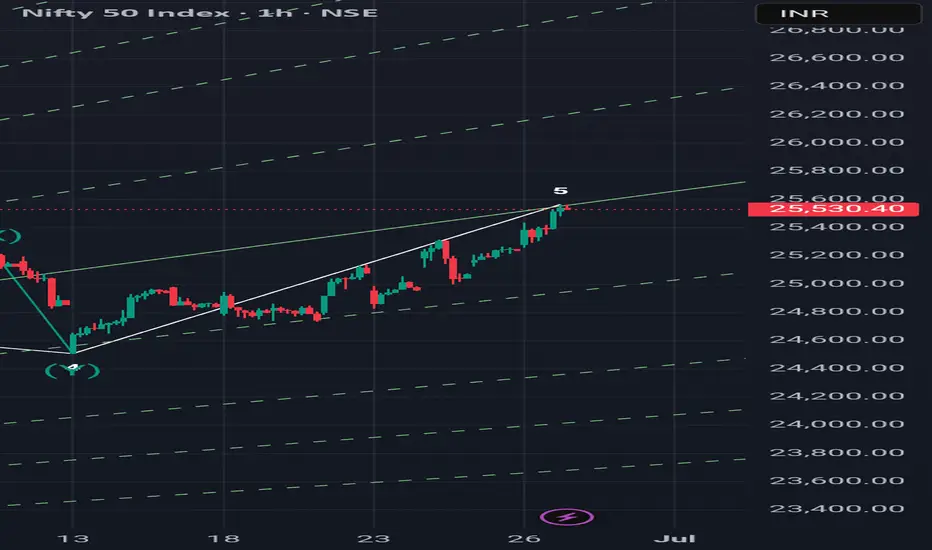
5 th wave done today? If Nifty does not able to cross 25600 by Monday and goes down after hitting today's high of 25565 then it is the indication of completion of wave 5th and now it is the end of extended flat correction ABC started from March. Many price action tools are also indicating this pivot 25565 as high. So the conclusion is this that there are 50% chances of ending of correction and we will get further confirmation after Friday's price movement.
GALA BULLISH IDEAIf the previous wave is a then this wave is near to be corrective one as it is illustrated.
so we may see c wave or three.

DJI This is 2hrly chart of DJI
looking at the chart ,
I sense this structure of EW ...
and looks this whole move has been corrective wave...
going forward...
DJI is 43185
below 42950, I would be looking for 36.5k as my target with recent high as my sl ...
Just a View!!
Vedang:)
Discliamer: Chart is for study purpose only!!
