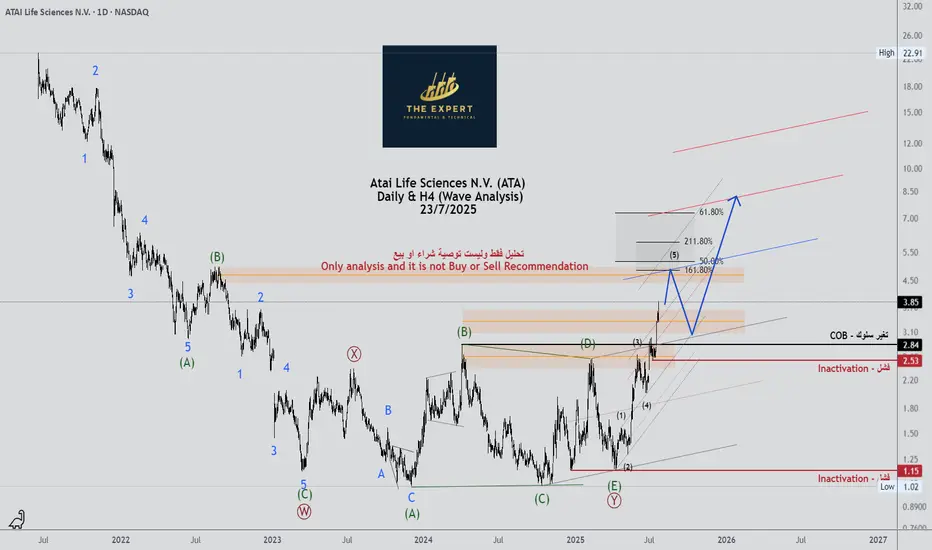
$IREN More downside after huge rally!NASDAQ:IREN is printing bearish divergence on the daily RSI at all tie high resistance.
An Elliot wave motif wave appears complete and wave looks underway with a shallow target of the daily pivot, 0.382 Fibonacci retracement and ascending daily 200EMA.
The daily red wick after printing a 20% start to the day is reminiscent of a blow off top in this asset trapping newbs with FOMO price discovery pump. Market behaviour in action!
Analysis is invalidated if price returns to all time high.
Safe trading
Elliott Wave

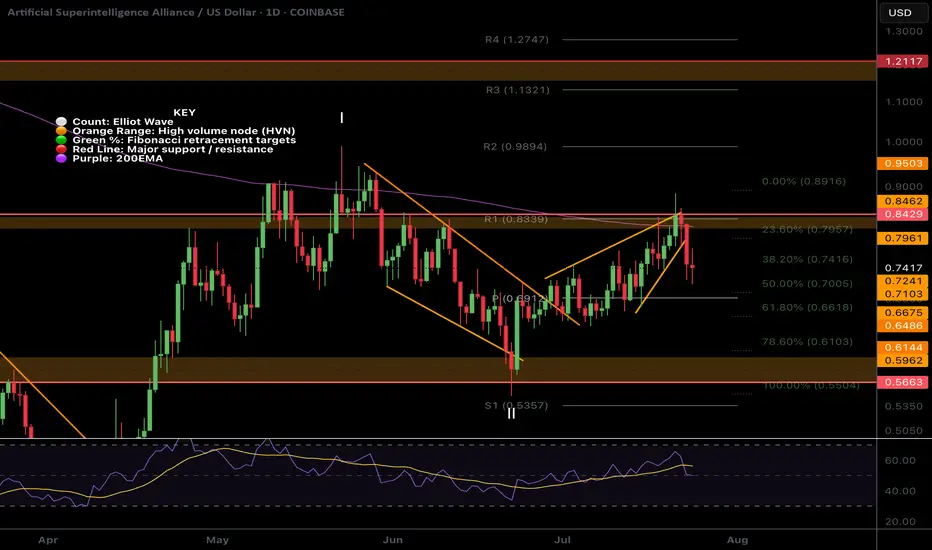
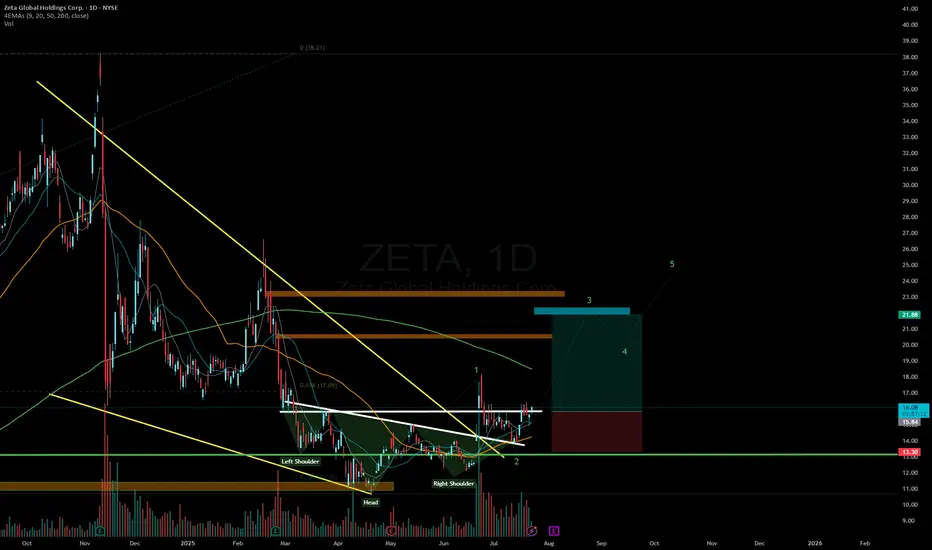
$FET local ending Diagonal and wave 2 near completion?NYSE:FET was rejected for the 4th time at the daily 200EMA! Each time the probability of a breakout increases.
I have adjusted the High Volume Nodes for accuracy.
Locally Fetch appears to have completed a motif wave up with an ending diagonal for wave 5. Wave 2 is expected to find support at the daily pivot and .618 Fibonacci retracement before attempting a breakout of the daily 200EMA once more.
A move below wave II will invalidate this analysis.
Safe trading
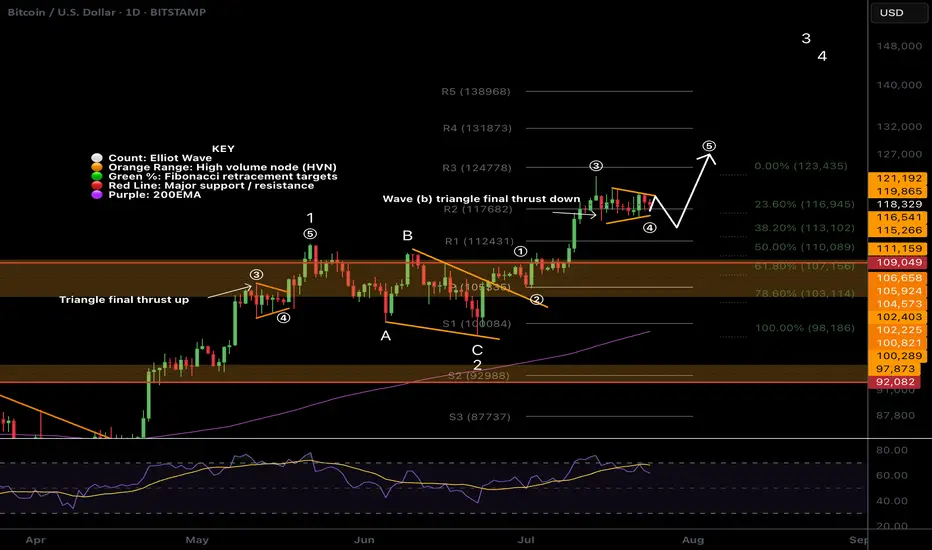
$BTC Wave (b) triangle?CRYPTOCAP:BTC Bitcoin appears to have competed wave 3 up, wave (a) down and now finishing a triangle in wave (b) which would result in a thrust down to around $113k before continuing to the upside in wave (5).
There is slight bullish divergence on daily RSI and wave (4) meets the Fibonacci retracement rules of between 0.236 - 0.382 adding confluence.
Previous all time high is expected to be tested as support on a larger correction, perhaps when the ascending daily 200EMA creeps up to the same level after we blow off.
Safe trading

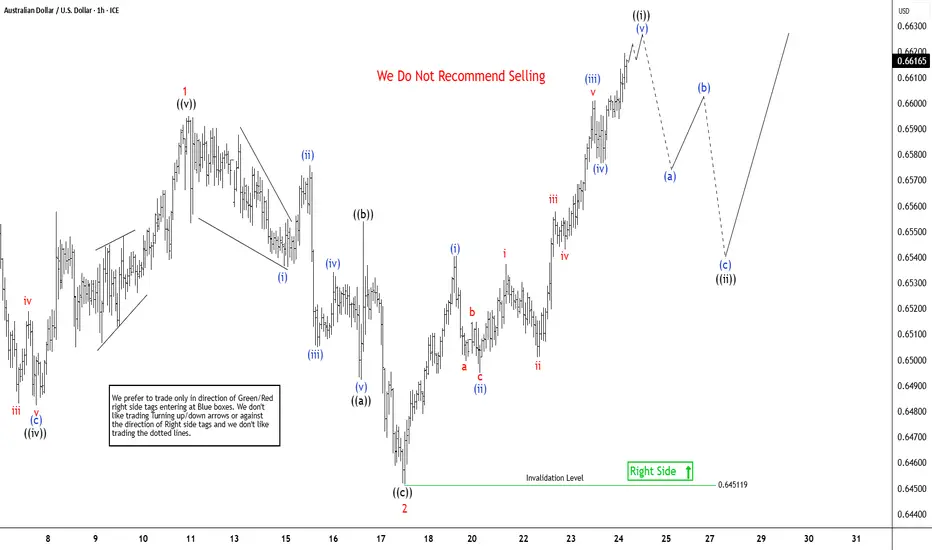
AUDUSD Elliott Wave Outlook: Impulse Pattern Approaching To EndThe AUDUSD pair is showing higher high from 4.09.2025 low, expecting rally to continue from 5.12.2025 low. It favors zigzag corrective bounce from April-2025 low & should continue rally against 0.6451 low. In daily, it started corrective bounce from 4.09.2025 low & may extend towards 0.6720 – 0.6955 area in next few weeks. Above 4.09.2025 low, it ended (A) at 0.6515 high of 5.06.2025, (B) at 0.6354 low of 5.12.2025 & favors upside in (C). Ideally, (C) can extend towards 0.6955 or higher levels, while pullback holds above 5.12.2025 low. Within (C), it placed 1 at 0.6595 high, 2 at 0.6451 low in corrective pullback & favors upside in 3. Within 1, it ended ((i)) at 0.6552 high, ((ii)) at 0.6369 low, ((iii)) at 0.6590 high, ((iv)) at 0.6451 low & ((v)) at 0.6595 high in overlapping diagonal. Below 1 high, it ended 2 in zigzag correction at extreme area before resume rally in 3.
It placed ((a)) of 2 at 0.6492 low in 5 swings, ((b)) at 0.6554 high & ((c)) at 0.6451 low in 5 swings. Wave 2 pullback ended at 0.618 Fibonacci retracement of 1. Within 3, it favors impulse in ((i)) started from 7.17.2025 low. It placed (i) of ((i)) at 0.6540 high, (ii) at 0.6495 low, (iii) at 0.6601 high, (iv) at 0.6576 low & favor upside in (v) targeting in to 0.6606 – 0.6637 area to finish it. It already reached minimum area, but can see more upside above 0.6593 low. Alternatively, the current move even can be (iii) of ((i)) followed by small pullback in (iv) & higher in (v). Later, it expects ((ii)) to correct in 3, 7 or 11 swings against 7.17.2025 low & find support from extreme area to continue rally. Wave 3 should extend in to 0.6692 – 0.6841 area in 5 swings before correcting in 4 of (C). We like to buy the pullback in 3, 7 or 11 swings at extreme area against 7.17.2025 low.
#nifty directions and levels for July 24Good morning, friends! 🌞
Here are the market directions and levels for July 24th:
The global market is showing a moderately bullish sentiment.
Meanwhile, the local market is also exhibiting a moderately bullish tone.
Today, Gift Nifty indicates a gap-up opening of around 60 points.
What can we expect today?
In the previous session, both Nifty and Bank Nifty took a solid pullback.
At the same time, the open interest also shifted to the bullish side.
So, if the gap-up sustains, we can expect the pullback continuation.
Also, as it’s a new moon day(for south), some volatility can be expected.
Let’s look at the charts:
Current View:
The current view suggests that, as mentioned above,
if the gap-up sustains, we can expect a rally continuation with some consolidation.
In this case, the parameters are showing slight strength,
so the rejection zone may act just around the minor resistance.
Alternate View:
The alternate view suggests that
if the gap-up does not sustain or if the market rejects near immediate resistance with a solid reversal,
then we can expect a minor correction of around 23% to 38%.
However, unless the market breaks below the 38% level,
we cannot confirm a reversal into a bearish trend.

#Banknifty directions and levels for July 24Current View:
The current view suggests that, as mentioned above,
if the gap-up sustains, we can expect a rally continuation with some consolidation.
In this case, the parameters are showing slight strength,
so the rejection zone may act just around the minor resistance.
Alternate View:
The alternate view suggests that
if the gap-up does not sustain or if the market rejects near immediate resistance with a solid reversal,
then we can expect a minor correction of around 23% to 38%.
However, unless the market breaks below the 38% level,
we cannot confirm a reversal into a bearish trend.

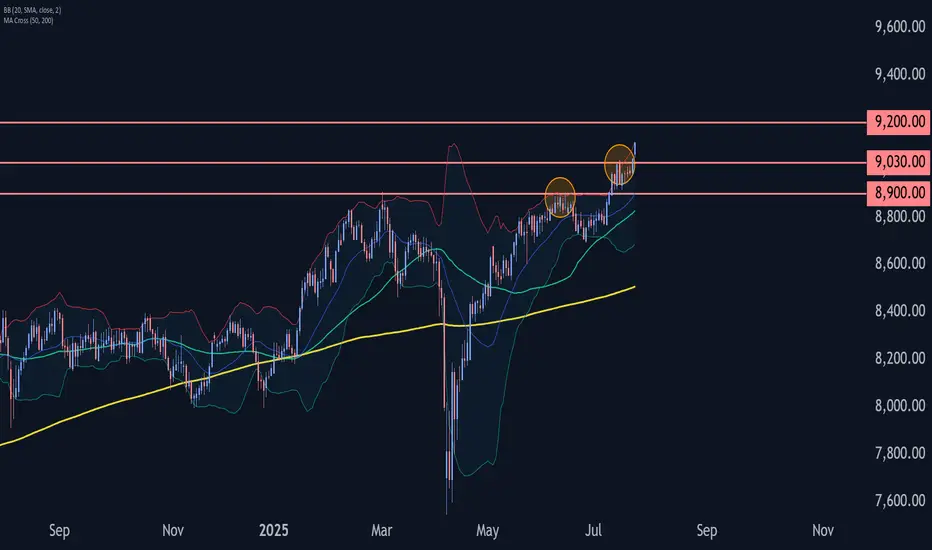
FTSE 100 Wave Analysis – 23 July 2025- FTSE 100 broke resistance level 9030.00
- Likely to rise to resistance level 9200.00
FTSE 100 Index recently broke above the resistance level 9030.00, which stopped the previous minor impulse wave 1 at the start of July.
The breakout of the resistance level 9030.00 continues the active minor impulse wave 3 – which belongs to the intermediate impulse wave (3) from the end of July.
Given the clear daily uptrend, FTSE 100 Index can be expected to rise to the next resistance level 9200.00 (target price for the completion of the active impulse wave 3).
USDCHF is Attempting to Break the Trend!!Hey Traders, in today's trading session we are monitoring USDCHF for a selling opportunity around 0.79720 zone, USDCHF was trading in an uptrend and currently seems to be attempting to break it out. If we get dips below the trend i will be looking for a retrace towards more lows.
Trade safe, Joe.

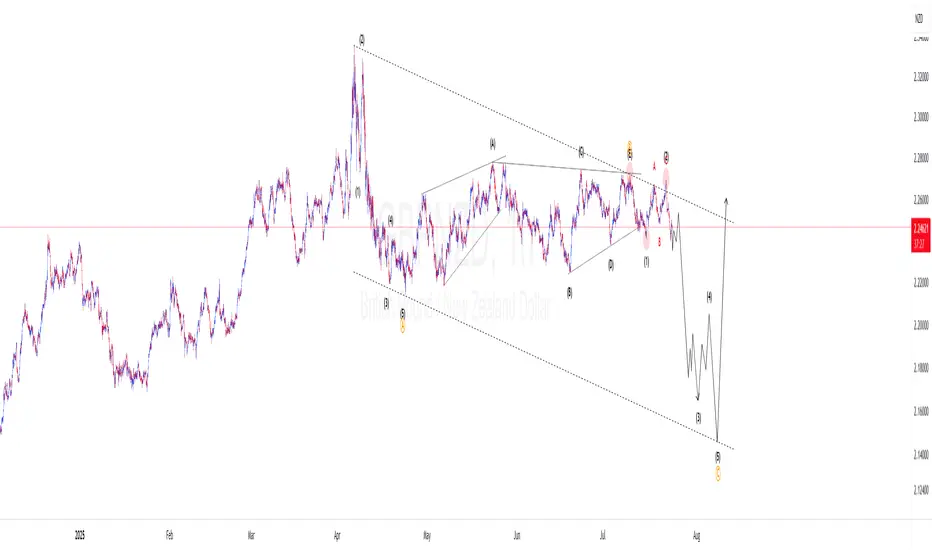
GBPNZD Elliotwaves updatePrice completed first wave of higher degree wave C. Currently price is on the lower degree wave 3. We should expect price to gain momentum to the downside creating lower lows to complete higher degree wave C. To take advantage of this short term bearish bias, one should find confluences that support a short trade.
ETH - 5500 USD in the short-term (Banks and states buying!)ETH is pumping, and altcoins with it. That means we are in an alt season, which I predicted in the previous post here on July 9, before the pump:
ETH is part of the USA crypto reserve, and banks also love this altcoin. The ETH ETF was launched, and the big players already count this coin as the future of the crypto industry. So if you are a Bitcoin maximalist, you have to convince the rulers of this world to stop buying ETH.
But we are here to make money; we don't care about the crypto technology, which is too restricting anyways. Worse than paper money or fiat or gold. Let's be honest, if there were no charts and no trading on cryptocurrency, no one would even talk about it, and the government would silently integrate this technology.
So I am very bullish on ETH in the short term, because the price is inside this ascending channel and is breaking out with strong bullish momentum. Of course you don't want to buy the top and sell the low. We are somewhere in the middle, so if you buy now, sell at 5500 USDT. This is where the market will most likely stop for a long time before going higher.
We are in an alt season because BTC.D is going down! That means some altcoins can 10x or 50x in the next weeks. This is very important - Write a comment with your altcoin + hit the like button, and I will make an analysis for you in response. Trading is not hard if you have a good coach! This is not a trade setup, as there is no stop-loss or profit target. I share my trades privately. Thank you, and I wish you successful trades!

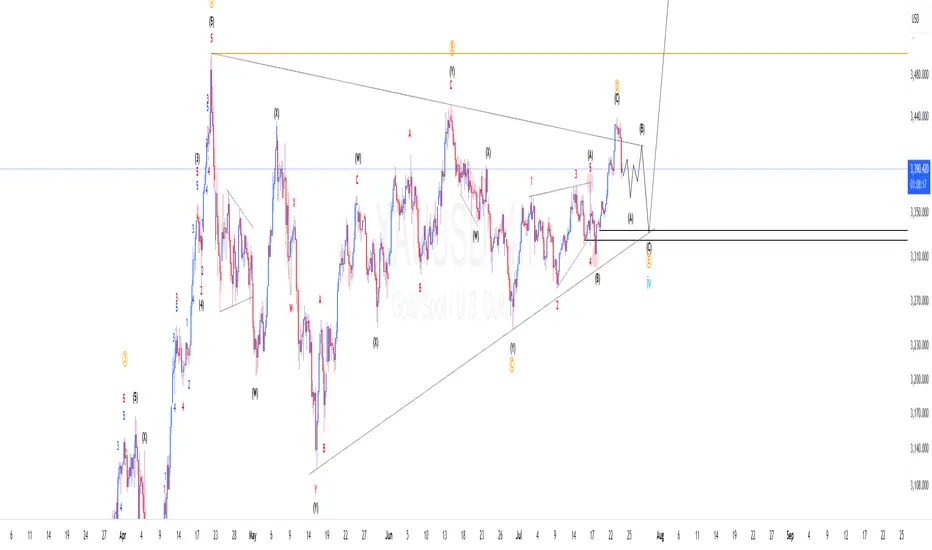
XAUUSD Elliotwaves updateWe are yet to complete wave 4. So far the structures supports the triangle correction and price completed wave "d" and started final wave "e". If we are correct we should expect price make another 3 waves down to complete wave 4 and then resume the bullish momentum. To take advantage of the overall trend one should find areas where price has high probability of finding support to take the trade.
$BONK BIG Trade setupCRYPTOCAP:BONK BIG Trade setup: Price had a bullish breakout from Channel Down pattern and has rallied to $0.000036 resistance for +140% gain. It also broke above 200 SMA, which signals resumption of Uptrend. If it breaks above that $0.000036 resistance, it could revisit $0.000050 next.

Short Opportunity on GBPUSD – Technical & Fundamentals AlignToday I want to look at the Short position opportunity in GBPUSD ( FX:GBPUSD ). So let's take a look at the GBPUSD pair from a fundamental and technical perspective.
Fundamental Analysis:
The British Pound remains under pressure due to growing expectations of a 25–50 bps rate cut by the Bank of England in early August. Markets are increasingly leaning toward easing as UK inflation hit 3.6% in June, the highest in over a year, while economic growth weakened and consumer confidence dropped to its lowest since early 2024
Ongoing fiscal concerns, including potential tax hikes and budget instability, continue to weigh on the pound. In contrast, the US Dollar( TVC:DXY ) remains relatively robust—supported by strong economic data and a safe-haven preference amid global uncertainty
Summary:
BoE easing becomes more likely due to weak UK data and inflation.
Fiscal risks and low consumer sentiment add downward pressure on GBP.
USD strength from solid data and safe-haven demand supports further GBPUSD downside.
-------------------------
In terms of technical analysis , in the 1-hour timeframe , GBPUSD is approaching the Resistance zone($1.356-$1.350) , the Potential Reversal Zone(PRZ) , and the 50_SMA(Daily) . Meanwhile, this return to Important Support lines could act as a pullback to these lines. Important support lines and 50_SMA(Daily) were broken last week.
In terms of Elliott Wave theory , GBPUSD appears to be completing a main wave 4 . Main wave 4 is likely to have a Zigzag Correction(ABC/5-3-5) .
I expect GBPUSD to start declining from the Potential Reversal Zone(PRZ) and reach the targets I have marked on the chart.
Note: Stop Loss(SL): 1.3575USD = Worst Stop Loss(SL)
Please respect each other's ideas and express them politely if you agree or disagree.
British Pound / U.S Dollar Analysis (GBPUSD), 1-hour time frame.
Be sure to follow the updated ideas.
Do not forget to put a Stop loss for your positions (For every position you want to open).
Please follow your strategy and updates; this is just my Idea, and I will gladly see your ideas in this post.
Please do not forget the ✅' like '✅ button 🙏😊 & Share it with your friends; thanks, and Trade safe.

GOLD → Consolidation before the next jump to 3450?FX:XAUUSD continues to rally, with the price updating its local high to 3438 and moving into consolidation, possibly for another jump...
After hitting a five-week high of $3,438, traders are taking a break. Optimism is fuelled by Trump's statements about the largest deal with Japan and negotiations with Canada, but uncertainty about the details of the agreements and political instability in Japan are keeping caution in check. The market is waiting for further signals on trade and political issues, which remain key factors for gold.
Technically, the dollar continues to fall, which generally supports gold. But! Gold is approaching strong resistance at 3445-3450, where growth may be temporarily halted.
Resistance levels: 3433, 3446
Support levels: 3416, 3401, 3375
As part of a local correction, gold may test consolidation support or 0.5-0.7f before continuing to rise. There are quite a few orders in the 3433-3446 zone, and it will be difficult to break through this area to reach the target. Consolidation before this level may help the rise to continue.
Best regards, R. Linda!

BITCOIN → Consolidation and compression to 116K. Correction?BINANCE:BTCUSDT.P continues to consolidate, with the price testing support at 116K, leaving behind the zone of interest at 120K-121K. Are there any chances for further growth?
(Alternative scenario (if growth to 120K does not occur))
Fundamentally, there is nothing particularly new, and the hype surrounding Bitcoin is stagnating. Technically, on D1, consolidation is underway with pressure from bears against the backdrop of an outflow of funds into altcoins. However, the dominance index is starting to rise, which could trigger some correction in the market. The price on the working timeframe, without updating local highs, is testing lows, and the latest retest of the liquidity zone is provoking a fairly aggressive reaction that could bring the price to retest the zone of interest at 120K-121K.
But! If the price is squeezed between 116K and 0.5 Fib with a gradual squeeze towards support, the chances of a breakdown and a premature fall will increase.
Support levels: 116370, 115860
Resistance levels: 119650, 120100
Technically, the market needs a breather or correction, which is generally a sign of health. The nuance with Bitcoin is that below 115860 there is no support until 112K, and if the market breaks the current consolidation boundary, the further correction could be quite deep. In the current situation, I do not yet see any drivers or reasons for another rally.
Best regards, R. Linda!


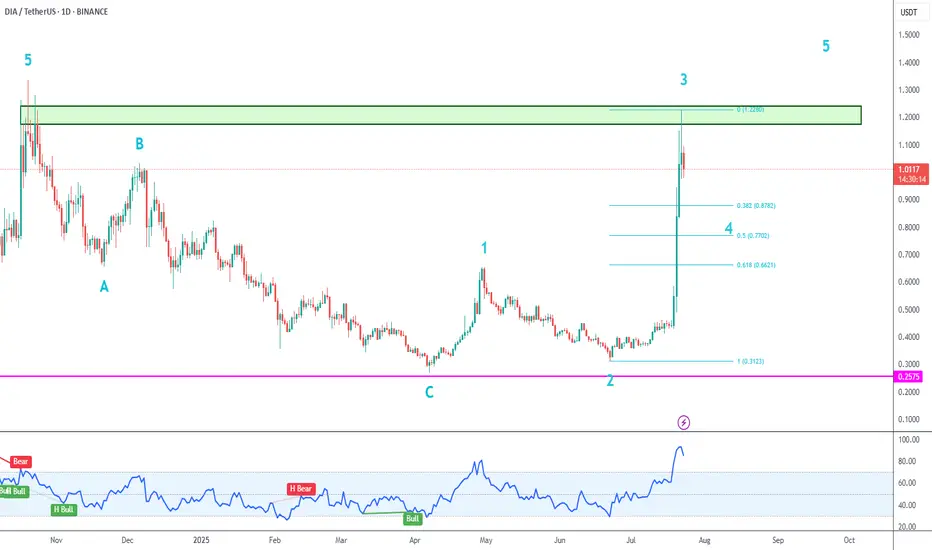
DIA Motive Wave➡️ After confirming blue wave C, price is making a motive wave with sub-waves 1 and 2 complete.
➡️ Price is initially being held by the gray supply zone, which dates from October 2024.
➡️ This high could have marked the end of wave 3. Pullbacks are buying opportunities, but I prefer to see at least a 38.2% pullback for wave 4 before looking for new long trades.
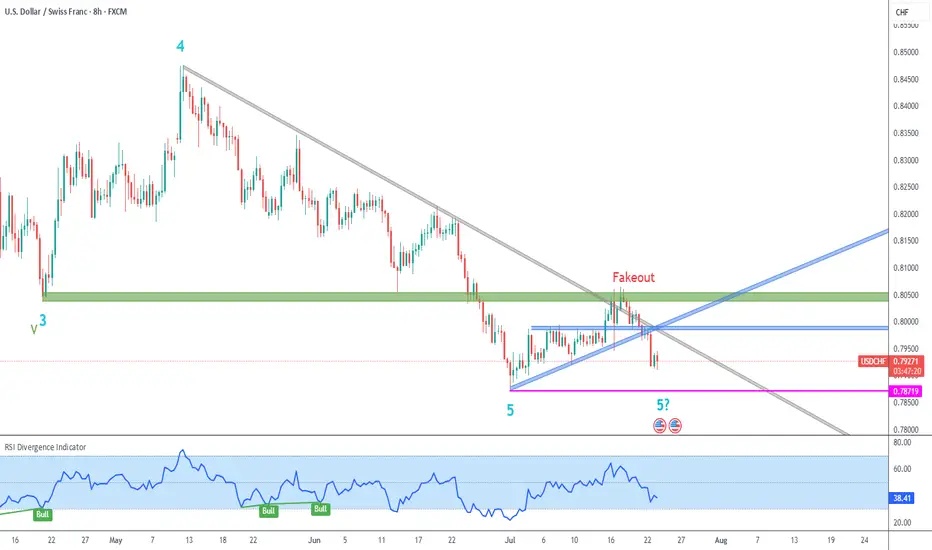
USDCHF 8H Chart Downtrend➡️ Price attempted a breakout from longer term gray descending trendline, but was held by strong green resistance, so it became a fakeout.
➡️ Price also broke down from minor blue resistance and ascending trendlines.
➡️ I had labeled the early July low as blue wave 5, but that is up for discussion, due to the lack of bullish follow-up and RSI divergence. We could still see another lower low (5?).
➡️ Current bias is definitely bearish, since there are no indications that the downtrend has finished.
USDJPY → Hunting for liquidity before the fallFX:USDJPY is changing its local trend and succumbing to global pressure. The market is seeing a change in price movement following the decline in the dollar index...
The trend has broken and the price movement has turned bearish. The fall in the dollar index is allowing the Japanese yen to strengthen, which is generally negative for the currency pair. The decline may continue after a slight correction.
Fundamentally, the dollar is correcting amid uncertainty due to the tariff war, as well as expectations of interest rate cuts.
Resistance levels: 147.20, 147.89
Support levels: 145.85, 145.23
As part of the correction, the price may test the liquidity zone of 147.7 or 0.7f. A false breakout and consolidation of the price in the selling zone may trigger a further decline in both the short and medium term.
Best regards, R. Linda!
