EURUSD is Nearing the Daily Uptrend! Hey Traders, in today's trading session we are monitoring EURUSD for a buying opportunity around 1.15800 zone, EURUSD is trading in an uptrend and currently is in a correction phase in which it is approaching the trend at 1.15800 support and resistance area.
Trade safe, Joe.
Elliott Wave

MTF bearish macro outlook on Ethereum, wave X finishedMini altcoin season over? I think we are about to see a record high amount of liquidation within the next few months.
This is not going to sit well with a lot of people I suspect.. Even if the count is technically correct, I suspect many will not see it as probable.
This is a bias based on not just Elliott waves, but internals of S&P and NQ looking week despite crawling higher this past few days. Ethereum and even Bitcoin having massive open interest (OI). Each time Ethereum has reached close to 4k area (2024 March, May, Dec, 2025 July), OI has increased significantly with high-ish positive funding rate. Almost all indicators for Bitcoin are red hot with bearish divergences. Momentum has stalled. Sentiment is ridiculously bullish.. after Bitcoin has had a 8x?
Having said that, from the last post, I was expecting somewhere around 3500-3600 region to finish the X wave. 1400 to 1800 run is impressive. But, so were the S&P, NQ, Bitcoin, and gold. I still see the recent April to July run as a 3-wave in Ethereum.
Invalidation is simple: it needs to break 4k. That would mean there are multiple 1-2's stacked in the April-to-July run..
I see 1900 as a very strong level. I suspect that's not the final destination but I expect to see a good reaction/bounce from that area. My primary target is just below 1400, the April 2025 low. Anywhere between around 1050 and 1400 should suffice, forming a massive running flat as a corrective wave 2 since 2022.

GBPUSD → Hunting for liquidity before the fallFX:GBPUSD is forming a countertrend correction towards the liquidity zone amid a correction in the dollar. Are there any chances for a trend break?
The currency pair is taking advantage of the opportunity to test the trend resistance and consolidation amid the dollar correction. Focus on the nearest resistance level of 1.3467, behind which lies a pool of liquidity relative to the local trend.
Based on the overall market sentiment (bearish), a breakout of the 1.3467 resistance could trigger a downward pullback.
Resistance levels: 1.3467
Support levels: 1.3370
If, during the retest of the specified liquidity zone, the market is unable to continue its upward movement and the price returns below the level, we will have a chance to catch a decline within the current trend.
Best regards, R. Linda!

ETH/USD Breaking Higher, Can Fill The Gap? Hey traders,
Some of the altcoins are recovering very nicely today, with Ethereum being no exception. In fact, we’ve seen a pretty nice consolidation on ETH over the last three weeks, and it looks like it’s breaking to the upside right now. I wouldn’t be surprised to see more gains unfolding into wave five of a five-wave advance away from the April lows.
Targets around 3000 and even 3300 could be quite interesting, especially if we consider the big gap that dates back to February.
GH

Jasmy long elliot wave A look at Pengu/usd with Eliot wave on the daily, lots of resistance above the current price, and with good crypto policies going into effect holding for a long long time might be profitable
and this crypto article is reason to dream ;) /cheers!
www.tradingview.com
Thanks again!

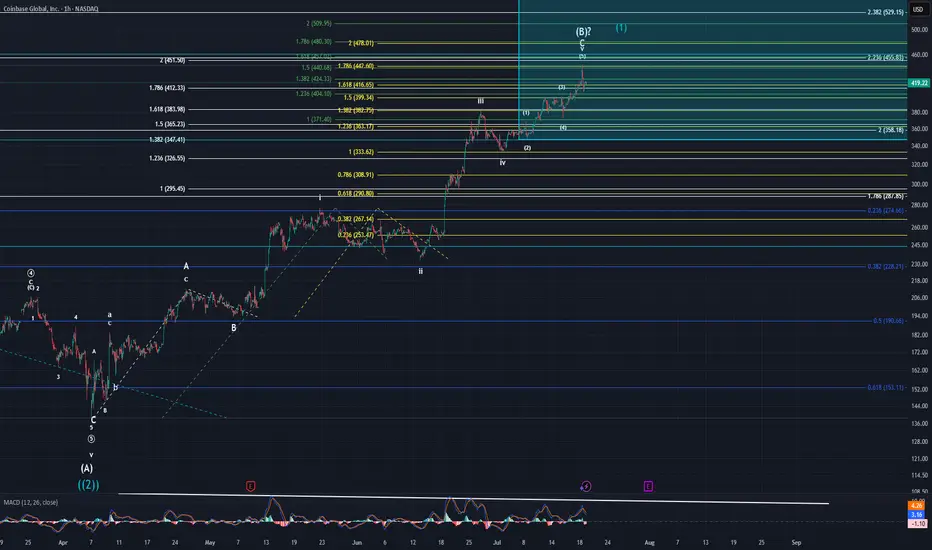
Coinbase UpdateI stated that if price broke through the yellow 1.618 @ $416 with strength that I would start to very seriously doubt the corrective count that I have. Well, it broke well through that fib only to immediately fall right back down and close only $3 away from it. Now, that being said, I am still in very seriously skeptical of the corrective pattern I am tracking. Lets start at the beginning of how I re-evaluated this pattern.
First thing I did was revisit the very beginning of the larger move higher that started way back in January 2023. I zoomed out to the monthly and then worked my way through the weekly, daily, 4hr, so on and so forth. I looked at MACD in relation to price action and notice a few things.
MACD Observations:
#1 - Monthly is still pointing higher in a strong manner.
#2 - Weekly is also pointing higher with strength and is on the verge of making a new high.
#3 - Daily just made a new ATH. This is significant given we're supposed to be in a (B) wave according to my white count.
#4 - Daily high in MACD combined with a high in price suggests eventual continued upside movement as momentum is still to the upside.
#5 - 4Hr and below is showing weakness
Now, to interpret all of this, one must know the typical correlation between price and MACD. Before, my ALT was that this was a continuation of intermediate (5) of primary ((1)). Now, after I have reflected on the recent longer-term developments, I am of a mind that this could be the intermediate wave (1) of primary wave ((3)). That would help to explain why the move down that began in Dec 2024 breached the wave 4 of a lesser degree. When you turn off log scale on the longer-term retracement fibs, it shows price slightly breached the 0.618 @ $153.11 to hit a low of $138.45. Is this the more accurate way to look at this? I cannot say for certain, but it sure is starting to seem like it.
Chris and I have been forecasting an imminent high in the overall markets for some time now. I still believe the markets are on the precipice of a super cycle wave (III) high. So how does this new possible outlook on Coinbase fit in with the overall markets dropping for the next few decades. How can it continue to move higher towards such highs while most everything else is getting hammered? Short answer, I have no idea. I have largely given up trying to link causation with events. Sure, it is fun to think about it and try to link certain things towards price action. In the end though, what does it really matter? All I care about is WHAT price does. Not WHY it does it.
For now, I am still stuck in not being able to make a decision on which count I prefer more. After this last week or two of price action I am beginning to strongly lean towards Coinbase entering into a new bull phase in the form of primary wave ((3)). The main problem I have with wave ((3)) though is that would suggest that primary wave ((2)) only lasted for four months whereas primary wave ((1)) lasted for two years. There are no rules that says this cannot be the case. It is odd for sure though.
Rather this is wave (1) of ((3)) or wave (B) of ((2)), price is overextended and does need a consolidation of the gains made in the last four months. As of now, if we have a top or only make a minimal new high, I forecast that retracement will fall to sub $300 easily and likely $250 to as low as $170. Once we have a larger abc pattern down from a top, that will be a GREAT time to go long. Worst case scenario, I will ride the minor B wave higher if it is a larger corrective pattern. Best case scenario, I ride the wave (3) of ((3)) to all time new highs. Obviously, it goes without saying one needs to keep their assets protected no matter what happens.
P.S: I am sorry the chart looks a little messy. I thought it pertinent to leave the three different fib extensions to give you as much information possible as to what prices possible intentions are. There is a lot of information in this post. PLEASE let me know if you have questions or I left anything unanswered.
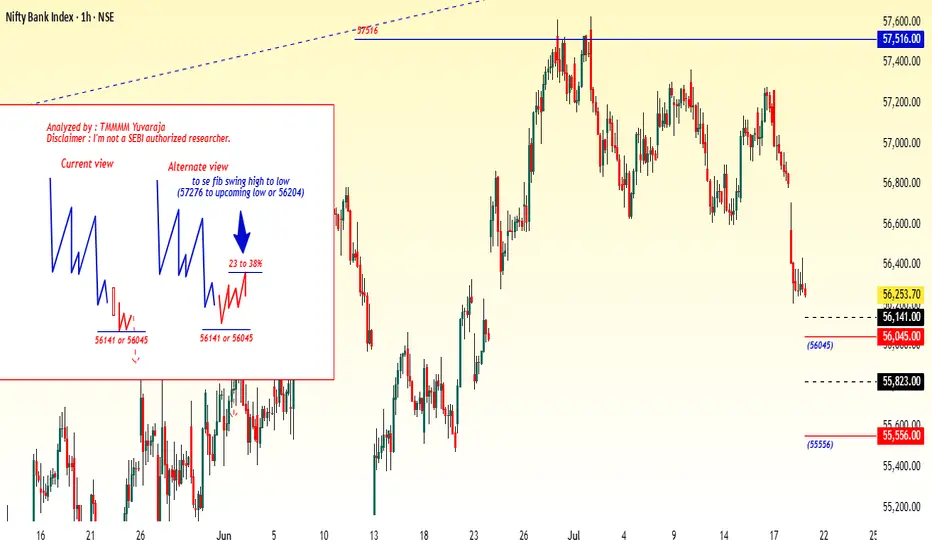
#Banknifty directions and levels for July 21st:What can we expect today?
In the previous session, both Nifty and Bank Nifty fell sharply. Structurally, the trend remains negative.
However, due to major firms' results, we might see some volatility in the first half, possibly leading to initial speculation.
That said, as per the structure my expectation is a continuation of the correction that's my current view
The alternate view is If the market takes an initial pullback, we could see a 23–38% retracement in the minor swing. Even in this scenario, the bias remains bearish unless the 38% Fibonacci level is broken.
A break above 38% could extend the pullback toward the 50–78% levels.
#Nifty directions and levels for July 21st:Good morning, friends! 🌞
Here are the market directions and levels for July 21st:
The global market shows no major changes and continues to maintain a moderately bearish sentiment.
Meanwhile, the local market is exhibiting a bearish tone. Today, Gift Nifty indicates a neutral to slightly gap-down start,
around 30 points negative.
What can we expect today?
In the previous session, both Nifty and Bank Nifty fell sharply. Structurally, the trend remains negative.
However, due to major firms' results, we might see some volatility in the first half, possibly leading to initial speculation.
That said, as per the structure my expectation is a continuation of the correction that's my current view
The alternate view is If the market takes an initial pullback, we could see a 23–38% retracement in the minor swing. Even in this scenario, the bias remains bearish unless the 38% Fibonacci level is broken.
A break above 38% could extend the pullback toward the 50–78% levels.

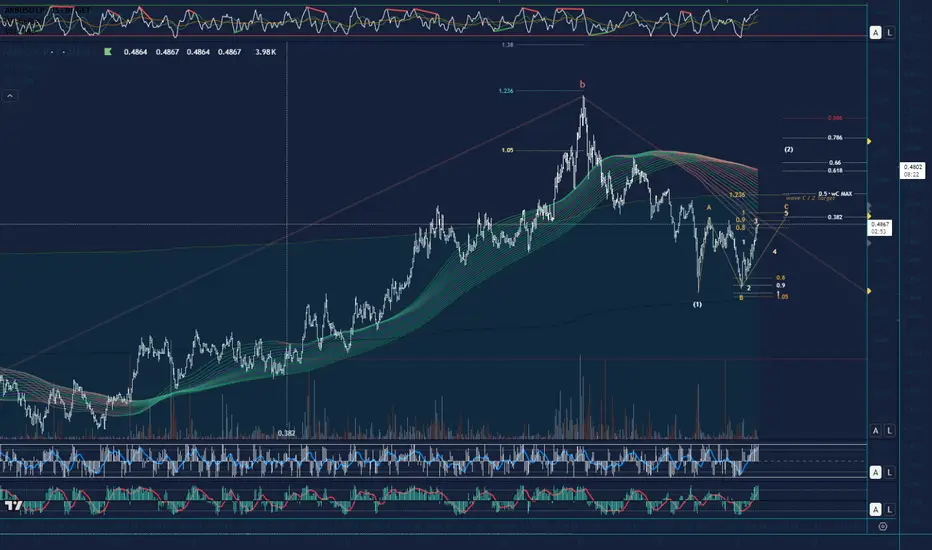
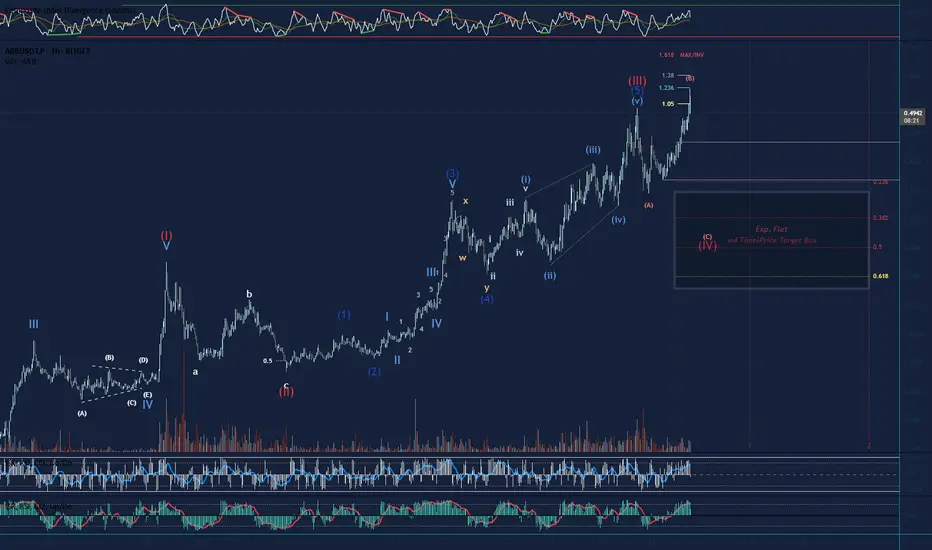
Update on Arbitrum Expanding FlatZooming in on the 3min TF the Target for completion of wave C of regular flat (White wave 2 retracement) will be 0.4888. Looking to reverse lower at this level to complete the white impulse down for wave C of larger degree Expanding Flat (See earlier post for HTF count)
Bitcoin Technical Setup: Support Holds, Eyes on $118,600Bitcoin ( BINANCE:BTCUSDT ) moved as I expected in the previous ideas and finally completed the CME Gap($117,255-$116,675) in the last hours of the week. ( First Idea _ Second Idea )
Before starting today's analysis, it is important to note that trading volume is generally low on Saturday and Sunday , and we may not see a big move and Bitcoin will move in the range of $121,000 to $115,000 ( in the best case scenario and if no special news comes ).
Bitcoin is currently trading near the Support zone($116,900-$115,730) , Cumulative Long Liquidation Leverage($116,881-$115,468) , Potential Reversal Zone(PRZ) , and Support lines .
According to Elliott Wave theory , Bitcoin had a temporary pump after the " GENIUS stablecoin bill clears House and heads to Trump's desk " news, but then started to fall again, confirming the end of the Zigzag Correction(ABC/5-3-5) . Now we have to wait for the next 5 down waves or the corrective waves will be complicated .
I expect Bitcoin to rebound from the existing supports and rise to at least $118,600 . The second target could be the Resistance lines .
Do you think Bitcoin will fill the CME Gap($115,060-$114,947) in this price drop?
Cumulative Short Liquidation Leverage: $121,519-$119,941
Do you think Bitcoin can create a new ATH again?
Note: Stop Loss(SL)= $114,700
Please respect each other's ideas and express them politely if you agree or disagree.
Bitcoin Analyze (BTCUSDT), 15-minute time frame.
Be sure to follow the updated ideas.
Do not forget to put a Stop loss for your positions (For every position you want to open).
Please follow your strategy and updates; this is just my Idea, and I will gladly see your ideas in this post.
Please do not forget the ✅' like '✅ button 🙏😊 & Share it with your friends; thanks, and Trade safe.

Final Phase of Circle Wave 3 XAG/USDFXOPEN:XAGUSD
We’re currently in the final stages of Circle Wave 3, which has developed through a series of 1–2–3 structures and internal ABC corrections.
Right now, we’re within the yellow count, moving from Wave 4 to Wave 5 – typically unfolding as an ABC structure.
🟡 Zooming In: Current Setup
✅ Wave A (of 4→5) is already complete – it formed as its own ABC
🔄 We’re currently transitioning from A → B
📈 A short-term move up is likely before a short entry targeting the final Wave C of 5
📏 Key Fibonacci Confluence Zone
I’ve marked the 71% extension level in green – it aligns perfectly with my broader Fibonacci target zone, where we could see the highest volume come in
My personal limit sell is at 37,700, inside this confluence zone
🛑 Stop-loss: 37,500 (below Wave 4)
🎯 Take-profit: Around 39,260, though this area could extend higher depending on momentum
💡 Trade Idea Summary
A clean, simple setup:
Look for upside push (Wave B)
Set limit short in the Fib zone (green area)
Watch for reversal into Wave C to complete Circle Wave 3
After that, I’ll be looking for mid- to long-term short setups 🔽

XAU/USD Analysis – Wave 2 Still in ProgressOANDA:XAUUSD
We're currently in a corrective structure following our Circle Wave 3.
✅ (A) and (B) of the correction are already complete.
🔽 Now we're in the development of Wave (C), which should unfold as a 1–2–3–4–5 structure.
📌 Current Situation
Wave 1 of (C) was very impulsive – a strong move confirming the structure
We're now in Wave 2, which is developing as a classic ABC correction
✅ Circle A and Circle B are complete
🔄 Currently transitioning from Circle B to Circle C
🧠 Market Insight
We’ve already seen the first touch of the Fib zone, but I don’t believe that marks the end of Circle C just yet – the time duration of B → C is too short compared to 1 → A and A → B.
That's why I expect a smaller degree correction playing out now:
→ (A) → (B) → (C) (lower timeframe within Circle C)
Alternatively, the whole 1 → 2 could even unfold as an A–B–C–D–E triangle, though I personally prefer ABC structures for cleaner setups and better trade entries.
📈 Trade Setup
There are two short setups currently marked in the chart:
Sell from small B → small C
🎯 Take-Profit: Aligned with Fib Extension Zone near 3400
🛑 Stop-Loss: Just above the small A
Sell from small C extension move
🛑 Stop-Loss: Below (B)
🎯 Target: Also around the major Fib confluence zone at 3400
📊 Conclusion
✅ Wave (1) done
🔄 Wave (2) still unfolding as complex ABC
⚠️ Be patient for confirmation of small B → C
🟢 Fib zones aligned – volume expected around 3400
🧩 Clean setups preferred over triangle flags

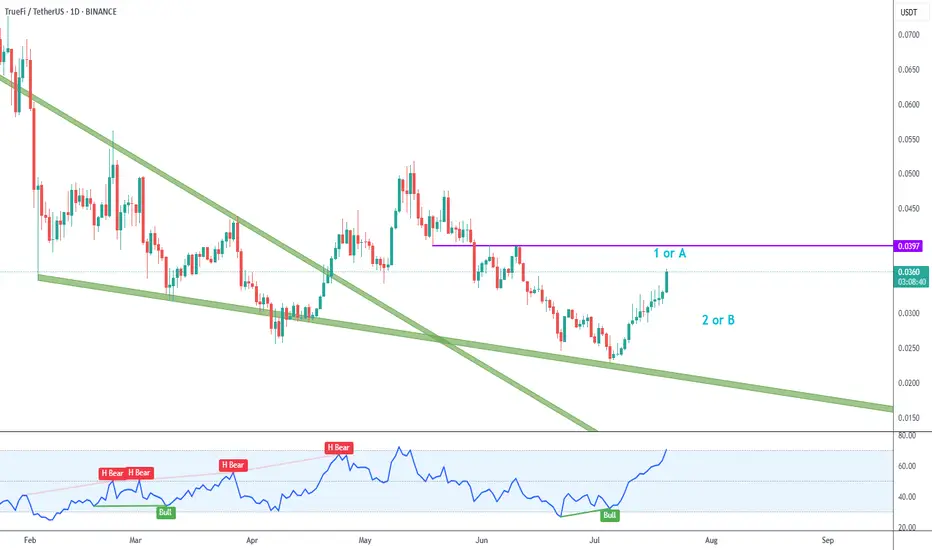
TRU Upside Reversal
Truefi´s recent upside after touching the green descending trendline looks convincing, with a motive wave and bullish RSI divergence.
I´m labeling this as wave 1/A.
Right now price is overbought, so I´ll wait for wave 2/B pullback to look for long trades.
Next key resistance zone is just below 0.04.
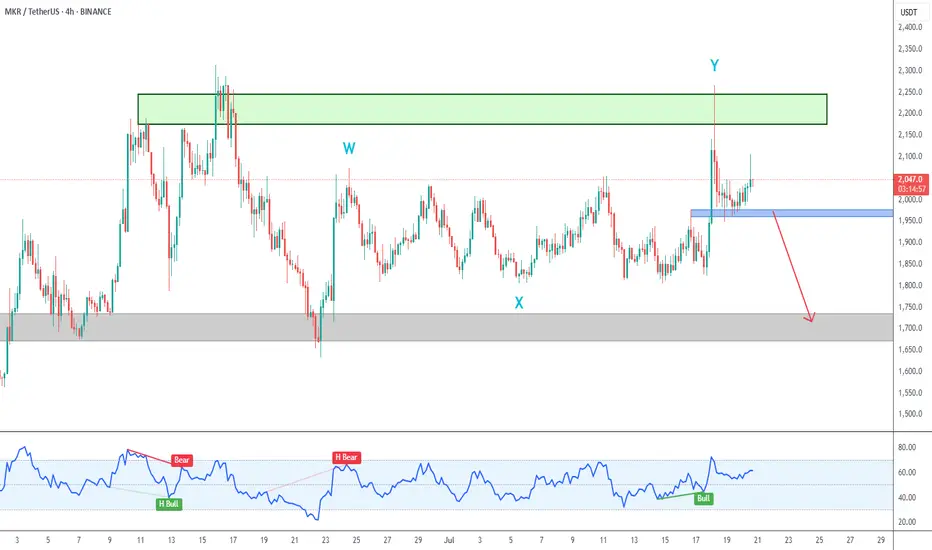
MKR 4h Chart Analysis
On the 4H Chart the 2,200 supply zone proved to be too strong for bulls, and there was a strong rejection.
My primary count considers that was wave Y, and I´m currently neutral to bearish.
A break of blue support zone around 1,970 should take us to another retest of 1,700 support.
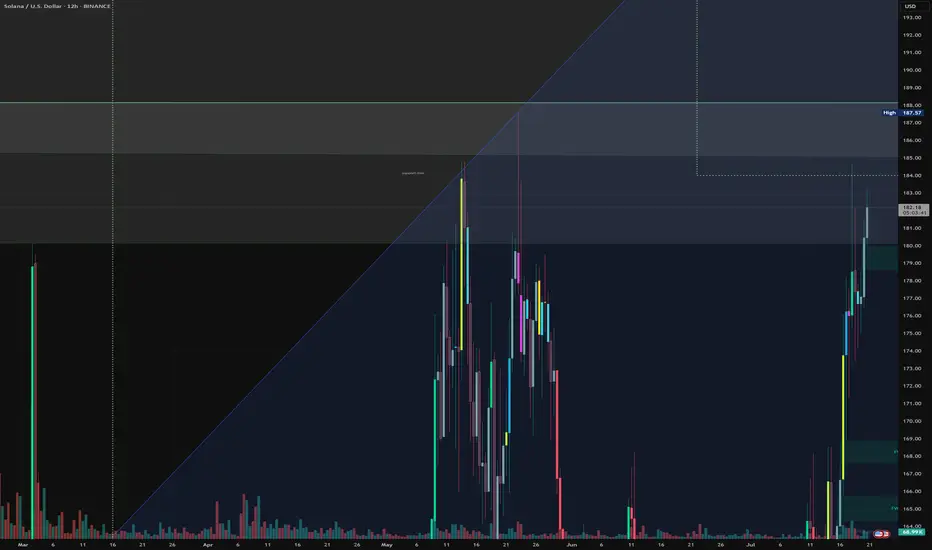
SOLANA - BULLISH & BAERISH
Hello everyone,
here is my current outlook on Solana (SOL):
Personally, I am currently only watching Solana as we may already be in a correction phase. Nevertheless, there is an interesting scenario where we could still be in a green wave 5, which could potentially reach prices above USD 300.
Possible course:
In April 2025, the bottom may have been found following an ABC formation.
Wave 1 (yellow) could be completed in May 2025.
Wave 2 (yellow) could end in June 2025.
We could currently be in wave 3 (yellow).
Important point to watch:
If the price does not make it sustainably above the yellow wave 1 (approx. USD 190), the probability increases strongly that we are still in a B wave.
This would mean that we are still in a major correction, which could theoretically take us back to around USD 60. In this scenario, wave 1 would have already ended in January 2025 and we would still be in the correction of wave 2.
Conclusion:
The indicators are particularly important in this phase. Keep a close eye on them to better understand the structure.
Looking to complete a wave 4 Retracement on Arbitrum Short term outlook is bearish as we are looking to complete an expanding flat to the downside. Wave B neared it invalidation, but reversed down. Lets see if the bears can push it down to the 0.5 Fib Target, soft target is the 0.382 Fib. If volume increases this could be a third up, but we need the wave 4 at the moment, and wave B of the expanding flat is a clear 3 waver so far. Long term we are still bullish with plenty of nested wave 3s to keep us counting to the upside in the future haha. Not Financial Advice
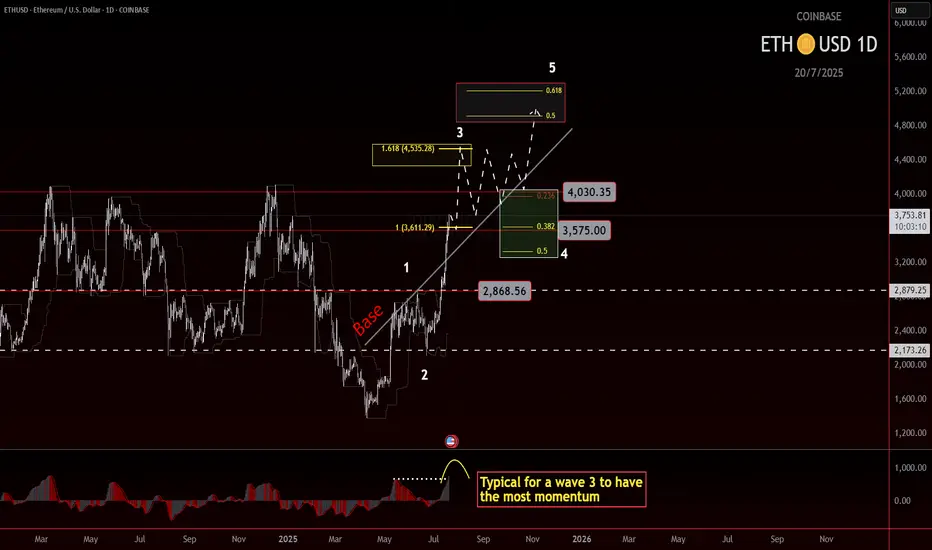
ETH roadmap to 5000!Ethereum Wave 3 in Play? Eyes on the $4500 Target
Ethereum may currently be progressing through a wave 3, which is often the strongest leg of an impulse. The structure so far supports that idea, and based on standard projections, the most likely target sits near $4500.
If price can break and hold above the 4k level, we could see a consolidation forming above the previous high. That would be a constructive sign and might set up the next leg higher.
But there’s still a chance ETH struggles to clear that level. If that happens, consolidation could form just underneath, which would still be acceptable within a wave 3 framework. What matters next is the shape and depth of the pullback.
Wave 4 will be the key. A shallow or sideways correction would keep bullish momentum intact. A deeper pullback doesn't ruin the structure, but it does mean we’ll need to watch support zones more closely.
If wave 4 behaves well and broader market conditions stay supportive, then a final wave 5 could bring ETH into the $5000 region. That’s the upper edge of this current roadmap, based on conservative assumptions.
Stay flexible. Let the structure guide the bias.
AUDUSD Potential UpsidesHey Traders, in tomorrow's trading session we are monitoring AUDUSD for a buying opportunity around 0.64200 zone, AUDUSD is trading in an uptrend and currently is in a correction phase in which it is approaching the trend at 0.64200 support and resistance area.
Trade safe, Joe.

$SHIB Ready to Move?CRYPTOCAP:SHIB has printed confirmed weekly bullish divergence in RSI and is now attempting to overcome the weekly 200EMA resistance.
A High Volume Node lies just above but a close above this will signal a bullish trend ready to move the initial target of the weekly pivot point followed by the 0.0003579 High Volume Node.
Price completed its retracement to the 'alt-coin' golden pocket 0.786 Fibonacci retracement.
Bearish divergence is currently growing on the weekly RSI but will be diverted with a thrust high!
Is it MEME season? CRYPTOCAP:DOGE also looks ready to go!
Safe trading

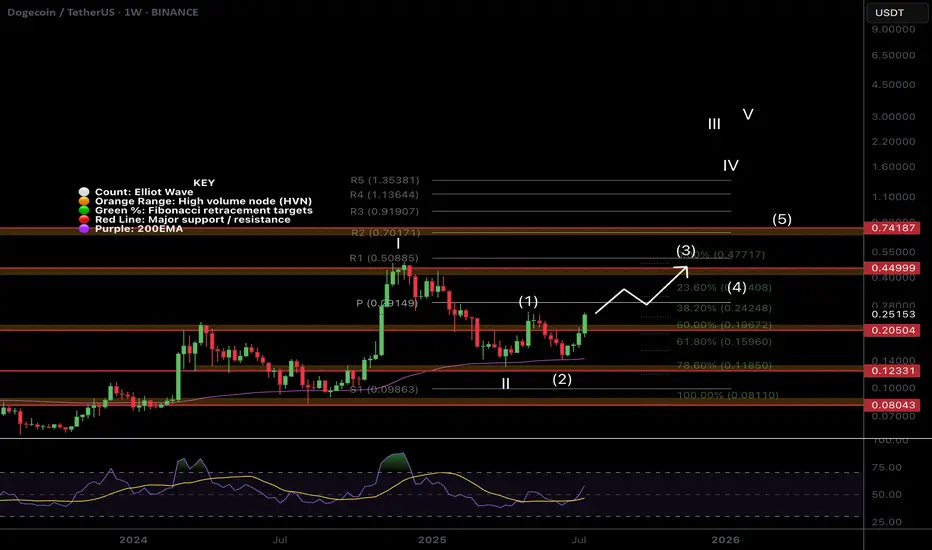
$DOGE Flipping to Bullish Structure!CRYPTOCAP:DOGE is coming to life after a second test of the weekly 200EMA as support and about to make a higher high, cementing in that higher low and flipping the macro structure bullish!
If the count is correct wave 3 of (III) should be powerful! The weekly pivot should put up a challenge as the first resistance before the High Volume Node at $0.45
Safe Trading
BTC Ready for the new impulse ? Elliott wave analysis 20/7/2025In my view, Bitcoin (BTC) has completed its micro correction and is now poised to move toward the $135,000–$139,000 target zone. This expectation is supported by the following factors:
1. Completion of the Sub-Waves in Wave (4)
My analysis of wave (4) indicates that it consists of an ABC correction, where wave B formed a WXYXZ pattern.
Additionally, I have counted the sub-waves within wave C of wave (4) and observed a complete 5-wave structure, suggesting that the fifth wave of wave C has ended, confirming the completion of wave (4).
2. Cypher Harmonic Pattern Pivot Point
I have identified a Cypher harmonic pattern with a pivot point around $116,600.
The termination of wave (4) occurred close to this pivot level, followed by a new impulsive move that made a higher high and formed a clear 5-wave structure—further confirming that wave (4) has likely ended.
3. Hidden Bullish Divergence on the 4-Hour Timeframe
A hidden bullish divergence can be observed on the 4-hour chart, particularly at the end of wave (a) and wave (c).
Historically, 4-hour hidden bullish divergences have often preceded strong bullish impulses. For instance, a similar setup occurred during the bullish rally from April 9, 2025, to May 22, 2025.
4. Failure to Make a New Low After Resistance Retest
The new impulse wave that emerged after the end of wave (4) has met resistance but failed to make a new low, suggesting that a fresh upward impulse is underway.
How Far Could Wave (5) Extend?
It is important to note that the wave (5) (blue) impulse is a sub-wave of wave (5) (purple).
The lengths of wave (3) (purple) and wave (5) (purple) are currently similar, which is unlikely because both are part of the major wave V (green), where typically only one wave should extend.
Since wave (3) has already completed, wave (5) is likely to be the extended wave, with a target length between 1.272 and 1.618 times the length of wave (3).
Interestingly, two Gann fan projections point to resistance levels in the $135,000–$139,000 range, which perfectly aligns with this 1.272–1.618 extension zone.
Invalidation Point
The invalidation level is around $117,000, as the micro correction within the new impulse should not drop this low.
If BTC falls below $117,000, it could imply that wave (4) has not yet completed and may be taking another corrective form.
For example, the wave (c) we currently see might only be wave 1 of a larger wave (c), or the correction in wave (b) may still be ongoing.
However, this scenario seems unlikely given the weight of evidence suggesting that wave (4) has already ended.

copran impulse wave is in its way to make new highs ,, i think 0.87 will be easy to be shocked very soon ,,,, 61% level is a strong support now

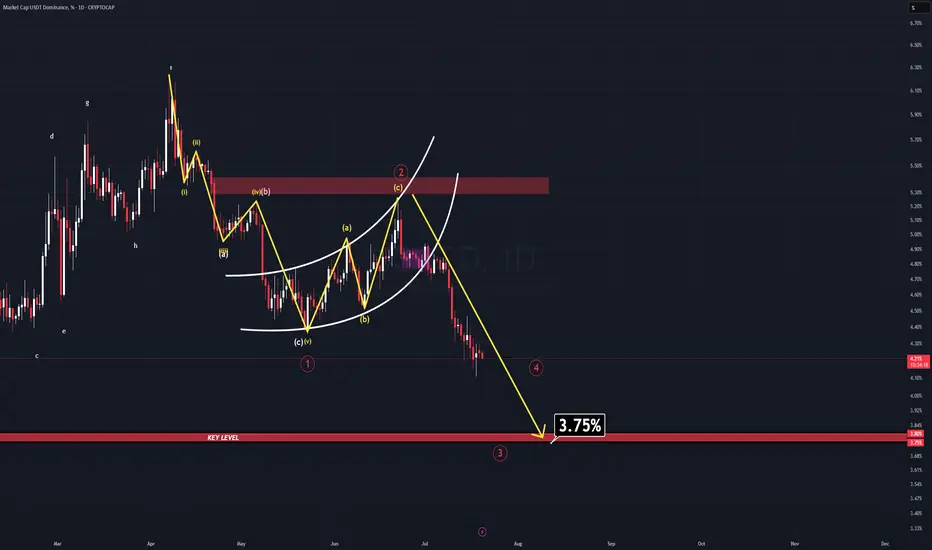
USDT DOMINANCE NEW UPDATE (1D)In a previous analysis, I mentioned that the long-term outlook for this parameter (USDT.D) remains extremely bearish. At the time, a bear flag was clearly visible—but it hadn’t been broken yet.
Well, now it has.
The breakdown confirms the bearish continuation, and there’s still more room to fall. As USDT.D continues to descend towards the projected target for Wave 3, we are likely to see a new All-Time High in Bitcoin, accompanied by a strong rally in many altcoins.
The main target for Wave 3 sits at 3.75%—a historically critical level. For years, USDT.D has never fallen below this zone, making it an extremely strong support area.
⚠️ Reminder: Consider taking profits when USDT.D approaches the 3.80–3.75% region. A reversal or temporary bounce is highly likely there.