Haliburton: Will Bears Pounce at Key Level?Energy has resumed its bearish ways lately as geopolitical risk goes out of the market, but plenty of supply keeps coming in! Just yesterday, International Energy Agency Head Fatih Birol predicted an oil surplus of 1 million barrels in the first half.
Halliburton is one of the biggest names in the sector, and one of the most active underliers in terms of options activity. That creates the potential for leveraging even small moves with puts.
HAL is also at a key level around $24. Chart watchers may look for a retest of recent lows near $18 -- or lower -- if that area breaks. MACD is signaling bearish momentum, as well.
The company reported strong earnings yesterday, which has supported its stock price. But rival Schlumberger fell despite similarly positive news on Friday. Will HAL follow?
"The trend is your friend," as the old saying goes. The long-term trend has been downward in energy. And now, after a period of consolidation, the bears may be prowling again in this sector.
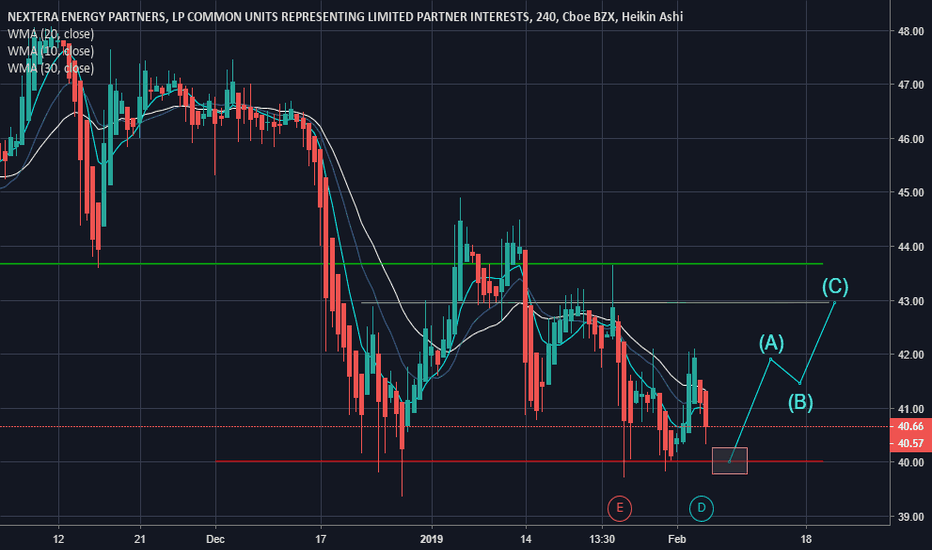
Energystock
XLE Ascending Triangle to be formed While the horizontal line continues to be drawn along the swing highs, and a rising trendline to be drawn along the swing lows, XLE is forming the ascending triangle pattern as a bullish information. The target could be taken at the horizontal line which also considered a resistance and a stop loss could typically be placed just outside the pattern on the lower band which is at roughly 58-59 levels.
On the fundamental side, here comes the news as Supply threats push oil prices higher.
Crude futures surged as much as 1.7% overnight amid threats to supply, but have now pared some gains, up 0.5% to $58.86/bbl.
Forces loyal to Libyan commander Khalifa Haftar blocked exports at ports under his control, causing the National Oil Corp. to declare force majeure, which can allow Libya to legally suspend delivery contracts.
Iraq also temporarily stopped work on an oil field on Sunday and supply from a second production site is at risk amid widespread protests.
Besides , during 1/2 through 1/13 sessions, there were some bullish bets detected on the options chain that total valued around 1.32 million long calls strike from 61.21 to 65.21 expiring in Feb, March and Jun.
EVRG BULL FLAGEVERG has seen some nice accumulation and the presentation of a massive bull flag on the weekly chart. MACD supports this with a rising trend in bullish territory. Also a large volume spike.
XEC Energy Sector Based LongBuying Call Debit Spreads for the middle of November. Trying to capture the earnings move (I think higher) with as little risk as possible.
Refer to my Energy Sector Analysis for this week.
HAL comeback for a great profit taking to the upsideLooking at the chart it looks like HAL will be going to the upside with an expanding flat that momentum is going to the upside and will jump to the upside with energy making a comeback. The bollinger bands also show that an inflection point is going to be coming while momentum indicators show a possible trend to the upside.
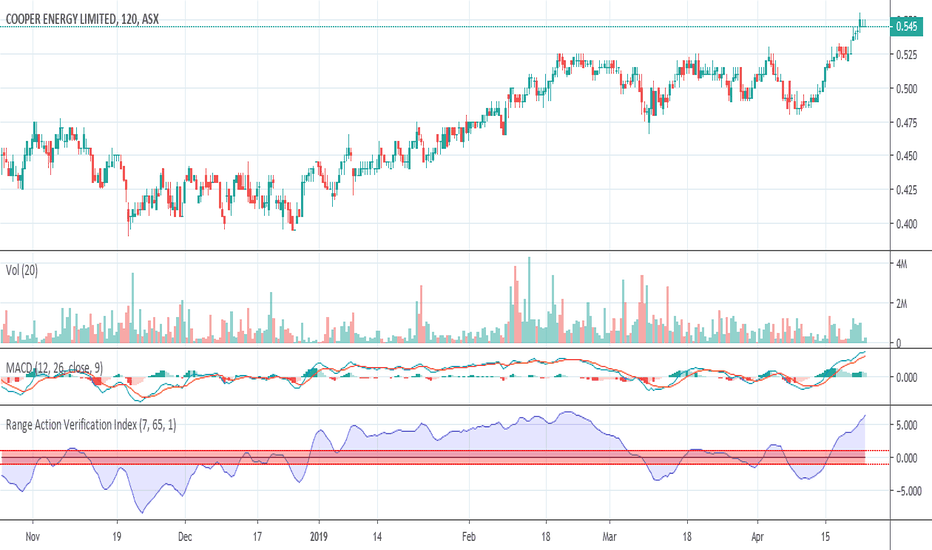
Cooper Energy continues to track north...Cooper Energy Limited ( ASX:COE ) is an energy company which focuses on exploration and production in oil and gas. COE has a portfolio comprising of prospective acreage in the Cooper, Otway and Gippsland basins Australia. As the Sole gas project draws closer to completion (expected end of May) there is more interest being generated, with CBA and its related entities recently taking a larger stake.
Disclosure: We are already holding this stock.
Western Uranium & VanadiumWSTRF is US micro mining stock with two valuable metals with upward pricing.
WSTRF
Uranium Oxide and Vanadium Pentoxide
Mkt Value is micro at 47M, so going upward based on its natural ore resource assets.
Was down near 32-33% and up 21.5% today.
Play with own money, no advice given. Do own research on high strength steel and nuclear power (no CO2 output) and gaps in both resources for next 1-5 years.
CPGInteresting little find CPG in the energy sector. Looks to be rallying to 1.50. Expecting a slight retrace and then the continuation of growth.
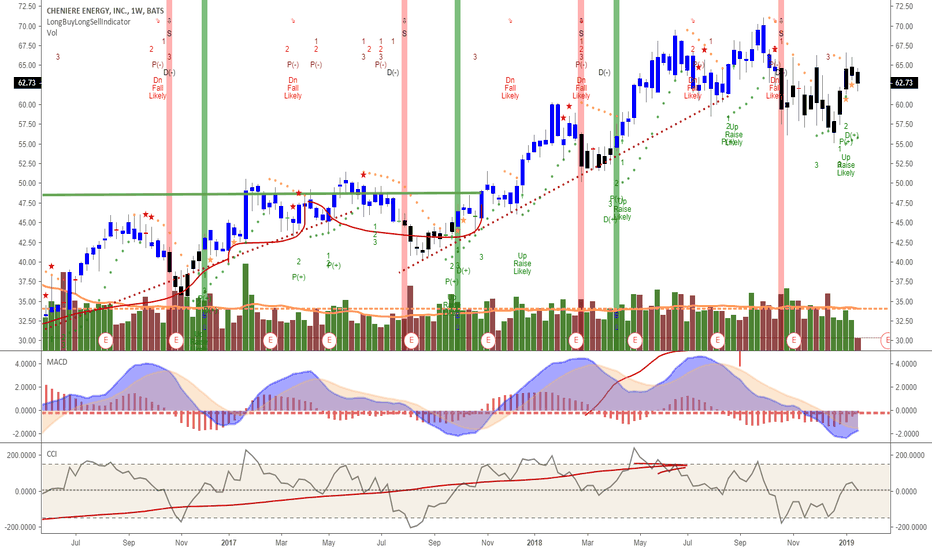
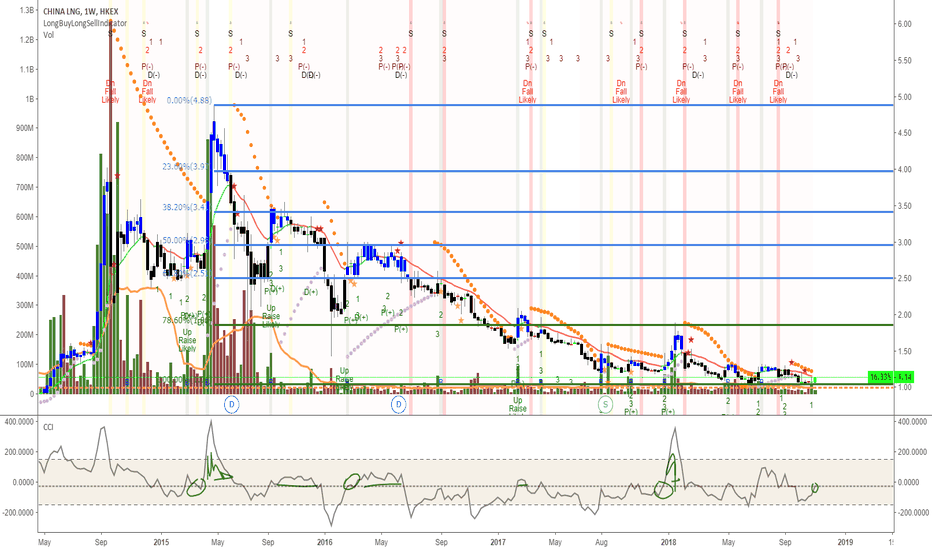
LNG winter fuel use time: MACD and CCI entry signalsOn weekly candlestick chart, MACD is shown crossing over and CCI at 0, but on downward slope at $62.73.
Await 2nd LNG port set-up and exports looking positive as cold weather driving use. LNG will also be a growing industrial energy fuel to replace coal and oil energy plants, as 30% lower CO2.
Nuclear and solar are only better ones and solar equipment costs not net zero CO2. Nuclear has proven solid long term CO2 near zero source (add CO2 output to make plant, deliver fuel).


