ENJUSDT Forming Falling WedgeENJUSDT is forming a clear falling wedge pattern, a classic bullish reversal signal that often indicates an upcoming breakout. The price has been consolidating within a narrowing range, suggesting that selling pressure is weakening while buyers are beginning to regain control. With consistent volume confirming accumulation at lower levels, the setup hints at a potential bullish breakout soon. The projected move could lead to an impressive gain of around 90% to 100% once the price breaks above the wedge resistance.
This falling wedge pattern is typically seen at the end of downtrends or corrective phases, and it represents a potential shift in market sentiment from bearish to bullish. Traders closely watching ENJUSDT are noting the strengthening momentum as it nears a breakout zone. The good trading volume adds confidence to this pattern, showing that market participants are positioning early in anticipation of a reversal.
Investors’ growing interest in ENJUSDT reflects rising confidence in the project’s long-term fundamentals and current technical strength. If the breakout confirms with sustained volume, this could mark the start of a fresh bullish leg. Traders might find this a valuable setup for medium-term gains, especially as the wedge pattern completes and buying momentum accelerates.
✅ Show your support by hitting the like button and
✅ Leaving a comment below! (What is your opinion about this Coin?)
Your feedback and engagement keep me inspired to share more insightful market analysis with you!
ENJBTC

ENJUSDT UPDATEENJ
UPDATE
ENJ Technical Setup
Pattern: Falling Wedge Pattern
Current Price:
Target Price:
Target % Gain: 110520%
Technical Analysis: ENJ is breaking out of a falling wedge pattern on the 1D chart, signaling bullish potential. The price has recently surged above the resistance trendline, supported by an increase in volume. The setup is validated as the price approaches key resistance areas.
Time Frame: 1D
Risk Management Tip: Always use proper risk management.

ENJ Sell/Short Signal (15M)It seems the market is waiting for the FED news on October 10.
That’s why market volatility has decreased, and we are forced to trade on lower timeframes.
The stop loss, entry zone, and targets are marked on the chart.
If you enter this position earlier, the risk-to-reward ratio will be lost. If price returns to the entry zone, we can enter the trade. Please note that if the final target is hit and then price comes back to the entry zone, we will not enter again.
Do not enter the position without capital management and stop setting
Comment if you have any questions
thank you

ENJBTC 2017, 2019, 2021 & 2025 (530% Easy Target)This is another interesting BTC trading pair—ENJBTC. I am only showing a portion of the chart, the bottom and falling wedge pattern but the decline has been happening since November 2021.
There have been three bull markets on this pair: Late 2017, 2019 and 2021.
» In late 2017 ENJBTC grew 1,622% in 68 days.
» In the 2019 bull market, ENJBTC grew 1,199% in 206 days. The meat of the move happened in 116 days.
» In 2021, the most astonishing Cryptocurrency bull market ever, until 2025 that is, ENJBTC grew 1,756% in 96 days. It took an additional 231 days for a double-top and the final all-time high. From bottom to top the 2021 bull market produced 2,180% growth in 327 days.
Now we are looking at a completely different situation. The longest bear market ever and a true all-time low are now present on the chart. The mapped targets are super easy, 300% and 530%, ENJBTC can grow so much more in the coming months. You can aim for 1,000% or higher.
This is just a friendly reminder, so that you can enjoy great timing and entry prices.
Thank you for reading.
Namaste.

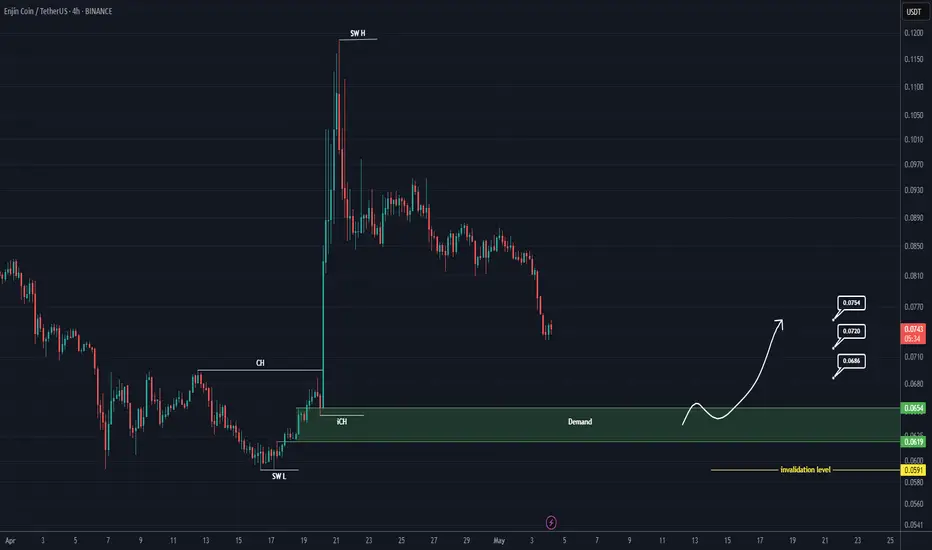
ENJ Buy/Long Setup (8H)After a bullish move and the formation of a strong change of character (CH), followed by a FOMO-driven ENJ rally, the price is now approaching support zones. In areas where strong buyers were previously active, we can look for a buy/long position.
The origin of this move is expected to hold, and price is likely to move toward higher zones.
We are looking for a buy/long position around the demand zone.
Targets are marked on the chart.
A daily candle close below the invalidation level will invalidate this analysis.
For risk management, please don't forget stop loss and capital management
When we reach the first target, save some profit and then change the stop to entry
Comment if you have any questions
Thank You
ENJ planThis is my ENJ plan. I exptect us to stay in the orange box. If we go down it will be a deviation.

TradeCityPro | ENJUSDT Analysis Christmas Holiday👋 Welcome to TradeCityPro Channel!
Let’s analyze ENJ during the holiday season and identify triggers across different timeframes to make the most of market opportunities. Don't forget to check the Signature section at the end for updates! 😊
🌐 Overview Bitcoin
Before diving into ENJ analysis, let’s look at Bitcoin. It broke the 95445 short-term support and is expected to move toward the 92722 support, where it might form a new structure. Key support levels for Bitcoin are 91K, 86K, and 81K, which hold significant importance.
Additionally, Bitcoin dominance is also dropping, forming red candles during this decline. This means the market as a whole is correcting:
Coins bullish against BTC are correcting less, Coins bearish against BTC are showing more red candles than Bitcoin itself.
📊 Weekly Timeframe
ENJ hasn’t shown significant movement. After breaking its smaller box resistance, it entered the larger timeframe box, only to get rejected from the upper boundary and return to the entry point of its box.
The 0.3743 resistance has become increasingly important. Once broken, it could signal a buy opportunity, preparing for a potential break of 0.6920. However, ensure the breakout is accompanied by increasing green candle volume and confirmation through RSI surpassing 83.90.
If you are holding ENJ and looking to activate your stop loss to exit, it’s logical to sell after breaking 0.1256 and closing a weekly candle below it. Always take stop losses seriously and look for re-entry triggers later.
📈 Daily Timeframe
After hitting the 0.3838 daily resistance, ENJ has formed lower highs and lows, returning to the 0.2116 support zone, which is crucial.
This 0.2116 support holds significance due to Fibonacci alignment,Its position on the 50% level, indicating potential for a rebound if the trend weakens.
Alternatively, breaking this support could lead to lower lows, bringing ENJ back into its weekly box. In this case, it might retest the 0.1854 and 0.1520 support levels.
⏱ 4-Hour Timeframe
Market volume has significantly dropped, suggesting reduced trading activity during the holidays. This low 24-hour trading volume has led to irrational and unnecessary market fluctuations.
📈 Long Position Trigger
After breaking 0.2483, a long position can be opened, but given the low market volume, trades should be executed with reduced risk.
📉 Short Position Trigger
After breaking 0.2105, a short position can be considered. However, logical trading during these conditions involves small stop losses and focusing on risk-to-reward ratios while quickly taking profits.
💡 BTC Pair Insight
Currently, ENJ isn’t performing well against Bitcoin. After showing some signs of life by testing the 0.000000374 resistance, it got rejected and returned to its support level.
Keep in mind that breaking this resistance could finally bring ENJ some gains against Bitcoin, which would likely translate into USDT price increases during a bullish market.
📝 Final Thoughts
Stay calm, trade wisely, and let's capture the market's best opportunities!
This analysis reflects our opinions and is not financial advice.
Share your thoughts in the comments, and don’t forget to share this analysis with your friends! ❤️

#ENJ/USDT#ENJ
The price is moving in a descending channel on the 12-hour frame and is sticking to it greatly and is about to break upwards
We have a bounce from the lower limit of the channel at a price of 0.1240
We have an upward trend on the RSI indicator that is about to break, which supports the rise
We have a trend to stabilize above the moving average 100
Entry price 0.1500
First target 0.1908
Second target 0.2208
Third target 0.2697

ENJ/USDT upward momentum from demand? Enjin Analysis💎 Paradisers, #ENJUSDT is showing signs of a probable bullish continuation from its current demand zone.
💎 A bullish confirmation could occur if #ENJ breaks and closes above the supply zone (SZ) level at $0.3201 on a daily chart, signaling a continuation of upward momentum towards our designated supply area. Upon reaching the supply area at $0.4073, slight resistance may be encountered.
💎 Remain calm but alert; if it manages to break above this level and maintain momentum, a significant bullish movement could unfold. Conversely, if #ENJIN encounters strong rejection at the $0.4073 resistance, marked by a bearish candle, a retracement to lower levels might be on the cards, potentially pulling the price back to the SZ at $0.3201.
💎 As #ENJ nears this crucial demand area, it must rebound and persist in its climb to retest the resistance. Considering its history of recovering from key demand levels, there is a strong possibility that it could repeat this pattern and ascend further.
💎 It's vital to maintain vigilance and closely observe #ENJ's price movements. A breakdown below the demand area, confirmed by a daily closure below it, would challenge the bullish scenario and could result in further declines.
MyCryptoParadise
iFeel the success🌴

ENJ LOOKS BULLISHWave B of the bullish pattern appears to be a triangle with only one wave remaining. With the completion of the E wave, it can move towards the targets.
If the price returns to the green range, we will look for buy/long positions
The targets are clear on the chart.
Closing a daily candle below the invalidation level will violate the analysis
For risk management, please don't forget stop loss and capital management
When we reach the first target, save some profit and then change the stop to entry
Comment if you have any questions
Thank You

#ENJ/USDT#ENJ
The price is moving within a 12-hour downtrend channel that it is firmly committed to, and has just broken through
We have a support area at 0.2400 and we bounced from it at the lower border of the channel
We have a tendency to stabilize above the Moving Average 100
We have a bearish RSI indicator and it broke higher
Entry price is 0.3080
The first target is 0.4320
The second target is 0.5146
The third goal is 0.6343

ENJ looks bullishFirst of all, you should note that the time frame is large and time-consuming.
When the diametric ended, we had a bullish wave and then it ended. We are now in the second wave.
We expect another bullish wave from the green range.
At the top of the chart we have a liquidity pool that is expected to be swept in the next bullish wave.
Also, a 3D mode can be seen in big waves, where the price can create another bullish wave and complete this 3D.
The targets are clear on the chart.
Closing a daily candle below the invalidation level will violate the analysis
For risk management, please don't forget stop loss and capital management
When we reach the first target, save some profit and then change the stop to entry
Comment if you have any questions
Thank You

#ENJ/USDT#ENJ
The price is trading in a large descending triangle
About a year and a half ago at the level of 0.2150.
There are bearish reversal triangle patterns inside the large bearish triangle
Finally, the falling trend was broken and the rise began
Expected goals: 0.5800 From the current price 0.2600
Which represents 200% of the current price
All of this is backed by a big volume rally

ENJ ROADMAPFirst of all, pay attention to the time frame. The time frame is big and time consuming.
Our big triangle starts from where we wrote "start" on the chart.
After the E wave ends and the triangle pattern is completed, we see a diamond diametric.
We now seem to be in the middle of wave E of this triangle.
Do not enter the position without confirmation and trigger and capital management.
For risk management, please don't forget stop loss and capital management
When we reach the first target, save some profit and then change the stop to entry
Comment if you have any questions
Thank You

ENJ Coin ARE YOU READY , Please take a seat and watchIf we break area 1 be ready for price explode and enjoy nice profit cheers , please follow me to get my analysis notifications

Enjin to 16k Satoshi by August 2022This is a fun chart that I actually made into an NFT on the Enjin chain. The idea is simple. As you can see, ENJ is trapped in a certain zone. The future direction depends on where it breaks off towards. If ENJ breaks above the descending curve, then my prediction is at least 16k Satoshi by August 2022. It could take one of two paths up there. On the other hand, if it fails in the near term and breaks the zone downwards, then it would follow the curve down back into January 2021 levels.
You can view this chart here .

ENJ LONG IDEAThe price made a nice retest, and we expect it to rise to the $0.37 level.
Take your risk, make some profit !

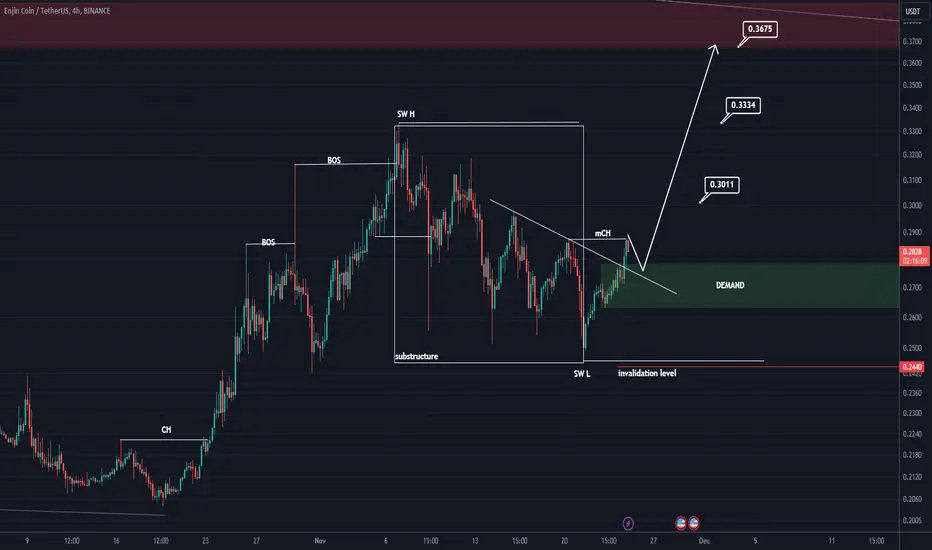
ENJ wants to pumpFrom where I inserted START on the chart, it looks like a large degree triangle has ended. It seems that we have an ascending diametric.
Price is pulling back down to test the FLIP range. In the green range, you can buy/long position.
The targets are clear on the chart.Closing 1 4-hour candle below the invalidation level will violate the analysis
For risk management, please don't forget stop loss and capital management
When we reach the first target, save some profit and then change the stop to entry
Comment if you have any questions
Thank You

ENJ ANALYSISWe have a bullish structure on the chart. We have a damned range that seems to be suitable for a buy/long position
I specified the targets on the chart. I also specified the invalidation level.
For risk management, please don't forget stop loss and capital management
When we reach the first target, save some profit and then change the stop to entry
Comment if you have any questions
Thank You
ENJ/BTC - Enjin Coin: BBand_Breakout Resistance_Breakout◳◱ Hey crypto lovers, we've identified bullish signals on the NYSE:ENJ / CRYPTOCAP:BTC chart through the detection of both a Bollinger Band and a Resistance Breakout. The Bollinger Band indicates a potential bullish trend as the price has moved outside of the upper band, while the Resistance Breakout confirms this trend by showing the price breaking above a key resistance level. Given the alignment of these signals, it may be a good idea to consider entering a long position and targeting higher levels. Our analysis indicates that the key resistance levels are at 0.0000126 | 0.00001285 | 0.00001347 and the major support zones are at 0.00001198 | 0.00001161 | 0.00001099. However, it is important to also consider other factors such as overall market conditions and other technical indicators before making a trade decision.
◰◲ General info :
▣ Name: Enjin Coin
▣ Rank: 110
▣ Exchanges: Binance, Kucoin, Huobipro, Bittrex, Kraken, Hitbtc
▣ Category/Sector: Media and Entertainment - Gaming
▣ Overview: Enjin is a Singapore-based technology company that provides services for building gaming communities as well as services for blockchain game developers. Enjin provides a suite of tools based on a web interface that supports Ethereum digital assets in the form of ERC-1155 tokens. Enjin also operates a virtual goods marketplaces for digital assets on Ethereum.
◰◲ Technical Metrics :
▣ Mrkt Price: 0.00001255 ₿
▣ 24HVol: 5.181 ₿
▣ 24H Chng: 2.033%
▣ 7-Days Chng: 0.11%
▣ 1-Month Chng: -9.75%
▣ 3-Months Chng: -22.14%
◲◰ Pivot Points - Levels :
◥ Resistance: 0.0000126 | 0.00001285 | 0.00001347
◢ Support: 0.00001198 | 0.00001161 | 0.00001099
◱◳ Indicators recommendation :
▣ Oscillators: BUY
▣ Moving Averages: STRONG_BUY
◰◲ Technical Indicators Summary : STRONG_BUY
◲◰ Sharpe Ratios :
▣ Last 30D: -3.19
▣ Last 90D: -0.88
▣ Last 1-Y: -0.29
▣ Last 3-Y: 0.76
◲◰ Volatility :
▣ Last 30D: 0.45
▣ Last 90D: 0.73
▣ Last 1-Y: 0.87
▣ Last 3-Y: 1.34
◳◰ Market Sentiment Index :
▣ News sentiment score is N/A
▣ Twitter sentiment score is 0.55 - Bullish
▣ Reddit sentiment score is 0.79 - V. Bullish
▣ In-depth ENJBTC technical analysis on Tradingview TA page
▣ What do you think of this analysis? Share your insights and let's discuss in the comments below. Your like, follow and support would be greatly appreciated!
◲ Disclaimer
Please note that the information and publications provided are for informational purposes only and should not be construed as financial, investment, trading, or any other type of advice or recommendation. We encourage you to conduct your own research and consult with a qualified professional before making any financial decisions. The use of the information provided is solely at your own risk.
▣ Welcome to the home of charting big: TradingView
Benefit from a ton of financial analysis features, instruments and data. Have a look around, and if you do choose to go with an upgraded plan, you'll get up to $30.
Discover it here - affiliate link -

ENJ : UPCOMING INCREASEA new study shows that ENJ has the chance to show coming time new increase views since it's about to break an important key level.
We will follow ENJ to see if it's able to increase in the coming time.

✳️ Enjin Coin | New Series (Fast ALTSBTC #1)I will now share with you a series of trade ideas with pairs that are set to move strong against Bitcoin.
The bullish signals already confirmed.
Fast ALTSBTC | Altcoins vs Bitcoin #1
---
Altcoin (PAIR): Enjin Coin (ENJBTC)
Trend:
Up
Potential: 100% to 180%
---
Wishing you great profits and success.
This is not financial advice.
Namaste.

ENJBTC - Long Forecast of 40% Gains (It'll Take 2 Months!)ENJ is on the rise with such strength that ENJBTC has now just broken through the descending trend line it's tested on numerous occasions historically. As long as we stay above the level at 1850 we would quite possibly be seeing a long term gain of around 40% up to the 2700 level we've seen the price drift toward previously.
If you enjoyed or agree with this idea - drop us a comment, like & follow! :)
