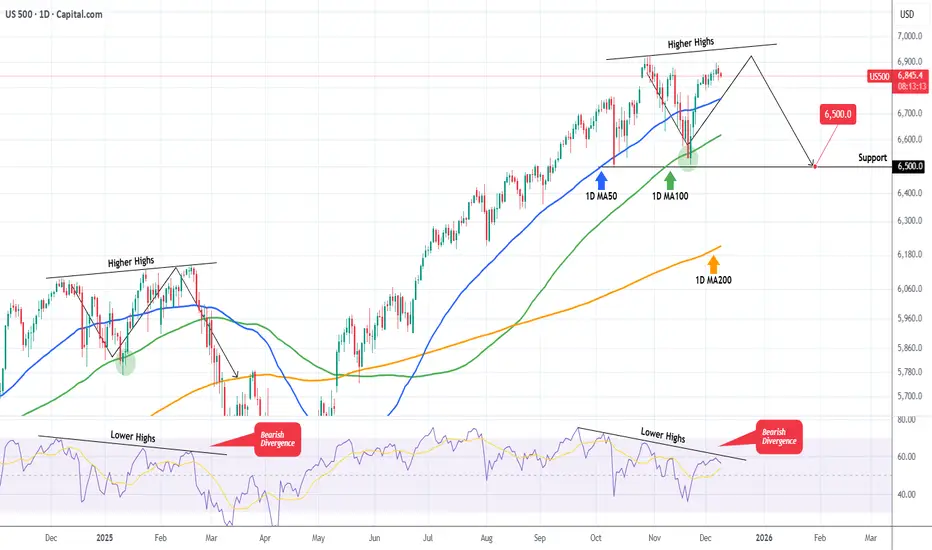
S&P500 The Bearish Divergence that may spoil the party.S&P500 (SPX) is extending a strong rally following the rebound on its 1D MA100 (green trend-line) almost 3 weeks ago. As we pointed out in a previous analysis, the price action of the past 2 months has been identical to the pattern after November 19 2024.
We are currently on the same 1D MA100 rebound towards the Higher Highs trend-line but the key development is that the 1D RSI on both fractals shows a huge Bearish Divergence, being on Lower Highs.
In February 2025 that led to the start of a strong correction in the stock markets. So as long as the 1D RSI Bearish Divergence holds, the S&P500 currently risks a technical correction towards at least the first Support level of 6500.
---
** Please LIKE 👍, FOLLOW ✅, SHARE 🙌 and COMMENT ✍ if you enjoy this idea! Also share your ideas and charts in the comments section below! This is best way to keep it relevant, support us, keep the content here free and allow the idea to reach as many people as possible. **
---
💸💸💸💸💸💸
👇 👇 👇 👇 👇 👇
Es1
ES (SPX, SPY) Analysis, Levels, Setups for Wed (Dec 10th)Market Overview:
The daily trend remains generally bullish, although recent sessions have manifested a sideways consolidation just beneath recent highs. Analysis of the 4-hour chart reveals a compressed range characterized by lower highs and higher lows, with prices maintained above the significant weekly demand zone between 6,600 and 6,640. On the hourly chart, the market has recently tested the support band at 6,840-6,850, currently resting at this level while momentum indicators suggest a potential upward reversal from a short-term oversold condition.
This price action appears more indicative of a pause at the lower boundary of the recent trading range rather than an outright breakdown.
We will continue to monitor the established levels for the week; prices have oscillated within these parameters without any clear break, suggesting that while the landscape of the market remains static, our positioning within it continues to evolve.
Overnight Developments Ahead of FOMC Meeting
As we head into the FOMC day, the prevailing market sentiment appears stable, with a slight upward bias as long as the support level around 6,840-6,850 holds firm. Asian and London sessions may experience dips below today's lows; however, if we manage to close above the first support level (S1), there remains potential for a rebound toward the 6,870-6,900 range as we approach the New York morning session.
Conversely, a decisive break and sustaining an hourly close beneath 6,840 would likely trigger a deeper examination of the second support level (S2), situated between 6,780-6,805, during either the European or early U.S. trading hours. With the Federal Reserve's announcement imminent, we anticipate more pronounced market moves could arise predominantly once we break free from the S1/S2 or R1/R2 boundaries, rather than from the current middle of the trading range.
A++ SETUP 1 - LONG
Enter: 6,790 - 6,800
SL: 6,770
TP1: 6,850
TP2: 6,900
TP3: 6,920 - 6,945
A++ SETUP 2 - SHORT
Enter: 6,925 - 6,935
SL: 6,965
TP1: 6,860
TP2: 6,800
TP3: 6,750
High impact news/events for tomorrow
2:00 pm - Fed interest rate decision and FOMC statement (last Fed meeting of 2025)
2:30 pm - Fed Chair Powell press conference
10:30 am - EIA weekly crude oil inventories (US oil stock data, often moves CL and ES/NQ via risk sentiment)
10:00 am - US Wholesale trade & inventories (medium impact, can move ES a bit if there is a big surprise)
Good Luck !!!

ES (SPX, SPY) Analysis, Key-Zones, Setups for Tue (Dec 9th)ES Market Overview (Daily/4H/1H)
The daily trend in the ES market remains bullish, with prices consistently above the most recent higher low while approaching a significant multi-month supply zone characterized by the 6,980-7,020 range. Although momentum has moderated, it has not completely reversed, suggesting that buyers continue to support dips, while larger market participants exercise caution around the 7,000 mark.
On the 4-hour chart, we have identified a new swing high near 6,900, followed by a notable pullback that touched the 6,820-6,840 area and subsequently rebounded. This development maintains the sequence of higher lows; however, sellers are becoming increasingly active with each attempt to rally towards the 6,880-6,900 range.
Examining the shorter-term 1-hour and 30-minute charts reveals that Monday experienced a lower high compared to last week's peak, leading to a decline towards the 6,820s before regaining ground in the 6,860s. Currently, the ES is positioned midway within the support band and beneath the intraday highs around 6,875-6,895, indicating a balanced short-term outlook: buyers are engaged below the 6,850 level, while selling pressure emerges near 6,890.
Macro Backdrop for Tomorrow
As we approach the December FOMC meeting, which kicks off tomorrow with the decision and subsequent press conference from Fed Chair Jerome Powell expected on Wednesday, market positioning is likely to remain cautious, especially near the upper range.
Key U.S. data releases scheduled for tomorrow include the NFIB Small Business Optimism Index at 6:00 ET for November and the postponed JOLTS job openings report at 10:00 ET for October. These reports provide insights into hiring trends and business sentiment following the autumn slowdown and recent government shutdown. In particular, the 10:00 ET release could trigger increased volatility. Furthermore, the global tone appears somewhat apprehensive, with Asian markets showing signs of weakness ahead of the Fed's decision.
OVERNIGHT SESSION FORECAST FOR NY MARKETS
In the base case scenario, we anticipate that the E-mini S&P 500 (ES) will navigate between support level S1, situated between 6,840 and 6,850, and the band of 6,875 to 6,895 as traders position themselves ahead of the JOLTS report and the commencement of the Federal Reserve meeting. A retreat to S1 that holds above the approximate level of 6,835 is considered constructive, potentially setting the stage for a recovery into the upper range of Monday’s session, specifically around 6,880 to 6,895, as we transition into London trading and early New York.
On the upside, should buyers successfully propel and maintain prices above 6,900 during the New York morning session, the next significant target would be resistance level R2, ranging from 6,920 to 6,945. This area is likely to attract selling activities as market participants position themselves ahead of the Fed's Wednesday decision, making sustained trading above R2 before the announcement less probable.
Conversely, if S1 does not hold and we witness hourly closes below approximately 6,835, this could indicate a shift toward a more bearish outlook, paving the way for a decline towards support level S2, which lies between 6,780 and 6,805—aligning with the 4-hour higher low region. Such a breakdown would frame the next trading day as a corrective phase within the broader uptrend.
Overall, the bias heading into tomorrow leans mildly bullish yet appears to be capped. We expect a two-sided trading range, with initial dips towards S1 likely attracting buying interest, while pronounced selling pressure is anticipated around the 6,890-6,905 region and more so at 6,920-6,945 as traders await further guidance from the Federal Reserve.
A++ Setup 1 - Short from R1
Entry: 6,892 - 6,900 short
SL: 6,912
TP1: 6,850
TP2: 6,815 - 6,820
TP3: 6,790 - 6,800
A++ Setup 2 - Long from S1
Entry: 6,842 - 6,850 long
SL: 6,828
TP1: 6,882 - 6,890
TP2: 6,905
TP3: 6,920 - 6,930
Good Luck !!!
ES1! S&P 500 E-mini Futures - The Fed Week Pivot📈 Executive Summary - The Setup
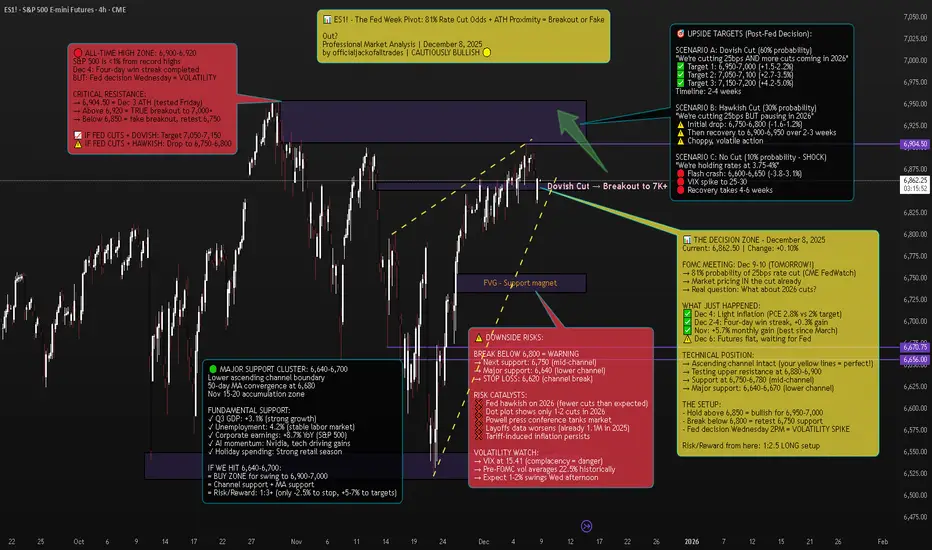
Current Price: 6,862.50 | Date: December 8, 2025 | Change: +6.75 (+0.10%)
The S&P 500 E-mini futures are sitting less than 1% from all-time highs on the eve of the Federal Reserve's most anticipated meeting of 2025. After a four-day win streak that added 0.3% to the index, markets are now in a classic consolidation pattern at resistance, waiting for Wednesday's 2PM ET catalyst.
The Technical Picture:
Pattern: Ascending channel (intact since November)
Current Position: Testing upper resistance at 6,880-6,900
ATH: 6,904.50 (December 3) - 0.6% away
Support: 6,750-6,780 (mid-channel), 6,640-6,670 (lower channel)
The Fundamental Backdrop:
FedWatch shows a near-90% probability the FOMC will cut the target range for the federal funds rate by another 25 basis points. But here's what markets are REALLY pricing: not just the cut itself (that's a given), but Powell's guidance on 2026.
Minutes from the October meeting showed "many" FOMC members saying no more cuts are needed at least in 2025. Yet the market now indicates an 80% likelihood of a December rate cut, following dovish statements from NY Fed President John Williams and Fed Governor Christopher Waller.
The Trade: This is a tactical long from 6,850-6,870 targeting 6,950-7,050, with stop at 6,820. Risk/reward: 1:2.5.
But the real opportunity? Buying any Fed-induced dip to 6,750-6,800 for a swing to 7,000+.
🔎 Market Context - What's REALLY Happening
The Pre-Fed Calm
US stock futures stall as traders wait for the Fed meeting, with the S&P 500 just below record highs. This is textbook behavior: The indexes have quietly stitched together consistent gains. The Dow and Nasdaq scored back-to-back positive weeks; the S&P 500 added another 0.3% and now sits only a touch from record territory.
S&P 500 futures (ES) traded around 6,880-6,885, roughly 0.1% higher by 6:00-7:30 a.m. ET on Monday.
But don't mistake the calm for weakness. Even after November's wobble, dip-buyers came back as shutdown fears faded and AI jitters cooled.
The Fed's Dilemma
The Federal Reserve is in an impossible position:
Argument FOR cutting:
Concerns about a softening labor market
Employers cut more than 1.1 million jobs through November, the most since 2020 and a 54% increase from the same period a year ago
Job growth remains too low to keep up with labor supply growth and a rising unemployment rate
Argument AGAINST cutting:
Latest inflation scorecard, the Fed's preferred PCE index, is running at 2.8 percent a year, close to its 2 percent goal but not quite there
The annualized inflation rate grew to 3% in September from 2.9% in August and 2.7% in July
Officials expressing skepticism about the need for an additional cut that markets had been widely anticipating, with "many" saying that no more cuts are needed at least in 2025
The Missing Data Problem:
Here's something CRITICAL that most traders don't know: The U.S. central bank will have to make its decision without some key government data. Hiring data for November and the latest inflation number have been delayed until mid-December, after the Fed's meeting, because of the U.S. government shutdown.
The meeting minutes indicated the decision-making was complicated by a lack of government data during the 44-day federal government shutdown. Powell himself compared this to "driving in the fog".
Translation: The Fed is making a $28 TRILLION (SPY market cap) decision BLIND.
The Internal FOMC War
"It's difficult to recall a time when the Federal Open Market Committee has been so evenly divided about the need for additional rate cuts than the upcoming December meeting," Michael Pearce, chief U.S. economist at Oxford Economics, said.
Jerome Powell faces a credibility issue as he tries to satisfy hawks and doves on the most divided Fed in recent memory.
The October meeting vote was 10-2, but the 10-2 vote was not indicative of how split officials were at an institution not generally known for dissent. The minutes revealed multiple camps:
Some favored cutting
Some supported cutting but could have supported holding
Several were against cutting
For December, Mericle expects at least two dissents in favor of no rate cut as well as one in favor of a larger rate cut.
📊 Technical Analysis - The Ascending Channel At Decision Point
The Pattern: Ascending Channel (Bullish Structure)
Your chart annotation is PERFECT. The yellow dashed ascending channel captures the exact structure driving ES1! since the November bottom.
Channel Characteristics:
Lower Support: 6,640 (tested Nov 15, Nov 29) → 6,670 (current)
Upper Resistance: 6,850 (Nov 25) → 6,900 (Dec 3-6) → 6,920 (projected)
Angle: ~25° (strong bull trend)
Tests: 6 touches (3 upper, 3 lower) = highly reliable pattern
Current Position: We're at the UPPER boundary of the channel, testing 6,880-6,900 resistance.
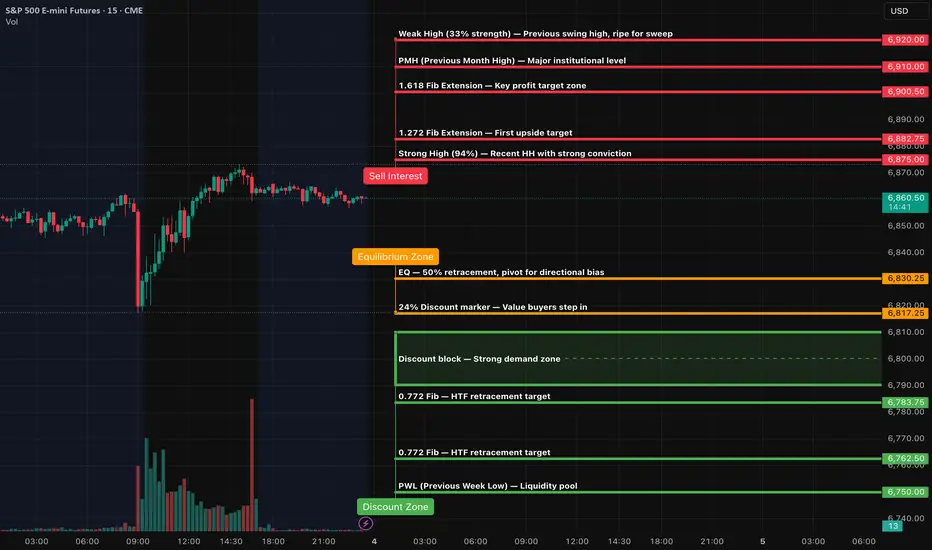
Key Technical Levels:
🔴 RESISTANCE (Selling pressure zones):
6,880-6,900: Current test, upper channel boundary
6,904.50: All-time high from December 3
6,920-6,950: True breakout zone (if we clear ATH)
7,000: Psychological milestone
🟢 SUPPORT (Buying interest zones):
6,850: Immediate support, bull/bear line
6,800-6,820: Minor support cluster + FVG
6,750-6,780: Mid-channel support + 23.6% Fib
6,700-6,720: 38.2% Fib retracement
6,640-6,670: Major support (lower channel + 50-day MA + November accumulation)
Technical Indicators:
Moving Averages:
50-day MA: ~6,680 (rising, bullish)
200-day MA: ~6,450 (rising, bullish)
Golden Cross: Active since mid-November = long-term bullish
RSI (Relative Strength Index):
Current: 58-60 (neutral/slightly bullish)
Not overbought (room to run to 70+)
Not oversold (not panic selling)
Interpretation: Healthy consolidation before next leg
Volume Analysis:
Declining volume into Fed decision = normal pre-FOMC behavior
Stock volatility averages around 22.5% in the month preceding rate cuts, compared with roughly 15% during normal periods
Expect volume spike Wednesday 2PM-4PM (100K+ contracts)
VIX (Fear Index):
VIX at 15.41, down -0.37 (-2.34%)
This is LOW = market complacency
Pre-FOMC, VIX typically rises to 18-22
IF VIX spikes to 20+ Wednesday = sell signal
🎯 Scenario Analysis - Three Possible Outcomes
SCENARIO A: Dovish Cut (60% Probability) - BULLISH
What Happens:
Fed cuts 25bps to 3.50-3.75% range ✓
Dot plot shows 3-4 more cuts in 2026 ✓
Powell says "labor market concerns outweigh inflation" ✓
Balance sheet runoff stops as planned (December 1) ✓
Market Reaction:
Immediate: ES pumps 1-1.5% to 6,930-6,950
Day 1-3: Consolidation at 6,920-6,950
Week 1-2: Breakout to 7,050-7,100
Month 1: Target 7,150-7,200 (+4.2%)
Sector Leaders:
Small caps (Russell 2000) +2-3%
Tech (Nasdaq) +1.5-2%
Financials +1-1.5%
Trade Setup:
Enter: ANY dip to 6,850-6,870 before Fed
Add: On breakout above 6,910 with volume
Target: 7,050 (+2.7%), 7,150 (+4.2%)
Stop: 6,820 (-0.6%)
Risk/Reward: 1:4
SCENARIO B: Hawkish Cut (30% Probability) - NEUTRAL/CHOPPY
What Happens:
Fed cuts 25bps to 3.50-3.75% range ✓
BUT dot plot shows only 1-2 cuts in 2026 ❌
Powell says "we're near neutral, will pause to assess" ❌
Market had priced in 3-4 cuts for 2026 = DISAPPOINTMENT
Market Reaction:
Immediate: ES drops 0.8-1.2% to 6,790-6,820
Day 1: Volatility, chop between 6,780-6,850
Week 1-2: Dip-buying brings it back to 6,870-6,900
Month 1: Grind back to 6,950-7,000 (+1.3%)
Sector Rotation:
Small caps (Russell 2000) -1.5-2%
Tech holds up better (mega-caps)
Defensives (utilities, staples) outperform
Trade Setup:
DO NOT chase before Fed (risk of -1.2% drop)
Buy: Dip to 6,750-6,800 (mid-channel support)
Target: 6,900-6,950 (+2-3% from dip entry)
Stop: 6,720 (-1%)
Risk/Reward: 1:2
SCENARIO C: No Cut OR Very Hawkish (10% Probability) - BEARISH
What Happens:
Fed HOLDS at 3.75-4% range (SHOCK) ❌
OR cuts but says "this is the last one for 6+ months" ❌
Powell cites inflation persistence, tariff risks ❌
Market has 90% priced in for cut = PANIC
Market Reaction:
Immediate: ES flash crashes 2-3% to 6,650-6,750
Day 1: Volatility, VIX spikes to 25-30
Week 1-2: Bounce attempt to 6,750-6,800 fails
Month 1: Retest 6,600, then recovery to 6,800-6,850
Sector Carnage:
Small caps (Russell 2000) -3-4%
Tech -2-3%
Everything bleeds
Trade Setup:
Exit ALL longs immediately on no-cut announcement
Wait for VIX to spike above 25
Buy: Capitulation at 6,600-6,650 (lower channel)
Target: Recovery to 6,850-6,900 (+3-4%)
Risk/Reward: 1:3 (but high stress)
🎯 THE TRADE SETUP - Professional Execution Plan
🟢 PRIMARY LONG SETUP: BUY ES1!
Entry Strategy (Scale In):
Option A: Conservative (Wait for Fed)
50% at 6,750-6,780 (IF hawkish cut dips)
50% at 6,720-6,750 (IF deeper dip)
Best for: Risk-averse traders
Option B: Tactical (Enter Now)
40% at 6,860-6,870 (current - small position)
30% at 6,820-6,840 (IF pre-Fed dip)
30% at 6,750-6,780 (IF post-Fed dip)
Best for: Experienced traders comfortable with volatility
Stop Loss: 6,620 (HARD STOP)
Below 6,620 = channel break on daily close
Below this = technical structure invalidated
Max loss from 6,862 entry: -3.5%
Take Profit Targets:
TP1: 6,950-7,000 (Probability: 70%)
Initial breakout above ATH
Psychological 7,000 level
Action: Take 40% profit, move stop to 6,850
Gain: +1.3-2.0% | Risk/Reward: 1:2
TP2: 7,050-7,100 (Probability: 50%)
Momentum continuation
Channel projection
Action: Take 30% profit, trail stop to 6,920
Gain: +2.7-3.5% | Risk/Reward: 1:3
TP3: 7,150-7,200 (Probability: 30%)
Full breakout extension
TradingView puts it, with a potential breakout in S&P 500 futures above the 6,900 area
Action: Take 20% profit, let 10% ride
Gain: +4.2-4.9% | Risk/Reward: 1:4
Entry Confirmation Checklist:
Before entering, CHECK:
✅ Price holding above 6,850 (bull/bear line)
✅ Volume spike on bounce (80K+ contracts on 15min)
✅ RSI crosses above 60 (momentum shift)
✅ VIX drops below 16 (fear subsiding)
✅ Fed announces 25bps cut (as expected)
✅ Powell's tone is dovish or neutral (not hawkish)
WAIT FOR 4/6 BEFORE FULL POSITION
Fed Day Volatility Protocol:
December 10, 2PM ET - Fed Announcement:
1:45 PM: Tighten stops to 6,830 (before announcement)
2:00 PM: Fed statement released - READ IMMEDIATELY
2:00-2:05 PM: Algorithmic reaction (ignore, volatile)
2:05-2:30 PM: Human digestion of statement
2:30 PM: Powell press conference begins - WATCH LIVE
2:30-3:15 PM: Powell Q&A determines direction
3:15-4:00 PM: Final positioning for overnight
IF DOVISH: Add to position on dip to 6,900
IF HAWKISH: Cut 50%, trail rest tight at 6,820
Weekly Monitoring:
Check EVERY DAY:
Fed speakers: Any 2026 guidance changes
Economic data: Jobs (Dec 16), CPI (Dec 18)
Technical levels: Is channel intact?
VIX: Spikes above 20 = warning
Volume: Declining = weak trend
Emergency Exit Conditions:
❌ Daily close below 6,620 = EXIT ALL (channel break)
❌ VIX spikes above 25 = EXIT 50%, tight stop on rest
❌ Fed announces NO cut (10% scenario) = EXIT ALL immediately
❌ Powell says "this is the last cut for 2026" = EXIT 50%
❌ ES gaps down >1.5% overnight = reassess, likely exit
📊 Fundamental Analysis - Why This Matters
CATALYST #1: The Fed's Impossible Position
Federal Reserve policymakers are expected to cut interest rates at this week's meeting despite inflation remaining above their target amid concerns about a softening labor market.
This is the classic Fed dual mandate dilemma:
Mandate #1: Maximum employment (FAILING - 1.1M layoffs in 2025)
Mandate #2: Stable prices (FAILING - inflation at 2.8% vs 2% target)
They can't fix both. So they have to choose.
David Mericle, chief U.S. economist at Goldman Sachs notes job growth remains too low to keep up with labor supply growth and a rising unemployment rate.
My take: The Fed will prioritize employment over inflation. That's dovish = bullish for stocks.
CATALYST #2: Corporate Earnings Remain Strong
Despite all the macro noise, corporate profits are SOLID:
S&P 500 earnings: +8.7% YoY
Tech sector leading: +12-15% earnings growth
AI spending driving margins higher
Q4 guidance mostly positive
Carvana (CVNA) stock rose 8% before the bell on Monday following news on Friday that it will join the S&P 500 as part of the index's quarterly rebalancing.
Translation: Fundamentals support higher prices, Fed just needs to cooperate.
CATALYST #3: Seasonal Tailwinds
Could spark a "year-end melt-up", as TradingView puts it, with a potential breakout in S&P 500 futures above the 6,900 area.
December-January has positive seasonality:
Holiday spending strong
Tax-loss selling done (Nov-early Dec)
January effect (fresh capital inflows)
Pension/401k rebalancing (buy equities)
Historically, S&P 500 averages +1.3% in December and +1.1% in January.
CATALYST #4: Institutional Positioning
Bloomberg's interviews with 39 investment managers show that most are still planning for a risk-on 2026, citing expectations of continued AI-driven productivity and earnings growth.
But here's the key: Asset managers such as EFG Asset Management and BNP Paribas Asset Management caution that with 2025 already a strong year, they are reluctant to increase equity exposure into thin year-end liquidity, preferring instead to wait for better entry points in early 2026.
Translation: Institutions are WAITING to buy. Any Fed-induced dip to 6,750-6,800 will be AGGRESSIVELY bought.
⚠️ Risk Factors - The Bear Case
RISK #1: Hawkish Powell Tanks Market
Feroli noted that the firm is anticipating at least two dissents in favor of no rate cut as well as one in favor of a larger rate cut.
If Powell leans hawkish to appease the dissenting hawks, market could drop 1-2%.
RISK #2: Tariff-Induced Inflation
Minutes mentioned Trump's tariff policies in forecasts they provided in early September, projecting higher inflation and unemployment, slower growth and a lower federal funds ratel.
If inflation accelerates in 2026 due to tariffs, Fed might have to HIKE again = very bearish.
RISK #3: Labor Market Deterioration
Employers cut more than 1.1 million jobs through November, the most since 2020 and a 54% increase from the same period a year ago.
If this accelerates, could trigger recession fears.
RISK #4: Technical Breakdown
Break below 6,620 = channel invalidated → target 6,500-6,550 (-4.5-5.2%)
🔥 The Bottom Line
Here's what I KNOW on December 8, 2025:
✅ 81% probability of 25bps cut Wednesday
✅ S&P 500 less than 1% from ATH
✅ Your ascending channel is PERFECT technical structure
✅ 39 investment managers planning risk-on 2026
✅ Corporate earnings strong (+8.7% YoY)
✅ Seasonal tailwinds (December +1.3% avg)
✅ Support at 6,750-6,800 = institutional buy zone
Here's what I DON'T know:
Will Powell be dovish or hawkish?
How many 2026 cuts will dot plot show?
Will Q&A reveal recession concerns?
But here's what the MATH says:
Risk: 6,862 → 6,620 = -3.5% (if channel breaks)
Reward: 6,862 → 7,050 = +2.7% (base case)
Extended: 6,862 → 7,150 = +4.2% (bull case)
Risk/Reward: 1:2.5 minimum
The Play:
Small position NOW at 6,860-6,870 (20-30% of intended size)
IF hawkish dip to 6,750-6,800 → ADD 50-70%
IF dovish → ADD on breakout above 6,910
Stop at 6,620 (non-negotiable)
Target 7,050, then 7,150
This is a PROBABILITY game. 60% dovish, 30% hawkish, 10% shock. Position accordingly.
📍 Follow officialjackofalltrades for institutional-grade technical analysis, professional risk management, and trades backed by data.
Drop a 📊 if you're trading the Fed decision.
Drop a 🎯 if this helped your ES1! analysis.
Drop a 💰 if you're ready for 7,000+ SPX.
ES (SPX, SPY) Week-Ahead Analyses (Dec 8th - 12th)Market Analysis: Multi-Timeframe Structure Indicates Continued Bullish Sentiment, Yet Signs of Fatigue Emerge
Weekly Trend Assessment
The weekly trend remains robustly bullish, characterized by a series of higher highs and higher lows since the spring lows. The latest significant weekly higher low was established in the low 6,200s, with current price action oscillating just below the resistance zone around 6,900. This positioning indicates that price is trading at a premium against the last substantial weekly swing range (approximately 6,250 to 6,900), with a key equilibrium point at around 6,575. With prices situated nearly 300 points above this mid-range, new long positions in this area are likely paying a premium, contingent upon sustained price movement rather than favorable entry points.
The current weekly candle displays a small body resting at the top of the preceding expansion bar, a classic sign of balance at the top of an ongoing trend rather than a definitive reversal.
Daily Trend and Range Overview
The daily structure also points towards bullish momentum: since the November lows near the low 6,300s, prices have generated higher highs and higher lows, currently thriving within the strong resistance band of 6,850 to 6,900. Recent trading sessions have produced a tight range below this recent peak, with support forming around 6,840-6,860 and resistance capping at 6,890-6,905. Until there is a decisive move above the 6,905-6,920 range or a daily close beneath 6,840, the market remains in a sideways consolidation pattern at the pinnacle of this uptrend.
4-Hour Structure Insight
The 4-hour chart reflects a sharp upward leg originating from approximately 6,780, reaching into the 6,900 territory, followed by overlapping candles and shallow retracements. This price action suggests that the preceding move was impulsive, and present conditions may represent a pause rather than a full reversal. The latest significant 4-hour swing demonstrates a higher high around 6,900-6,905 followed by a higher low at 6,870, with current prices positioned in the upper half of this micro-range.
Momentum within the 4-hour timeframe appears to be waning: candles are producing smaller bodies, with wicks protruding in both directions, coupled with diminished trading volume. This behavior often precedes either a marginal high or a retreat towards the earlier price base.
1-Hour Contextual Analysis
On the 1-hour chart, the market is currently trapped between a short-term support floor around 6,870-6,875 and a resistance cap in the 6,895-6,905 range. Overnight trading has developed within this mid-range, setting the stage for today's session. As traders enter the New York trading hours, a critical factor will be whether the market can decisively break and maintain levels above 6,905, or if that resistance will invite profit-taking and selling pressure.
Momentum Indicators: Weekly and Daily Perspectives
The weekly oscillator has retraced from prior overbought extremes and is now gradually ascending from a neutral zone - a constructive medium-term indicator. Although the trend remains upward, the substantial momentum surge may have already occurred. The daily oscillator presents an elevated stance, yet it is not at a new extreme and is beginning to form slightly lower highs while prices concurrently touch or slightly exceed previous highs. This presents a mild bearish divergence: the overarching trend is up, but each successive high lacks the same vigor as its predecessors.
In summary, while the structural analysis continues to favor a bullish outlook, momentum indicators signal a potential slowdown in the pace of price increases. The current scenario depicts an uptrend approaching resistance, exhibiting signs of fatigue but not yet forming a definitive topping pattern. Traders should remain vigilant in this environment as they navigate the interplay of momentum and price action going forward.
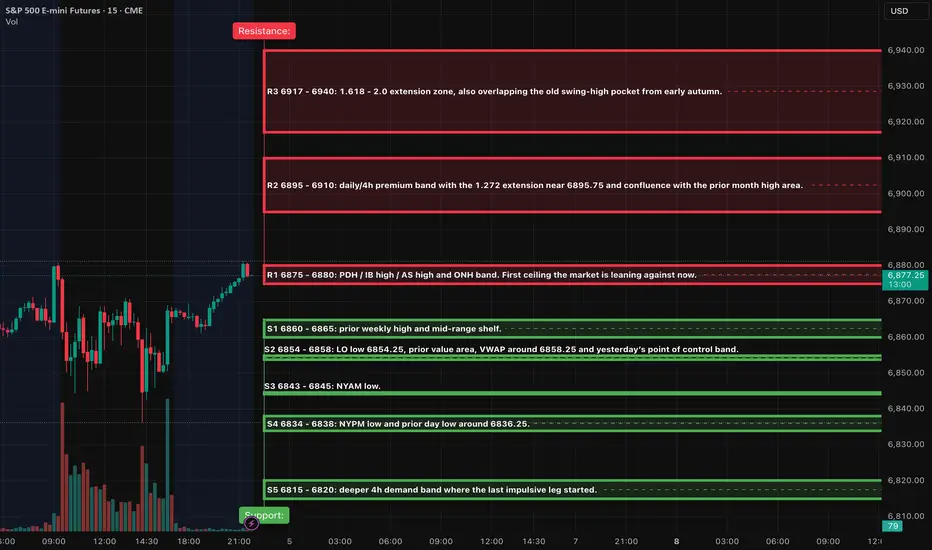
Key levels and zones
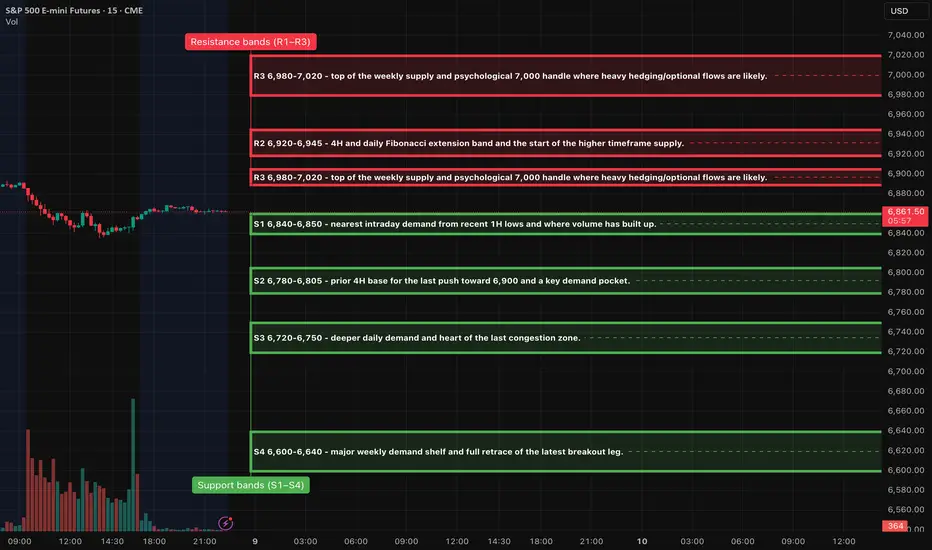
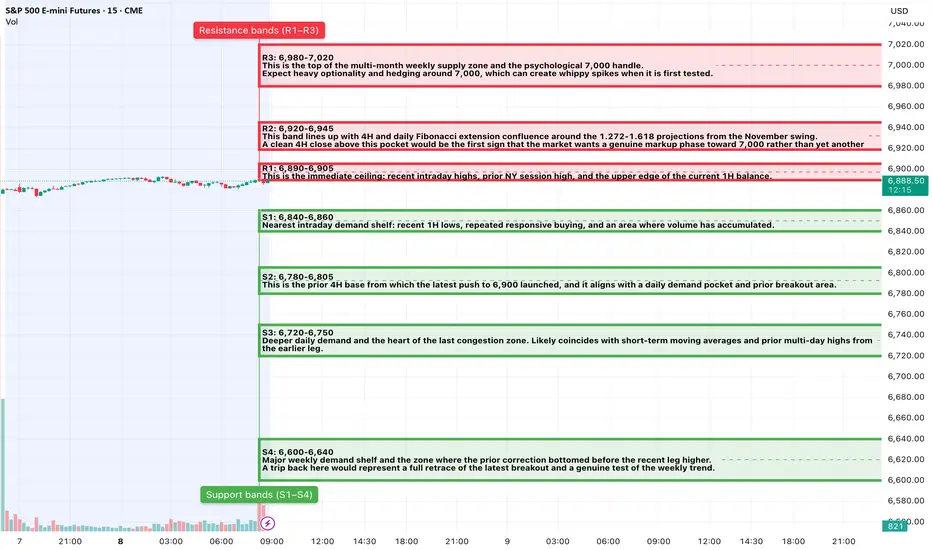
Resistance bands (R1–R3)
R1: 6,890-6,905
This is the immediate ceiling: recent intraday highs, prior NY session high, and the upper edge of the current 1H balance.
It also aligns with short-term extension targets from the last 4H leg. A lot of short-term stops will sit just above it.
Expect the first NY push into this pocket to attract profit-taking from longs and counter-trend scouts.
R2: 6,920-6,945
This band lines up with 4H and daily Fibonacci extension confluence around the 1.272-1.618 projections from the November swing.
It sits inside the broader weekly supply shelf and represents the first real “air pocket” above the current range.
A clean 4H close above this pocket would be the first sign that the market wants a genuine markup phase toward 7,000 rather than yet another rejection.
R3: 6,980-7,020
This is the top of the multi-month weekly supply zone and the psychological 7,000 handle.
It is labeled as a weak high area on higher timeframes: structurally important because a decisive break and hold above here would confirm a fresh weekly expansion leg, while another rejection would likely start a meaningful corrective phase.
Expect heavy optionality and hedging around 7,000, which can create whippy spikes when it is first tested.
Support bands (S1–S4)
S1: 6,840-6,860
Nearest intraday demand shelf: recent 1H lows, repeated responsive buying, and an area where volume has accumulated.
As long as NY closes keep holding above this band, the current congestion can be framed as a high-level pause, not a breakdown.
First test in NY AM is a candidate for a tactical bounce; repeated tests with weaker response increase the odds of a deeper flush.
S2: 6,780-6,805
This is the prior 4H base from which the latest push to 6,900 launched, and it aligns with a daily demand pocket and prior breakout area.
A 4H close back into and through this band would mean the most recent breakout has fully retraced. That is where swing buyers from the last leg begin to feel pain.
This is also near the top of a thicker volume shelf; structurally a very attractive support for A++ bounces if reached with a fast, emotional flush.
S3: 6,720-6,750
Deeper daily demand and the heart of the last congestion zone. Likely coincides with short-term moving averages and prior multi-day highs from the earlier leg.
If we are in a simple pullback within an ongoing weekly uptrend, this band should hold on a closing basis.
A stop-run into S3 that quickly reclaims S2 is classic “flush and spring” behavior.
S4: 6,600-6,640
Major weekly demand shelf and the zone where the prior correction bottomed before the recent leg higher.
A trip back here would represent a full retrace of the latest breakout and a genuine test of the weekly trend.
If this zone were to fail on a weekly close, you would be talking about trend damage rather than a routine shakeout.
One Decisive Pivot
The S&P futures are currently operating at a crucial make-or-break level between 6,780 and 6,800. This threshold acts as the dividing line between what could be characterized as an “orderly pullback within an ongoing trend” versus a “failed breakout.” Should the S&P maintain its position above 6,780 on both a 4-hour and daily closing basis, it will likely signal a high-level consolidation phase, potentially setting up for a breakout. Conversely, if the index witnesses a sustained decline below this pivot, particularly in conjunction with a rise in volatility, we could anticipate a deeper correction targeting key support levels S3 and possibly S4 in the coming weeks.
Volatility Environment
The VIX is sitting comfortably in the mid-teens, reflecting relative tranquility in the options market despite the index hovering just below all-time highs. The upward-sloping term structure of implied volatility indicates that the market anticipates modest near-term fluctuations while demanding a premium for longer-dated protection-classic contango behavior. This suggests an expectation for calm leading up to the upcoming central bank decision, with an inherent potential for volatility spikes should the Fed’s declaration differ from expectations.
Options Positioning and Skew Dynamics
A look at the equity-only put/call ratio, which currently stands at approximately 0.43 - significantly below the 20-day average of 0.60 - signals a robust call market and a degree of optimism prevailing within single-stock and broad equity options. Meanwhile, an uptick in demand for index puts persists, as evidenced by the index put/call ratio at around 1.07 and the SPX-specific ratio at approximately 1.13. This trend implies institutional preferences for hedging mechanisms even as spot indices flirt with historic highs. Furthermore, the SKEW index, around 149, remains considerably elevated compared to its long-term average, indicating that out-of-the-money downside insurance is costly relative to at-the-money options. This reflects ongoing concerns regarding tail risks in the current subdued market environment.
Overall, this paints a picture of a classic "call-happy, hedged-underneath" setup: the speculative fervor on the surface is balanced by institutional strategies focusing on downside protection. It's reasonable to infer that dealers are modestly long gamma at these index levels, which typically supports mean reversion around significant strike prices, such as 6,900, leading up to the Fed meeting - though these assumptions should be approached with caution.
Market Breadth and Internals
As we assess the broader market landscape, major indices concluded the previous week with modest gains, remaining within 1% of their all-time highs. Day-to-day breadth trends have exhibited a mixed demeanor; recent indicators show approximately 45% of stocks advancing while around 52% declined in one of the sessions, which leans towards a mildly negative sentiment, aligning with typical “fade at the highs” behavior rather than outright selling pressure.
Technology and growth sectors have continued to lead the market, while defensive plays, particularly utilities, have trailed - a development consistent with a risk-on market sentiment as opposed to classic late-cycle caution. Collectively, these internal metrics do not appear to confirm a market top but rather suggest a consolidation phase characterized by rotation at elevated price levels.
Credit and Funding Landscape
High-yield credit remains resilient, with HYG trading around 80.7 and JNK near 97.3, both positioned well within a narrow range proximal to their recent highs without signs of sudden outflows. The stability observed in high-yield ETFs indicates that credit spreads remain largely intact, contributing to overall orderly funding conditions without evident stress signals to undermine equity strength.
Sentiment and Crowd Positioning Analysis
The latest AAII survey reveals about 44.3% of respondents are bullish, 24.9% neutral, and 30.8% bearish, positioning the bull-bear spread at approximately +13.5 percentage points - well above the long-term average and indicative of rising optimism. When coupled with the low equity put/call ratio, this sentiment reflects a cautiously optimistic outlook that could risk complacency; however, it does not yet indicate a level of extreme sentiment typically preceding major market tops.
In summary, sentiment appears to support continued upward movement but carries an enhanced risk that any adverse macroeconomic developments could prompt a swift and pronounced market correction as overly crowded long positions seek exits.
Cross-Asset and Global Risk Tone
On the global stage, equity indices remain largely firm. The S&P 500 is experiencing a year-to-date increase of approximately 17% and is just shy of its record high. European indices like the DAX are also nearing their peaks, while Asian markets reflect mixed signals without evident distress. Additionally, the cryptocurrency market is displaying a risk-on attitude, with Bitcoin trading above $91,000 and Ethereum above $3,000 - both of which have risen recently ahead of the Fed meeting.
As we move forward, the interplay of these factors will be pivotal in shaping market expectations and movements in the wake of key policy announcements.
Macro and Data Calendar Context
This week, all eyes are on the Federal Reserve's meeting and rate decision scheduled for Wednesday. Futures markets currently reflect a strong expectation for a 25-basis-point cut from the existing range of 3.75-4.0 percent. However, internal divisions within the Fed indicate that this meeting could be one of the most contentious in recent memory. Market participants will also closely scrutinize updated projections and the tone during the press conference for insights into the anticipated rate trajectory through 2026.
On the data front, traders can expect delayed JOLTS figures and employment cost data. However, no significant inflation metrics are on the immediate agenda to influence the Fed's decision.
As for the week’s trading landscape, the narrative is quite clear: today and tomorrow are likely to involve positioning and range-trading at elevated levels, with Wednesday’s rate decision and subsequent press conference acting as critical catalysts that could break the current trading range of 6,850-6,900.
Scenario Mapping and Odds
Forecasting the market trajectory involves qualitative assessments rather than precise calculations, but the analysis reflects the prevailing structure, sentiment, and macroeconomic environment.
Primary Path (Approximately 55% Probability)
We expect a period of consolidation with a slight positive bias. The E-mini S&P 500 (ES) is anticipated to fluctuate between support (S1 at 6,840-6,860) and resistance (R2 at 6,920-6,945) leading up to the Fed meeting. We may witness multiple attempts to test the 6,890-6,905 ceiling, leading to sharp but controlled pullbacks. Market breadth appears mixed but stable, with the VIX remaining in the mid-teens and high-yield credit markets demonstrating resilience. A decisive directional breakout is likely to occur post-Fed - either a bullish push through R2 toward the 7,000 mark if the rate cut and guidance are deemed supportive or a bearish reaction if the Fed's tone leans hawkish.
Bear-Extension Path (Around 25% Probability)
This scenario suggests a failed breakout resulting in a deeper correction. Should the ES spike toward R1/R2 but decisively falter, a breakdown below S1 with a four-hour close under approximately 6,840 - either before or immediately after a hawkish Fed surprise - could trigger accelerated declines toward S2 (6,780-6,805) and potentially S3 (6,720-6,750). In this case, we would likely see the VIX rising above 20, deteriorating market breadth, and softness in high-yield indices (HYG/JNK). If these indicators remain stable, the likelihood of this path diminishes.
Confirmation Triggers: A four-hour close beneath 6,840, coupled with a spike in volatility and weakening credit conditions, will signal that this bearish scenario is gaining traction.
Bull-Surprise Path (Approximately 20% Probability)
In this scenario, a clean breakout could initiate a year-end rally. The ES would break through R1, consolidate briefly, and then surge past R2, ideally closing above 6,945, thereby converting the 6,900 level into support. A dovish Fed decision paired with guidance perceived as growth-supportive - without reigniting inflation concerns - could easily lift prices into the R3 band (6,980-7,020) this week. Under this outcome, we would expect lowered VIX levels, a broadening of sector leadership beyond just mega-cap technology stocks, and a potential euphoric sentiment among investors.
Confirmation Triggers: Sustained trading above 6,945, with S1 holding as support on any pullbacks, would confirm the validity of this bullish scenario.
Order-Flow and Micro-Structure Analysis: Key Levels for Today's New York Session
In today's intraday trading environment, particularly within the New York session, attention will be focused on critical resistance and support levels.
Resistance Levels (R1 and R2):
- At R1 (6,895-6,905), traders should monitor for late buyers entering the market. If this occurs without a corresponding increase in volume and 1m-5m candles start to show upper wicks, it may indicate potential weakness. A shift in Delta from strongly positive to neutral or negative during this price action would support a bearish outlook.
- Should the price advance to R2 (6,920-6,945), the essential factor will be whether it can sustain above this level on 15-minute closes. A clean acceptance accompanied by tight consolidations in the shorter time frames would suggest a bullish continuation. Conversely, if spikes and sharp rejections are noted, this could favor a fade in prices.
Support Levels (S1 and S2):
- At S1 and particularly at S2, the long thesis strengthens if there is a notable expansion in volume during a flush, followed by a marked slowdown and stable buying activity. A pattern of 1m-5m candles producing higher lows, while still operating within the support zone, would further bolster the long case.
In instances where the micro-structure fails to align with the broader market narrative at these pivotal levels, the prudent approach may be to refrain from trading until the market clarifies its direction in relation to impending Fed announcements.
Market Forecast for Today's NY Session:
- For today, the baseline expectation is for the ES to continue fluctuating within the 6,840-6,905 range, with an early attempt to breach overnight highs into the 6,895-6,905 zone. If this upward movement struggles, particularly with weak market breadth and the Nasdaq lagging, a pullback towards the 6,865-6,875 mid-range is anticipated, potentially extending down to S1 at 6,840-6,860, where we can expect responsive buyers to re-enter.
- A decisive break and sustained hold above the 6,905-6,920 level ahead of Fed statements would signal market anticipation of a dovish outcome, possibly triggering an earlier test of R2. On the downside, a breach below 6,840 on a 4-hour closing basis would suggest a shift toward a bearish continuation leading into the event.
Traders should focus on two A++ setups as primary strategies: consider fading any exhausted rallies approaching 6,900 and prepare to enter long positions on a genuine flush down to the 6,780-6,805 support area if the opportunity arises.
A++ Setup 1 - Short from upper shelf (R1)
Enter: Short ES in the 6,895-6,905 zone once you see a 5-15m rejection candle and a 1m-5m lower high back inside 6,900.
SL: 6,918-6,922, above the rejection wick and inside R2.
TP1: 6,860, at the top of the S1 shelf (take about 70% off and move stop to breakeven or slightly in the green).
TP2: 6,810-6,800, targeting the top of S2 if momentum extends.
Notes: Treat this as a high-probability fade of stretched prices into event risk; if you get a clean 4H close above ~6,920, the idea is invalid and you stand aside.
A++ Setup 2 - Long from 4H base (S2)
Enter: Long ES in the 6,780-6,805 zone after a fast flush into S2, a 15m candle that sweeps below and closes back above ~6,790, and then a 5m higher low above that reclaim.
SL: 6,770-6,775, below the reaction low and under the S2 pocket.
TP1: 6,860-6,870, back toward the S1/mid-range band (scale about 70% and move stop to breakeven or slightly positive).
TP2: 6,920-6,945, targeting the R2 band if the bounce evolves into a full reclaim of the upper range.
Notes: This is your preferred “flush-and-spring” play; a 4H close below ~6,780 invalidates the bounce thesis from S2 and shifts focus to lower bands.
Day 81 — 100% Signal Accuracy & Back in RhythmEnded the day +$287.49 trading S&P Futures. After the stress of the last few sessions, I’m finally feeling better and getting back into a solid rhythm. Today was one of those rare days where the system was absolute perfection—we went 6 for 6 on the signals. With the market clinching a 4-day winning streak ahead of the Fed meeting, it was all about trusting the data, following the market structure flips, and executing cleanly without overthinking it.
🔔News Highlights:*DOW ENDS UP 100 POINTS, S&P 500 AND NASDAQ CLINCH 4-DAY WINNING STREAK AHEAD OF FED MEETING
📈Key Levels for Tomorrow:
Above 6855= Bullish Level
Below 6842= Bearish Level

ES (SPX, SPY) Analysis, Key-Zone, Setups for Fri (Dec 5th)Market Overview
The daily trend remains firmly upward, with prices pressing against the November swing-high band, characterized by a sequence of higher lows and a gradual ascent toward previous peaks. Momentum indicators on both the daily and 4-hour charts are on the rise, yet they have not entered extreme levels, suggesting a likelihood of continued upward movement into the upper premium band rather than an imminent substantial reversal.
On the 4-hour and 1-hour charts, the E-mini S&P 500 (ES) has been consolidating in a narrow range, roughly between 6835 and 6880, as it builds energy just below the prior high. This range coincides with the 1.272 to 1.618 Fibonacci extension zone, located around 6895 to 6917. Given this setup, the outlook for tomorrow appears slightly bullish, provided the price remains above the mid-range support levels.
Market Brief: Key Developments for December 5, 2025
As we approach the final Federal Open Market Committee (FOMC) meeting of the year scheduled for December 9 -10, market participants are increasingly pricing in a substantial likelihood of a 25 basis point rate cut, along with further easing anticipated in the coming year.
For tomorrow, however, it’s important to note that the widely followed November employment situation report (including Non-farm Payrolls and the unemployment rate) has been officially postponed to December 16 due to the ongoing government shutdown. While some generic calendars may still reflect the original December 5 date for the payroll figures, this information has become outdated. At this time, it appears unlikely that any partial wage data will be released in lieu of the full report.
Nevertheless, many calendars are still marking U.S. hourly earnings and related labor indicators for the morning session. Expectations are set for hourly earnings, nonfarm payrolls, and unemployment rate placeholders around 8:30 AM ET, alongside the University of Michigan consumer sentiment and inflation expectations reports at 10:00 AM ET.
In practical terms, traders should expect regular liquidity levels in Asian and London markets. However, be prepared for potential volatility spikes around the 10:00 AM ET release of the U. Michigan data, especially if any unexpected headlines arise concerning the delayed labor report.
Market Outlook: Overnight Trends into New York Trading Session
As we head into the New York trading session, the key focus remains on the E-mini S&P 500 (ES). The base case scenario suggests that as long as ES maintains support above the significant range of 6854 to 6858 - often referred to as S2 - during any dips seen in the Asian and London sessions, we can anticipate a gradual upward movement. This trajectory would likely involve repeated testing of resistance levels around 6875 to 6880 (R1). Should we witness consistent hourly closes that approach this resistance with only modest pullbacks toward 6860, the likelihood of a breakout toward the premium zone of 6895 to 6910 increases, potentially occurring before or during the New York session.
On the other hand, the alternative scenario would unfold if the market decisively breaks below S2, resulting in a series of hourly closes beneath 6854. Such a development would signal a shift in sentiment and a potential rotation toward support levels S3 and S4, which target 6835. This would likely create a mean-reversion environment, with trading in New York focused more on the lower half of the 6835 to 6880 range rather than pushing for a breakout above resistance. Investors should tread carefully as these scenarios develop.
A++ setup 1 - Long breakout continuation above 6875
Bias: continuation long, only if we see real acceptance above R1.
Trigger conditions:
15m candle closes with a solid body above 6880, turning the 6875 - 6880 band from
Entry zone: 6878 - 6882 on the first 1m/5m higher low after that pullback holds.
Initial stop: 6869, tucked below the 6870 intraday pivot and just under the reclaimed band.
• TP1: 6904 - 6908, inside the 6895 - 6910 premium band, giving you roughly 2R or better if you are filled near the middle of the entry band and respect the tight stop.
• TP2: 6915 - 6918, near the 1.618 extension.
A++ setup 2 - Short reversal from failed break 6895 - 6910
Bias: high-quality fade only if the market runs stops into the premium band and then traps longs.
Entry zone: 6890 - 6896 on a retest of 6895 from below after that rejection is confirmed.
Initial stop: 6908, above the rejection high and inside the upper part of the premium band.
• TP1: 6858, back into the VWAP / prior value area pocket. That gives you roughly 2R or better if you are filled near mid-band with a 10 - 12 point stop.
• TP2: 6843 - 6845, test of NYAM low.
Tomorrow is shaping up to be a pivotal decision point following a robust advance in the market. As long as the support level around 6855 remains intact, any dips should be viewed as buying opportunities, particularly targeting the premium range of 6895 to 6917. However, a decisive rejection from this premium zone, with prices falling back through 6870, may signal an A++ short opportunity, potentially driving prices down toward 6858 and beyond.
Good Luck !!!
Day 80 — From Green to Red: The Danger of OverstayingEnded the day -$256 trading S&P Futures. I was actually up +$250 early in the session, but I made the mistake of itching for more after playing it safe with small gains all week. I decided to size up to 6 contracts on a Buy signal that looked solid, but the market had other plans. We saw a "flash crash" out of nowhere that stopped me out, only for price to rip all the way back up after tagging the 10-minute MOB. It felt scammy, stressful, and honestly, it ruined the day. It’s a harsh reminder that right now, the longer you stay in this market, the more dangerous it gets.
🔔News Highlights: *S&P 500, NASDAQ END HIGHER, VIX FALLS AS INVESTORS BRACE FOR KEY INFLATION DATA
📈
Key Levels for Tomorrow:
Above 6840= Bullish Level
Below 6830= Bearish Level

ES (SPX, SPY) Analysis, Levels, Setups for Thursday (Dec 4th)Market Outlook: Key Event and Trading Strategy
Main Event: Tomorrow's primary focus will be the release of US Initial Jobless Claims at 8:30 AM ET. Market participants should anticipate a significant increase in volatility during the premarket session surrounding this announcement. Notably, no other major US economic indicators of similar significance are scheduled to be released, which typically influence the E-mini S&P 500 (ES) as consistently as Jobless Claims does.
Investors should consider the 8:30 AM release as the initial decision point. It is advisable to allow for the initial volatility spike to materialize before assessing market levels as they begin to normalize. The A++ trading setups detailed below are designed to activate following the 8:30 move, ideally capitalizing on opportunities that arise during the morning session in New York.
Market Analysis: Current Landscape and Outlook
Daily Overview: The E-mini S&P 500 (ES) has maintained an upward trajectory, approaching the swing high levels from November. Currently, the price is positioned within the upper range of recent activity, just below a significant resistance zone situated in the high 6800s to low 6900s. While daily momentum indicators remain in positive territory, they are showing elevated levels, suggesting potential for upside continuation. However, the reward for initiating new long positions in proximity to resistance appears limited at this juncture.
An examination of the four-hour chart reveals a sideways trading band beneath the recent highs. Despite repeated attempts to breach the upper boundary, gains have not been sustained, though buyers continue to defend pullback levels. Below the current price, a notable demand zone exists between 6815 and 6825, with a deeper support area around 6780 to 6790. Should the 6815 level hold on a closing basis, the medium-term trend remains favorable.
Today’s price activity has formed a tight range, approximately between 6857 and 6865, with the previous day’s high located near 6873 and early lows today around 6820. The market appears to be consolidating near last week’s highs, with clear liquidity zones identified both above 6873 and below 6840.
For the overnight session extending into the New York trading day, the expectation is sideways-to-up as long as the price remains above 6815. This scenario suggests potential squeezes toward the 6885 to 6900 range before a more significant decision point emerges. Conversely, a decisive break and 15-minute close below the 6815 level would open the door to the 6780 to 6790 region and would likely temper the bullish outlook heading into Friday's session.
A++ Setup 1 - Short from upper band 6885-6898
Entry zone: 6882-6888 short on the first clean 5m lower high after the 15m rejection.
Initial stop: above 6898 (or 2-3 points above the rejection wick if that printed higher). From a mid-band entry, this is roughly 10-12 points of risk.
• TP1: 6860-6863 (return to the top of today’s box and prior week high zone).
• TP2: 6835-6840 (mid-band support).
• Optional runner TP3: 6818-6822 if 6840 fails and selling pressure accelerates.
Invalidation
A decisive 15m close above 6898 that then holds on a pullback. In that case, the short idea is downgraded and price is more likely aiming for 6915-6925.
A++ Setup 2 - Long from demand pocket 6815-6825
Entry zone: 6820-6826 long after the first clean 5m higher low and reclaim of 6825.
Initial stop: under 6808-6810, below the rejection wick and the lower edge of the pocket. From a 6823 entry this is about 13-15 points of risk.
• TP1: 6857-6860 (today’s box floor and first resistance on the way back up).
• TP2: 6868-6873 (prior day high and recent NYPM highs).
• Optional runner TP3: 6885-6895 if price continues squeezing toward the upper resistance band.
Invalidation
A 15m close beneath 6810 that is not reclaimed quickly. That opens the way toward 6780-6790 and downgrades the long.
Good Luck !!!
Day 79 — 100% Accuracy: When Market Structure Just Works Ended the day +$254 trading S&P Futures. Today was one of those rare "easy" days where the market structure and signals aligned perfectly. We saw some early volatility when news broke regarding MSFT, causing a quick market drop. However, once it was confirmed that the news was fake, the market pumped right back up. I stayed calm, trusted the signals, and let the market play out, resulting in a stress-free green day.
Well-Being: Good
🔔News Highlights: *DOW JUMPS 400 POINTS, VIX TUMBLES AS STOCKS END HIGHER ON RATE CUT HOPES
📈Key Levels for Tomorrow:
Above 6830= Bullish Level
Below 6800= Bearish Level

Day 78 — Surviving the Chop: When Nothing WorksEnded the day +$36.64 trading S&P Futures. Today was super stressful despite the small green finish. The market structure was flipping up and down constantly, with no real trend and moving averages/zones failing to hold. It honestly felt like one of those days where the Market Makers are specifically trying to break trader psychology and force mistakes. Usually, when I see this kind of chop and manipulation, it signals that a big directional move is brewing for later in the week.
📰 News Highlights
OPENAI DECLARES ‘CODE RED’ AS GOOGLE NASDAQ:GOOGL CLOSES IN
🔑 Key Levels for Tomorrow
Above 6830 = Bullish Below 6800 = Bearish

S&P500 Next stop.. 6925The S&P500 index (SPX) is about to complete the Right Shoulder of the Inverse Head and Shoulders (IH&S) pattern that took it from the bottom of the 1D MA100 (green trend-line) contact to having recovered the 0.786 Fibonacci level of the whole correction.
The next technical Target is of course the 6925 All Time High (ATH). Since however we are about to form a 4H MA50/100 Bullish Cross, a technical pull-back is expected as both previous such crosses since August 13, resulted into a short-term Top.
If the IH&S completes its technical expansion, then after this correction, a test of the 2.0 Fibonacci extension at 7200 is possible.
---
** Please LIKE 👍, FOLLOW ✅, SHARE 🙌 and COMMENT ✍ if you enjoy this idea! Also share your ideas and charts in the comments section below! This is best way to keep it relevant, support us, keep the content here free and allow the idea to reach as many people as possible. **
---
💸💸💸💸💸💸
👇 👇 👇 👇 👇 👇

S&P Futures Trading Day 77 — Locking Gains in a Scary MarketEnded the day +$247.39 trading S&P Futures. I came into the session with a bullish bias thanks to the market structure, and initially, things looked great as I caught a nice move breaking over the 1-minute MOB. However, the market had some tricks up its sleeve—I got stop-hunted trying to play the breakout zone at 6828, giving back some profits. I didn't let that rattle me, though; I went long again at support off the 11:10 signal, made the money back, and hit my ~$250 goal. With how "scary" and fragile everything feels lately, I decided to just lock in the smaller gains and call it a day.
📰 News Highlights
*BITCOIN TUMBLES 5% TO $86K AMID CRYPTO SELLOFF
🔔 VX Algo Signals
9:00 AM — MES Market Structure flipped bullish (X3) ✅
11:10 AM — VXAlgo NQ X1DP Buy Signal ✅
2 out of 2 signals worked — 100% accuracy today.
🔑 Key Levels for Tomorrow
Above 6830 = Bullish Below 6800 = Bearish

ES (SPX, SPY) Analysis, Levels, Setups for Tue (Dec 2nd)The market structure remains optimistic on the higher timeframes, bolstered by a significant rebound from the 6,520 levels. Currently, prices are fluctuating in the upper range of this move, consolidating between the intraday support and the previous weekly high. Although momentum indicators are stretched, they have yet to indicate a reversal, suggesting a potential continuation toward resistance levels R1 and possibly R2, provided that buyers can uphold the nearest support zones. Conversely, a failure to maintain support at S1 and S2 could pave the way for a deeper corrective phase targeting S3.
The levels are remain the same from yesterday analysis.
A++ SETUP 1 - LONG FROM S2 RELOAD BAND (6,790-6,805)
look for an overnight or early NY flush into 6,800 ± 10 points, followed by a strong rejection: wick below S2 on 15m, close back inside the band, plus a higher low on 5m.
Entry zone: 6,800-6,795 (inside S2 once rejection shows).
Hard stop: 6,780 (below the lower edge of S2 and recent wick structure).
TP1: 6,845-6,855 (back through S1 into the middle of the current range).
TP2: 6,870-6,885 (R1 test).
A++ SETUP 2 - SHORT LIQUIDITY SWEEP INTO R1 (6,870-6,885)
during London or NY AM, price spikes through 6,870 into the 6,870-6,885 band, takes out prior highs, but then prints a rejection: 15m candle with an upper wick and close back below about 6,875, plus a lower high on 5m.
Entry zone: 6,875-6,880 after the rejection is confirmed, not on the first blind touch.
Hard stop: 6,895 (above the top of R1; acceptance above there suggests a push toward R2).
TP1: 6,835-6,840 (back into S1).
TP2: 6,800-6,795 (retest of S2).
Key Events and Data to Watch on Tuesday
Tomorrow's U.S. session will be pivotal, focusing on key indicators of manufacturing and construction. The final S&P Global U.S. Manufacturing PMI will be released at 9:45 a.m. ET, followed closely by the ISM Manufacturing Index at 10:00 a.m. ET—both crucial for assessing factory activity and the momentum of economic growth. Concurrently, the Commerce Department will unveil October Construction Spending figures, a vital metric for understanding demand in infrastructure and housing sectors. Additionally, domestic vehicle sales data will be published, providing further insight into consumer strength.
Moreover, the OECD's latest Economic Outlook will present updated global growth projections, which could significantly influence market risk appetite. As markets remain attuned to indicators of decelerating economic activity, any surprises in these reports could lead to notable shifts between support levels (S2) and resistance levels (R1/R2), potentially reinforcing expectations for a rate cut from the Fed in December.
S&P 500 (ES1!): Bullish! Look For Valid Buys!Welcome back to the Weekly Forex Forecast or the week of Dec. 1-5th.
In this video, we will analyze the following FX market: S&P 500 (ES1!)
The S&P500 rallied last week, closing strong! Look for follow through going into this week.
Go with the overall bullish trend until there is a bearish market structure break.
Enjoy!
May profits be upon you.
Leave any questions or comments in the comment section.
I appreciate any feedback from my viewers!
Like and/or subscribe if you want more accurate analysis.
Thank you so much.
Disclaimer:
I do not provide personal investment advice and I am not a qualified licensed investment advisor.
All information found here, including any ideas, opinions, views, predictions, forecasts, commentaries, suggestions, expressed or implied herein, are for informational, entertainment or educational purposes only and should not be construed as personal investment advice. While the information provided is believed to be accurate, it may include errors or inaccuracies.
I will not and cannot be held liable for any actions you take as a result of anything you read here.
Conduct your own due diligence, or consult a licensed financial advisor or broker before making any and all investment decisions. Any investments, trades, speculations, or decisions made on the basis of any information found on this channel, expressed or implied herein, are committed at your own risk, financial or otherwise.

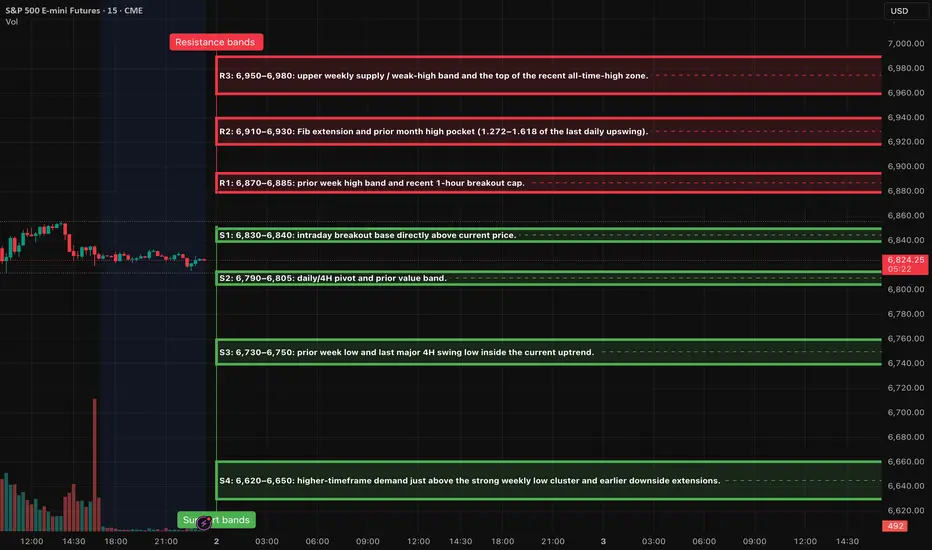
ES (SPX, SPY) Deep Analyses for Upcoming Week (Dec 1st - 5th)Multi-Timeframe Market Structure Analysis
Weekly Trend Overview
The E-mini S&P 500 (ES) continues to reflect a robust bullish trend on the weekly chart, characterized by a series of higher highs and higher lows. The most recent swing low is situated in the mid-6,500s, while prices are currently testing the previous weekly high zone around the high-6,800s, accompanied by a labeled weak high band overhead.
In terms of market positioning, prices reside firmly in the upper half of the annual range, trading within a premium supply band rather than at a discount. Momentum indicators are showing signs of a slowdown, with the weekly oscillator retreating from overbought conditions and gently sloping downward, even as prices hold near their highs. This situation exemplifies early-stage negative momentum divergence, suggesting that while the overarching trend remains intact, any upside progress is now slower and increasingly susceptible to pullbacks.
The structural bull market on the weekly timeframe is still valid, but the current price action falls into a costly zone, placing the onus on buyers to maintain upward momentum.
Daily Trend Analysis
Following a notable decline in November from the all-time high, ES established a higher low around the mid-6,500s, coinciding with a key extension bundle. Subsequently, it rebounded through the mid-6,700s, successfully reclaiming the essential daily midrange. The latest price action reflects a sequence of lower lows (LL), higher lows (HL), and a higher high, signaling a short-term bullish trend within a broader sideways pattern just beneath the recent highs.
The active daily range is delineated between 6,650 and 6,900, with current trading situated in the upper third. The daily momentum oscillator has sharply ascended from oversold territory and sits comfortably in the 60s—nearing overbought conditions but not quite there yet.
The daily trend indicates an uptrend initiated from a higher low, now testing resistance levels. Trend-following participants are positioned long, though late entrants may find themselves crowded near the upper edge of the trading range.
Four-Hour Structural Insights
The 4-hour chart reveals a strong reversal from a low around 6,525, where price structure has formed a clean stair-step of higher highs and higher lows. The latest 4-hour higher low rests in the high-6,700s. The recent impulse leg from this higher low has driven prices into the prior week's high and supply band near the high-6,800s. Observations indicate that candles are narrowing while wicks are extending, typically signaling an impending maturation of the current price leg.
While this remains largely an impulse move rather than a complete correction, the risk-to-reward ratio for entering fresh long positions at these levels appears unfavorable without a corrective pullback.
The 4-hour trend is decidedly bullish, yet this leg is maturing. A retracement toward the last observed higher low band in the high-6,700s would be both typical and healthy for the ongoing progression.
One-Hour Intraday Context
The 1-hour chart indicates a prolonged consolidation phase in the low-to-mid-6,800s, succeeded by a breakout thrust toward the prior week’s high. Recent micro-structural developments show small higher highs with diminished follow-through into the resistance zone. The emergence of upper wicks on the 1-hour candles suggests we're in the later stages of this move which originated from Friday’s New York low.
For intraday traders, entering new positions at this stage carries poor asymmetry. Strategies may involve either capitalizing on a potential exhaustion spike higher or considering buys only after a reset lower.
The intraday price leg is nearing maturity; anticipate either a minor mean reversion back into the breakout base or a final overshoot into the overhead extension band, followed by a more substantial pause.
Oscillator Insights on Weekly and Daily Timeframes
On the weekly front, the oscillator is rolling over from overbought levels, keeping prices near previous highs. While this in itself does not constitute a sell signal, it does imply that any additional advances will likely become increasingly challenging and volatile. Conversely, the daily oscillator remains robust, exhibiting positive momentum and trending upwards, although already sitting at mid-to-high levels. While there remains potential for one more uptick toward resistance, the risk of a sharp downturn looms larger should market news or flows fail to meet expectations.
Bottom Line: The primary timeframe indicators (weekly/daily) maintain a bullish outlook, while the active swings on the 4-hour and 1-hour charts are showing maturity and extension into resistance. The upcoming trading week will likely focus on navigating this late-stage upswing, either through fading exhaustion at the range's peak or by purchasing on controlled dips into well-defined demand zones.
Market Overview: Key Levels and Dynamics
Trend Boundary Analysis: 6,780 Area
The pivotal threshold for discerning between a healthy pullback and a significant trend reversal lies around the 6,780 mark. A sustained daily close below this level—specifically under S2 and near the last daily higher low—would signal a transition from what appears to be a “healthy pullback in an uptrend” to a more pronounced “daily correction.” In contrast, remaining above 6,780 allows for the interpretation of pullbacks as buyable dips into existing demand. However, should the market close below this threshold with consistent acceptance evidenced by multiple 4-hour closes and significant volume, the prevailing sentiment would shift towards anticipating a larger trading range or an early trend change.
Volatility Metrics Overview
The volatility index (VIX) closed at approximately 16.35 on Friday, a considerable drop from the mid-20s earlier in the month, indicating a low-to-moderate equity volatility regime. The options market appears relaxed rather than panicked. The VIX term structure has returned to contango, with the front month trading cheaper than the back month, supporting a risk-on environment without veering into euphoria. On the treasury front, the MOVE index remains elevated at around 69, having retreated from mid-80s spikes earlier in November, signaling that rate volatility has cooled yet remains high compared to pre-2022 standards.
The recent readings suggest that the fear that overshadowed the mid-month selloff has largely been priced out. Both equity and rate volatility have begun to mean-revert, typically favoring range trading and a more orderly trend rather than severe sell-offs. However, it’s important to note that the current state makes protective measures inexpensive, hinting that abrupt corrections could emerge unexpectedly.
Options Positioning Dynamics
The total put/call ratio is hovering around 0.70 for the latest session, suggesting a slight tilt towards puts relative to longer-term averages. The equity put/call ratio stands at about 0.44, indicating a bullish, call-heavy sentiment among traders, predominantly in single-name options. The 10-day moving average of the put/call ratio is roughly 0.92, slightly below neutral, indicating some short-term complacency, although not excessively stretched.
The SKEW index has stabilized around 143, down from the 160s a year ago but still above the traditional baseline of 120-130. This points to an inclination for tail hedging that is present but not extreme. Given the mid-teen VIX levels and a neutral total put/call ratio combined with a low equity put/call ratio, it is reasonable to deduce that dealers are likely not heavily short gamma at current spots. They may be positioned closer to long or flat gamma within the 6,750-6,900 range, which generally dampens intraday volatility and suggests a tendency toward mean-reversion. Conversely, movement outside this band—specifically above 6,950 or below 6,730—could alter the gamma positioning and pave the way for more significant directional shifts.
Market Breadth and Internal Strength
The S&P 500 concluded the week with a modest 0.5% gain on Friday, reflecting small gains throughout the month, while the Nasdaq faced a 1.5% decline, primarily driven by weakness in large technology stocks. The S&P 500 remains above both its 50-day and 200-day moving averages, having reclaimed the 50-day line last week after an earlier dip, suggesting renewed market participation beyond just a few mega-cap stocks.
Sector performance varied notably, with technology facing headwinds throughout November—most notably from AI-linked companies—while sectors such as energy, consumer cyclicals, and certain areas of healthcare and financials saw positive movements towards month-end. Despite an earlier warning from indicators like the McClellan Oscillator suggesting internal weaknesses, the recent rebound has begun to improve breadth. However, concerns linger that this rally might be more fragile than typical broad-based advances, given its rotational and choppy nature.
Credit and Funding Landscape
The high-yield index (HYG) hovers around 81, near recent highs, indicating generally favorable credit conditions as it has progressively climbed through November. High-yield spreads are tightening relative to recent standards, reinforcing a “risk-on” attitude within credit markets. There are no apparent signs of acute funding stress; previous operational disruptions in futures markets were not indicative of systemic issues.
Currently, credit markets are not signaling alarms. As long as HYG remains above approximately 79, equity dips are more likely to be viewed as buying opportunities rather than triggers for widespread liquidation.
Sentiment and Investor Positioning
In the latest AAII survey, the bull-bear spread stands at around -11%, indicating a modest bearish sentiment, with bears outnumbering bulls by approximately 11 percentage points—below the historical mean of +6%. Conversely, the low equity put/call ratio suggests that traders are actively pursuing upside positions in individual equities.
In summary, while survey data points to cautious investor sentiment, options markets illustrate a preference for call buying and a diminishment of fear. This dichotomy often results in uneven uptrends with the potential for sudden pullbacks when complacency is inevitably challenged.
Global Risk Sentiment and Cross-Asset Overview
In the cryptocurrency sector, Bitcoin has stabilized around 90-91k following a significant correction earlier in the month, with modest recovery observed in the past week. This development underscores a risk-on atmosphere among investors.
Macro and data-calendar context
• The coming week (Dec 1–5) is busy but not as pivotal as the mid-December CPI/Payrolls
• Key events:
• Monday: ISM Manufacturing and construction spending.
• Tuesday: JOLTS job openings.
• Wednesday: ADP employment and ISM Services, plus several PMI and industrial-production figures.
• Thursday: Challenger job cuts, weekly jobless claims, and trade balance.
• Friday: Critically, the delayed PCE and core PCE inflation data for September, pushed back by the recent government shutdown.
• Fed communication: The Fed is effectively entering its pre-meeting quiet period; Powell’s upcoming speech is one of the last major remarks before the December meeting.
Macro narrative: Markets are leaning heavily toward another Fed rate cut in December and a benign inflation path.  Given that, negative surprises in PCE or labor data could trigger a sharp repricing.
The late-November rally appears to be a recalibration of positioning and sentiment following a mid-month scare within the tech sector, rather than a direct response to any significant data shock. This week's major macroeconomic event is Friday's PCE report; other data releases are expected to influence intraday fluctuations rather than alter the overarching trend.
Scenario Analysis and Probabilities
These scenarios represent probabilistic outcomes rather than certainties.
Primary Path — “Controlled Grind with Dip-Buying” (Approximately 50%)
As we enter Monday, expect a modest pullback from Friday's late gains, with overnight Globex trading projected to fluctuate between 6,820 and 6,880. Early in the week, the market may test support levels S1 (6,830–6,840) or potentially S2 (6,790–6,805), ultimately leading to renewed attempts to breach resistance at R1 and possibly R2. By the week’s end, prices are anticipated to oscillate within a broad range of 6,790–6,930 ahead of Friday's PCE announcement, with only temporary moves outside this zone.
Confirmation Criteria: This path will be validated if we observe rejections below the 6,780 level holding firm on a closing basis, accompanied by repeated failures of sellers to maintain downward pressure beneath S2.
Bear-Extension Path — “Deeper Reset Before Year-End” (Approximately 30%)
This scenario is triggered by a failed breakout above R1/R2 early in the week, coupled with a significant intraday reversal and a decisive 4-hour close beneath S2 and potentially S3. Initial price action may feature a spike into the 6,910–6,930 range followed by swift sell-offs, leading to a rapid retreat back through S1 and S2, particularly if the PCE data comes in above expectations or labor statistics surprise on the upside, prompting a re-assessment of potential Fed rate cuts.
Target Area: The initial aim would be the 6,650–6,700 region (near S4), with the possibility of a complete reversal down toward the more robust 6,620–6,650 band.
Confirmation Criteria: Continuous acceptance below approximately 6,730 on a 4-hour basis, combined with a daily close under the 6,780 threshold, would indicate a return to the narrative of a higher low for November.
Bull-Surprise Path — “Breakaway Into New Highs” (Approximately 20%)
This scenario is set in motion by a clear 4-hour and subsequent daily close above R2 and R3, driven by exceptionally benign PCE numbers and a supportive stance from the Federal Reserve. Initial price action should reflect minimal pullback in the early part of the week, steadily climbing past R1 and R2, ultimately resulting in a trend day that aggressively squeezes shorts above the 6,950 mark.
Target Area: The market will likely gravitate toward the extension zone of 7,050–7,100.
Confirmation Criteria: Sustained trading above 6,930 without significant reversals, robust market breadth, and a VIX that remains comfortably anchored in the mid-teens or lower will serve as key indicators for this bullish outlook.
Two A++ setups for the week
A++ Setup 1: Rejection short from R2
Fade spike into 6,910-6,930; Entries, SL, TPs
Entry zone: 6,890–6,900 on the first clean 1-minute pullback after the 5-minute lower high.
Initial stop: Above the rejection high plus a small buffer; planning number ~6,935. That is about 35-45 points of risk if filled near 6,895-6,900; refine to the actual 15-minute wick when it forms.
TP1: 6,830-6,840 (S1 / breakout base). From a 6,895 entry, that is roughly 55–65 points, giving at least 1.3-1.5R with the conservative stop and significantly more if the wick is tighter.
TP2: 6,790-6,805 (S2 demand pocket).
TP3 (runner): 6,730-6,750 (S3), only if tape is heavy (e.g., PCE or data shock).
A++ Setup 2: Continuation long from S2
ES Long (A++) - Buy reclaim of 6,790–6,805; Entries, SL, TPs
Entry zone: 6,805-6,815 on the first 1-minute higher-low after the 5-minute confirmation.
Initial stop: A few points below the spike low; planning number ~6,780, which gives about 25–35 points of risk.
TP1: 6,870-6,885 (R1 / prior week high band). From a 6,810 entry, that is roughly 60–75 points, delivering comfortably more than 2R with the planned stop.
TP2: 6,910-6,930 (R2 extension band).
TP3 (runner): 6,950-6,980 (R3 / upper weekly supply) if PCE and flows are supportive.
Good Luck !!!
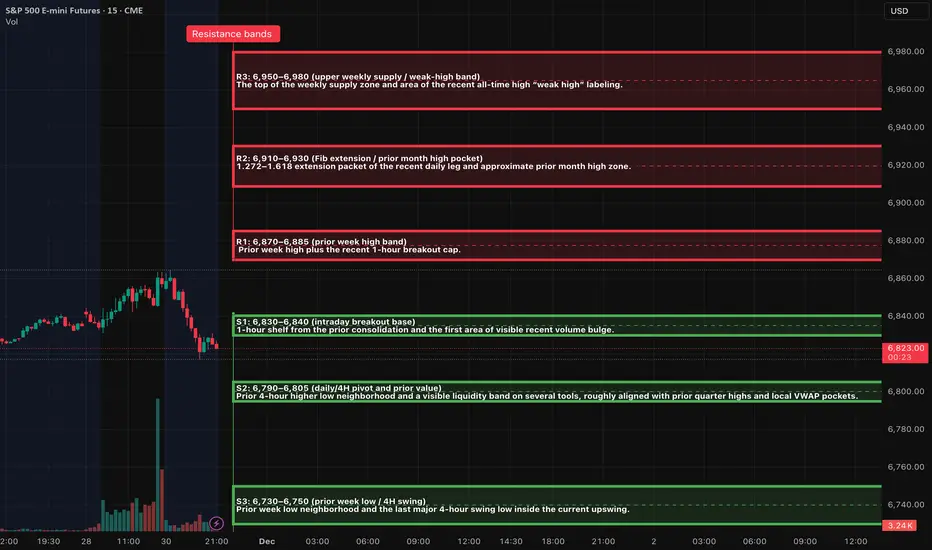
CISD and Inversions for framing a narrative. My main ModelThe next day model of MMXM. Thought process on how you can frame your bias for the next day next 4h next hourly and next 15min

S&P Futures Trading Day 76 — Trading Away From the Keyboard GoneEnded the day -$921 trading S&P Futures. This was a tough one to swallow. I was busy running around and away from the screens, so I set limit orders at major levels I was confident would reject. Unfortunately, the market had other plans—a surprise short squeeze triggered by the Ukraine peace deal news broke through everything. In hindsight, I should have sized down to 5 MES instead of 10 given I wasn't watching the charts, but truthfully, this felt like one of those unavoidable losses where a macro shock simply invalidates the technicals.
🔔News Highlights: *UKRAINE AGREES TO PEACE DEAL WITH US, TALKS WITH RUSSIA UNDERWAY
📈 Key Levels for Tomorrow:
Above 6790= Bullish Level
Below 6740= Bearish Level

ES (SPX, SPY) Analysis, Levels, Setups for Wed (Nov 26)Market Overview
The equity markets are currently facing a pivotal moment. The E-mini S&P 500 (ES) has made a significant rebound from the daily low around 6,520, approaching robust resistance levels formed by the highs of the previous week and yesterday. Both daily and 4-hour charts reveal a consistent pattern of higher lows emerging from a recent trough. However, the price now finds itself just beneath a key distribution cap and Fibonacci extension zone, estimated between 6,810 and 6,888. The daily momentum oscillator has shifted upward from an oversold position and remains at a mid-range level, indicating that while it is not yet overbought, the general trend still favors buying the dips, provided that crucial support levels are maintained.
Meanwhile, the Nasdaq 100 (NQ) mirrors this momentum, hovering near its New York Pre-Market (NYPM) peak. Recent gains have been bolstered by impressive earnings from Nvidia, highlighting the ongoing AI narrative, even as concerns about a potential market bubble begin to emerge, with NVDA's stock showing signs of volatility.
Events & News for Wednesday 26 Nov (Pre-Thanksgiving)
Wednesday is a data-heavy session in the U.S., and it’s also the last “normal” day before the Thanksgiving holiday liquidity vacuum. Expect volatility spikes and potential regime shifts around:
• 08:30 ET – Weekly jobless claims plus a cluster of delayed October releases: durable goods orders, trade balance/wholesale data, personal income & core PCE inflation, and related indicators.
• 10:00 ET – New home sales and other housing-related data.
• 10:30 ET – EIA crude oil inventories (can move risk sentiment via energy/curve).
• 14:00 ET – Fed Beige Book, giving an updated regional read on growth and inflation ahead of December’s FOMC meeting.
In addition, the BEA has postponed the Q3 GDP second estimate that had been scheduled for this week, so markets are leaning more heavily on the data above for macro guidance.
Net takeaway: 8:30 ET is the main volatility window, with a second impulse risk at 10:00–10:30 and potential trend extension or reversal into the NY morning kill-zone.
Key Zones (ES Z-25, based on current structure)
Immediate Resistance
• R1: 6,790–6,795
NYPM High / Prior Day High cluster (NYPM.H 6,792.5, PDH & Y-VAH 6,792.5). Sellers have defended this intraday band so far; it’s the lid of today’s range.
• R2: 6,805–6,815
1H fib extension 1.272 (≈ 6,810.25) plus likely PWH vicinity. First HTF extension above today’s range; a clean “stop run & decision zone” if 6,795 breaks.
• R3: 6,840–6,850
1H fib extension 1.618 (≈ 6,847.25). If buyers punch through R2, this is the next logical magnet and a strong candidate for an exhaustion spike on good data.
• R4: 6,880–6,900
1H fib 2.000 (≈ 6,888) and prior daily swing-high area. That whole 6,888–6,900 pocket is a big-picture objective and, for now, a likely “weak high” that could attract a stop run but also host the first serious counter-trend attempts.
Support / Demand
• S1: 6,765–6,775
Yesterday’s POC (~6,769.5), NY lunch high/NYL.H (6,774.25), and top of the 1H consolidation shelf. As long as the market keeps closing above this band on 15–60m, the short-term uptrend remains intact.
• S2: 6,720–6,735
Y-VAL 6,720.5, LO.H 6,721.5, ONH 6,732.5. This is the top of the prior value area and a natural “buy-the-dip” location if 6,770 gives way on data noise.
• S3: 6,670–6,705
NYAM.L 6,674.5, IB Low 6,674.5, ONL 6,701.75, plus current LOL 6,701.75. If we get a deeper flush, this is the primary intraday demand band where bulls must step back in to preserve the recent trend from the daily low.
• S4: 6,560–6,580
PDL 6,574.5 and top of the larger daily discount block. A break and sustained acceptance below here would open the door for a much larger retrace back toward the 6,520–6,420 HTF discount zone (daily 1.272/1.618 fibs).
Market Outlook: Bias & Forecast (Overnight → NY Session)
Structural Bias:
The prevailing market sentiment remains bullish as long as the E-mini S&P 500 (ES) sustains its position above the support range of 6,720–6,735 on a closing basis. The likely trajectory indicates a probing towards the 6,810–6,850 extension band. While the recent rally shows signs of being extended, it has not yet reached a point of definitive exhaustion, pointing towards a “late-stage impulse” rather than a confirmed top.
Overnight → London Session:
The base case anticipates a sideways-to-moderately downward movement from the 6,790s back toward the support levels of S1/S2 (6,765 → 6,730). This move aims to address intraday imbalances without disturbing the overall market structure. Should liquidity be limited, there may be an attempt during the London session to trigger stops through today's highs, directing attention towards resistance levels R2 (6,805–6,815) ahead of the New York session's developments.
New York AM Session (8:30–11:00 ET):
Should robust data emerge—indicating a favorable economic climate with subdued core Personal Consumption Expenditures (PCE) and steady labor claims—this is likely to spark a rally through R1 towards R2/R3, targeting 6,810 and subsequently 6,847 as key upside magnets. Conversely, a negative surprise featuring weak growth, a troubling inflation mix, or a risk-off sentiment evident in the Beige Book later in the day could dramatically alter the market landscape, potentially driving a liquidation toward support levels S2/S3, or in case of an unexpected shock, even probing S4 over the coming 24 to 48 hours.
In the near term, the expectation leans towards a gradual upward movement with shallow pullbacks, aiming for the 6,810–6,847 range. However, traders should remain vigilant for an increased risk of an exhaustion spike and a possible intraday reversal as this target zone is approached.
A++ Setups for Tomorrow
A++ Setup 1 – Trend Long from Retest of 6,730–6,770
Trigger:
Price trades down into 6,730–6,770 (S1/S2 overlap) either overnight or on the 8:30 data flush.
15m prints a higher low and closes back above ~6,755, reclaiming the mid-range.
5m confirms with a clear reclaim and hold of 6,760–6,770, then a higher low on 1m.
Entry Zone: 6,760–6,775 on a clean pullback after reclaim (not the first knife-catch wick).
Initial Stop: Below 6,720, tucked beyond Y-VAL/LO.H and the pullback low (≈ 35–45 pts risk depending on your exact fill).
Targets:
• TP1: 6,810–6,815 (R2 / 1.272 fib).
• TP2: 6,840–6,850 (R3 / 1.618 fib).
• Stretch: 6,880–6,900 (R4 / 2.0 fib) if data and risk sentiment stay supportive.
A++ Setup 2 – Exhaustion Short from 6,847–6,888
Trigger:
Impulsive move into 6,847–6,888 during NY AM or early PM, ideally on or shortly after 8:30 data.
15m candle shows rejection (long upper wick) and closes back below ~6,847.
5m prints a lower high under that rejection high, and 1m fails to make new highs on retests.
Entry Zone: 6,845–6,865 on the first proper lower-high after the rejection (avoid shorting the exact wick; let the LH print).
Initial Stop: Above 6,900, beyond the 2.0 fib and psychological round number (≈ 35–45 pts risk).
Targets:
• TP1: 6,790–6,795 (R1 / NYPMH/PDH cluster).
• TP2: 6,760–6,770 (S1 pivot band).
• Stretch: 6,720–6,735 (S2 / top of value) if selling pressure persists.

Pre open Heads Up. Index NSYECME_MINI:NQ1!
Looking for bearish prices on the Index triads for this NYO while the overall thought process is bullish on the HTF

S&P500 Final rally to 6925, then sell-off to 1D MA200?The S&P500 index (SPX) had a massive Friday rebound on its 1D MA100 (green trend-line) and yesterday touched again its 1D MA50 (blue trend-line), this time as a Resistance.
If it manages to break and close a 1D candle above it, we expect the current rebound to continue and evolve into the end-of-year rally and test at least the ATH Resistance at 6925.
The 1D RSI sequence suggests that we may be currently inside a same pattern as the December 2024 - January 2025 fractal, which after a 1D MA100 rebound it hit the ATH Resistance again and then got heavily rejected back to the 1D MA200 (orange trend-line) and beyond.
As a result, after the rally, our medium-term Target is 6300 (expected contact with the 1D MA200).
---
** Please LIKE 👍, FOLLOW ✅, SHARE 🙌 and COMMENT ✍ if you enjoy this idea! Also share your ideas and charts in the comments section below! This is best way to keep it relevant, support us, keep the content here free and allow the idea to reach as many people as possible. **
---
💸💸💸💸💸💸
👇 👇 👇 👇 👇 👇

ES (SPX, SPY) Analysis, Levels, Setups for Tue (Nov 25th)Market Outlook: Analyzing Technical Trends and Economic Indicators
The recent rebound from the 6520–6450 support zone has generated a constructive short-term outlook. However, the market now approaches a significant supply area in the 6800 range. While the immediate trend appears to favor modest gains, contingent upon maintaining support between 6660 and 6645, a pivotal decision zone resides between 6765 and 6815. A strong acceptance above this band could trigger an upward movement towards 6855–6930, while failure to hold could lead to a corrective phase targeting 6690, 6625, and potentially 6550.
Upcoming Economic Data: November 25
The week ahead is marked by a wealth of economic data expected to impact trading activity, particularly in the U.S. housing market and consumer sentiment. Key reports scheduled for Tuesday morning include the S&P/Case-Shiller Home Price Index for September, the Conference Board Consumer Confidence Index for November, Pending Home Sales for October, and the Richmond Fed Manufacturing Index. These releases, set for the 9:00–10:00 ET window, could introduce volatility into the markets.
Recent trends in consumer confidence have suggested a dampened sentiment due to the prolonged government shutdown and slow job growth. A disappointing report could perpetuate discussions of recession and further Fed interest rate cuts, while an unexpected improvement would likely support the current risk-on sentiment.
On the corporate front, pre-market earnings from major players like Analog Devices, Alibaba, Best Buy, Dick’s Sporting Goods, J.M. Smucker, and NIO could further influence market dynamics in the early hours, especially if there are surprises in their guidance.
Technical Analysis: Higher-Timeframe Perspective
From a higher-timeframe standpoint, the daily chart reflects a completed down-swing exiting the prior weak high around 6930, retracting to the extension zone between 6525 and 6455 where buyers have demonstrated strong interest. This low now appears as a "strong low" in technical analysis terms, aligning with higher timeframe discount levels and previous demand signals. Oscillators indicate a shift from oversold conditions, currently suggesting a corrective rally rather than an immediate resumption of a downward trend.
However, trading remains constrained within a 4-hour supply band between approximately 6765 and 6815. This range is characterized by the last notable lower high and previous sell-side momentum that precipitated the significant drop to 6520. Unless price breaches the 6815 threshold, the overall swing structure continues to reflect a "lower-high" scenario, which necessitates caution for any bullish positions as they occur within a broader corrective framework.
Intraday Trading Dynamics: Expectations for the Day
Analyzing the intraday structure on the 1-hour and 30-minute charts reveals that Monday’s trading culminated in a robust upward trend from the London low of 6625 to the New York AM low of 6646, concluding with a consolidation phase just beneath the Asia session high at 6724. The cluster of highs around 6715–6725 precisely correlates with an intraday equilibrium line situated just below the upper edge of the 4-hour supply band.
Volume data indicates strong buying activity emerging from the base established at 6520–6625, tapering off as prices approached the 6715–6725 range. Further insights from the 1-hour oscillator hint at a cooling in momentum, suggesting that initial price reactions may favor mean reversion rather than an unimpeded breakout.
Looking ahead into the New York trading hours:
- Asia Session: Anticipate a trading range likely between 6700 and 6730, with potential stop raids above 6725 and minor retracements towards 6685.
- London Session: If buyers can sustain the 6685–6660 level during potential pullbacks, this could establish a foundation for another attempt at reaching the 6765–6815 supply zone during the New York data release.
- New York Open: Provided that the 6660–6645 area holds during 15-minute closes, the baseline scenario suggests a rotation into the 6765–6815 decision band between late London and early New York. A significant rejection in this zone, characterized by long upper wicks and unsuccessful 15-minute closes above 6815, would favor a pullback towards 6690–6710 by day’s end. Conversely, clear acceptance above 6815 on robust volume would pave the way for targets at 6855 and potentially back to 6930.
Key zones
Resistance zones:
R1: 6724–6735 – Asia session high and intraday shelf, currently capping price.
R2: 6765–6815 – 4h supply block and 1.272 extension on the recent down-swing; prior 4h lower-high origin; this is the primary A++ short zone.
R3: 6855–6930 – Overhead daily supply with the prior weak high; if reached, expect heavy responsive selling on first touch.
Support zones:
S1: 6685–6660 – Intraday demand from the late-day push; includes London high at 6669.5 and prior structure; key pivot for the bullish case.
S2: 6645–6625 – NY AM low and London session low; first real downside objective if S1 fails.
S3: 6550–6525 – “Strong low” zone around the 1.272 extension; if this breaks on a closing basis the entire rebound thesis is likely wrong and the door opens toward the 1.618 around 6455 and even 6375.
A++ Setup 1 – Short fade from 6765–6815 (Tier-1 rejection play)
Entry zone: 6780–6805, leaning as close to 6800 as price action allows after the spike and stall.
Invalidation / hard stop: 6827, above the 4h supply high and the 1.272 line; if price can close above there, the rejection idea is wrong.
Targets and management:
TP1: 6710–6690 (retest of intraday equilibrium and prior 30m shelf). That gives roughly 2R from a 6785–6800 entry with a 20–25 point stop.
TP2: 6645–6625 (London and NY AM lows cluster). This is where you want the bulk of the remaining size off if sellers stay in control.
TP3: 6550–6525 (strong low zone) only if macro tape turns risk-off; treat this as a runner target, not baseline.
A++ Setup 2 – Long continuation from 6660–6680 (Tier-1 acceptance play)
Entry zone: 6670–6680 after the sweep and reclaim; avoid catching the first knife if momentum is still heavy.
Invalidation / hard stop: 6643, below the combined London low band; a 15m close below 6645 means the demand shelf failed.
Initial risk: roughly 30–37 points depending on fill.
Targets and management:
TP1: 6724–6735 (Asia high / intraday range top). From a 6675 entry with a 30-point stop this is just over 1.5R; to keep the setup A++, bias toward entries closer to 6670 or take partials slightly higher, around 6740, where 2R is reached.
TP2: 6765–6815 (4h supply band). This is where you expect strong counter-flow; plan to remove most of the remaining size here.
TP3: 6855–6930 only if price slices through 6815 on strong volume and macro data support risk-on; in that case trail under 1h higher lows rather than using static targets.
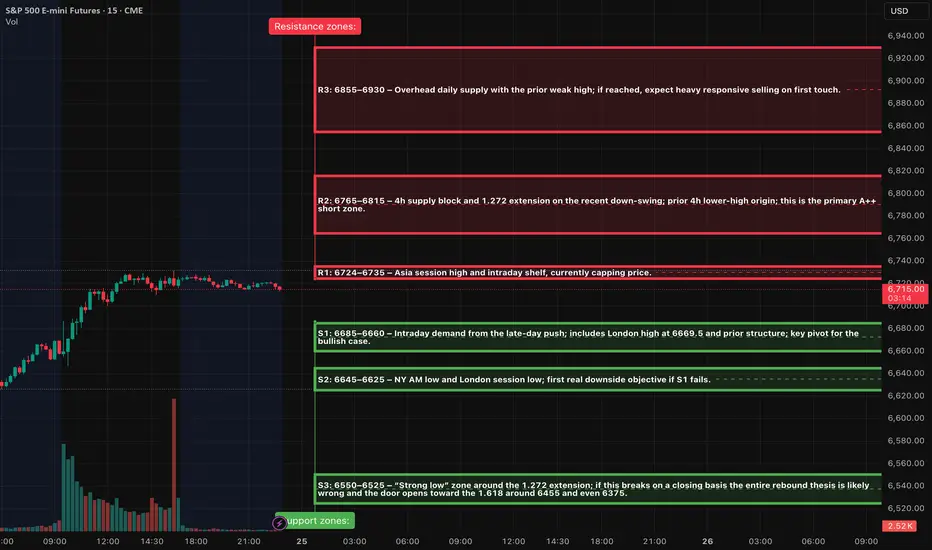
Day 75 — 3/3 Win Rate on 4 Hours of SleepEnded the day +$234.68 trading S&P Futures. Running on just 4 hours of sleep, I knew I wasn’t operating at 100% this morning. The market open was showing mixed signals, and given how wild the action has been lately, I decided the smartest move was to sit on my hands. I waited until later in the session when things slowed down, found my spots, and sniped a few setups. I ended up going 3/3 on my trades and decided to walk away green before the fatigue set in and the market took it back.
🔑 Key Levels for Tomorrow
Above 6720 = Bullish Below 6705 = Bearish
📰 News Highlights
*FED’S WALLER SUPPORTS DECEMBER RATE CUT, FED CHAIR TALKS
