Es1

Day 7 Trading Only S&P Futures — Trusting Structure Over GreedWelcome to Day 7 of Trading Only S&P Futures!
Today was a mixed day with a small loss of -$16.65. I started strong, up $133 early on, but after a big push up, I expected the market structure to flip bearish and missed a key long entry. Later, I shorted the 6451 resistance but let greed get the best of me, holding too long and turning a winner into a loss.
The key lesson? Trust the market structure and the double down (DD) signals — don’t fight the system.
📈 What you’ll learn
Why trusting structure and signals beats guessing the market
How greed can sabotage even well-planned trades
The importance of taking profits on key moves
Reading VX Algo signals for better trade timing
⏰ Timestamps
0:00 — Intro & Day 7 Recap
0:30 — Trading Wins & Mistakes
1:30 — VX Algo Signal Review
2:30 — Market News & Impact
3:30 — Key Levels for Tomorrow
🔔 VX Algo Signals (9:30am – 2pm EST)
8:29 AM Market Structure flipped bullish on VX Algo X3!
10:10 AM VXAlgo NQ X1 Buy Signal
10:20 AM VXAlgo NQ X1DD Buy Signal (double buy)
11:30 AM VXAlgo ES X1 Sell Signal
11:50 AM VXAlgo ES X1 Sell Signal
12:10 PM VXAlgo NQ X1 Sell Signal (double sell)
12:40 PM VXAlgo NQ X1 Sell Signal
📰 News Highlights
S&P 500 closes at a new record high.
🔑 Key Levels for Tomorrow
Above 6410 = Remain Bullish
Below 6390 = Bearish

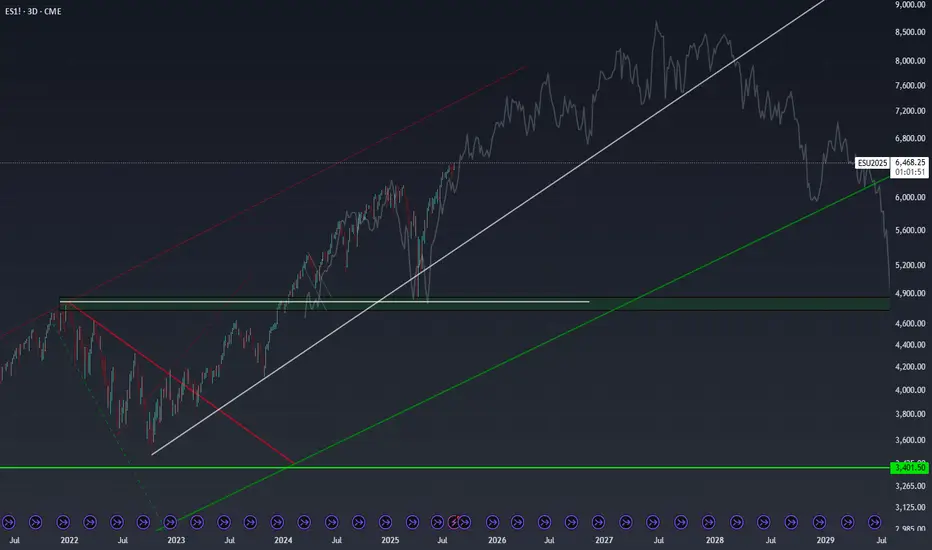
Are We Replaying the Dot Com Era?I’m completely unbiased here - more so curious - but today’s S&P 500 setup looks eerily similar to the late 1990s. In 1996 and 1997, the index posted back-to-back gains of over 20%, just as 2023 and 2024 have done. Then, in 1998, we saw a sharp 20% pullback - much like the one we’ve had in April of 2025. If you overlay that late-’90s fractal on today’s chart, the trajectory points to an S&P 500 level near 8,200 by early 2027.
The bullish case practically writes itself: strong GDP growth, resilient corporate earnings, AI-driven productivity gains, a still-accommodative liquidity backdrop, and investors willing to pay up for growth narratives—just as they did in the dot-com era. The “there is no alternative” (TINA) mentality toward equities was alive then, and it’s alive now. If the trend holds, the next couple of years could deliver staggering upside.
That said, it’s purely an observation - not a prediction. A decisive break below the key rising support trendlines would negate this bullish scenario and shift me to a cautious or neutral stance. Until then, the pattern is worth keeping an eye on.
S&P500 Channel Up going straight to 6670.The S&P500 index (SPX) has been trading within a 3-month Channel Up since the May 12 candle. All of this time, it has been supported by the 1D MA50 (blue trend-line) and as long as it holds, the new Bullish Leg is expected.
The last two rose by +7.06%, and ahead of a new 1D MACD Bullish Cross, that gives us a medium-term Target of 6670.
-------------------------------------------------------------------------------
** Please LIKE 👍, FOLLOW ✅, SHARE 🙌 and COMMENT ✍ if you enjoy this idea! Also share your ideas and charts in the comments section below! This is best way to keep it relevant, support us, keep the content here free and allow the idea to reach as many people as possible. **
-------------------------------------------------------------------------------
Disclosure: I am part of Trade Nation's Influencer program and receive a monthly fee for using their TradingView charts in my analysis.
💸💸💸💸💸💸
👇 👇 👇 👇 👇 👇

S&P 500 (ES1!): Bullish! Look For Valid Buy Setups!In this video, we will analyze the following FX market for the week of Aug 11 - 15h:
S&P 500 (ES1!)
The S&P 500 rose Friday to close the week strong on a busy week of tariff updates and good earnings.
There is no reason to consider selling.
Wait for pullbacks to FVGs for high probability buys. Look for IRL to ERL, and repeat.
Enjoy!
May profits be upon you.
Leave any questions or comments in the comment section.
I appreciate any feedback from my viewers!
Like and/or subscribe if you want more accurate analysis.
Thank you so much!
Disclaimer:
I do not provide personal investment advice and I am not a qualified licensed investment advisor.
All information found here, including any ideas, opinions, views, predictions, forecasts, commentaries, suggestions, expressed or implied herein, are for informational, entertainment or educational purposes only and should not be construed as personal investment advice. While the information provided is believed to be accurate, it may include errors or inaccuracies.
I will not and cannot be held liable for any actions you take as a result of anything you read here.
Conduct your own due diligence, or consult a licensed financial advisor or broker before making any and all investment decisions. Any investments, trades, speculations, or decisions made on the basis of any information found on this channel, expressed or implied herein, are committed at your own risk, financial or otherwise.

NQ. Market Efficiency Paradigm. Weekly Outlook 10.08.2025, CME_MINI:NQ1!
Covered the daily and hourly order flow.

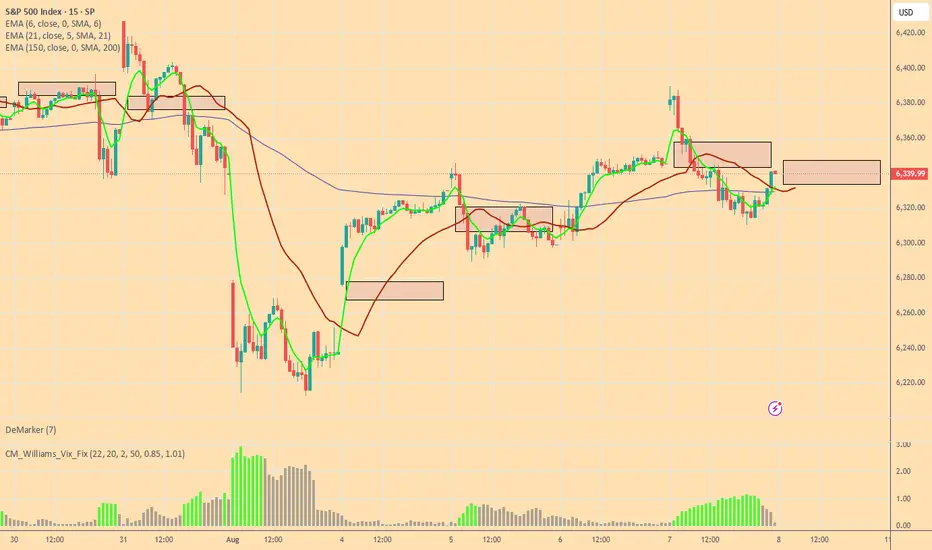
Day 5 — Trading Only S&P Futures — +$169, Managing the GrindWelcome to Day 5 of Trading Only S&P Futures!
Today I made +$169 trading ES futures. I was busy so mostly set bracket orders at major levels and let them do their work. The market was a nonstop grind upward, making trading a bit slow.
In hindsight, there was an A+ setup with a triple buy signal and market structure alignment that I wish I had sized heavier on to finish earlier.
📈 What you’ll learn
Using bracket orders to trade during busy days
Recognizing A+ setups with triple buy signals
Managing slow grinding markets with discipline
Key support and resistance levels to watch
⏰ Timestamps
0:00 — Intro & Day 5 Overview
0:30 — Trade Thoughts & Bracket Order Strategy
1:30 — VX Algo Signal Recap
2:30 — Market News Impact
3:00+ — Key Levels for Tomorrow
🔔 VX Algo Signals (9:30am – 2pm EST)
9:35 AM Market Structure flipped bullish on VX Algo X3!
10:50 AM VXAlgo NQ X1 Sell Signal
11:50 AM VXAlgo NQ X1 Buy Signal (triple buy)
📰 News Highlights
S&P 500 rises to end the week, Nasdaq hits a new record as Apple shares rally.
🔑 Key Levels for Tomorrow
Above 6367 = Remain Bullish
Below 6334 = Bearish

Review S&P 500 futures weekly chart - 8/8/2025Price is Knocking on the Door of All-Time Highs
The bulls are back in control. Price is pushing above the 6,400 magenta resistance, a level that has capped rallies before — and we’re now testing it head-on. The uptrend from the late-2022 low remains strong, with price riding comfortably above the green moving average ribbon like a surfer on a perfect wave.
The last big pullback in early 2024? It was a clean bounce off the 4,000–4,100 blue support zone, marked by a textbook "Bull Wick" reversal candle. That move lit the fuse for a powerful rally, and the setup now has a similar feel.
Key Levels I’m Watching
Resistance: 6,400 (magenta) – in play right now.
Support: 5,600 (red), 4,300 (blue), and a deeper 3,800 zone (blue).
History shows that breakouts above major resistance here have triggered multi-week runs.
The Indicator Story
MACD: Bullish crossover forming, histogram shifting into positive territory → momentum is building.
Stochastic RSI: Tapped overbought and curling slightly down → short-term cooling possible.
RSI: Near 70, still in bullish territory and not yet screaming overbought.
The Bigger Picture
On the weekly chart, the trend is undeniably strong. Price is above all major moving averages, and momentum is on the bulls' side.
However, with multiple oscillators sitting high, the market might need to catch its breath — either through a small pullback or sideways consolidation — before launching into the next leg higher.
Bottom Line
The breakout is here, but confirmation is key. A strong push and close above 6,400 could open the door to another sustained rally. If the breakout fails, I’ll be watching the 5,600–5,400 range for signs of buyer defense.

Bulls and Bears zone for 08-08-2025ETH session has rallied to 61.8 Fibonacci level of yesterday's RTH session. Any test of ETH session High could provide direction for the day.
Level to watch: 6384 --- 6386
Day 4 — Trading Only S&P Futures — +$207, Patience Pays OffWelcome to Day 4 of Trading Only S&P Futures!
After two tough losing days, I took a morning yoga session to clear my mind and approach the market calmly. I started trading late but found a strong A+ setup near 6355, aligned with a major gamma zone and RSI signals, which led to a $200+ profit.
📈 What you’ll learn
The importance of mindset and mental clarity in trading
How to identify strong setups using market structure and gamma zones
Reading RSI on multiple timeframes for confirmation
Managing risk and knowing when to call it a day
⏰ Timestamps
0:00 — Intro & Day 4 Overview
0:30 — Mindset Reset & Trade Recap
1:30 — VX Algo Signal Recap & Setup Breakdown
3:00 — Market News & Impact
3:30 — Key Levels for Tomorrow
4:00 — Closing Thoughts & Next Steps
🔔 VX Algo Signals (9:30am – 2pm EST)
9:39 AM Market Structure flipped bullish on VX Algo X3!
11:20 AM VXAlgo ES X1 Buy signal (triple buy)
11:52 AM VXAlgo ES X1 Buy signal
12:40 PM VXAlgo ES X1 Sell signal
📰 News Highlights
U.S. jobless claims rose to 226,000 vs. estimate 221,000, signaling increased layoffs.
🔑 Key Levels for Tomorrow
Above 6332 = Remain Bullish
Below 6315 = Bearish

Day 3 — Trading Only S&P 500 FuturesDay 3 — Trading Only S&P Futures
Daily P/L: -142.87
Sleep: 7 hours
Emotions: Headache & stress from the morning
:thought_balloon: Today’s Trade thoughts:
I made a typo when i was putting some orders in from last night that triggered and started the day -300 so I spent most of today just grinding it back again.
I think going forward, I am going to make a rule to limit myself of only doing 2 MES MAX during night time if i plan to put orders in because it really sadden the mood when you start the day negative.
Overall, today's trading day wasn't that bad, we had bullish structure and AAPL event that carried the market up. I took some shorts at 6355 that didn't work out but eventually made money at the end of the day as i shorted 6375 zones. I have noticed that** max Gamma levels don't truly settle until 11am. **
:bell:News Highlights:
*TRUMP TO IMPOSE ADDITIONAL 25% TARIFF ON GOODS FROM INDIA
:bar_chart: VX Algo Signals (9:30am – 2pm EST):
9:30 AM Market Structure flipped bullish on VX Algo X3! @everyone*
10:20 AM VXAlgo NQ X1 Sell Signal
11:00 AM Market Structure flipped bullish on VX Algo X3!
11:40 AM VXAlgo ES X1 Sell Signal
12:20 PM VXAlgo ES X1 Sell Signal (double sell)
1:40 PM VXAlgo NQ X1DD Buy Signal (double buy)
:chart_with_upwards_trend: Key Levels for Tomorrow:
Above 6332 = Remain Bullish
Below 6315 = Bearish

Day 2 — Trading Only S&P Futures — -$100, Grinding Back from Los Day 2 — Trading Only S&P Futures
Daily P/L: -100
Sleep: 8 hours
Emotions: Good
:thought_balloon: Today’s Trade thoughts:
I rushed into a trade thinking 6330 was going to be a good area of support to buy and oversized my position going 5 mes deep in my first trade and adding 5 more at the 48 min MOB at 6325 and got stopped out at the bottom down -400 and pretty much spent the rest of the day grinding back up.
Overall market seem to have rejected the higher timeframe resistance and deciding which direction to go.
:bell:News Highlights:
U.S. STOCKS END LOWER, VIX JUMPS AFTER WEAK ISM SERVICES DATA
:bar_chart: VX Algo Signals (9:30am – 2pm EST):
— 9:30 AM VXAlgo ES X1 Buy signal
— 9:40 AM VXAlgo NQ X1 Buy Signal
— 9:48 AM Market Structure flipped bullish on VX Algo X3!
— 11:00 AM VXAlgo ES X1 Buy signal (triple buy signal)
— 12:50 PM VXAlgo NQ X1DD Sell Signal
— 1:00 PM Market Structure flipped bullish on VX Algo X3!
— 1:30 PM VXAlgo NQ X1DD Buy Signal**
:chart_with_upwards_trend: Key Levels for Tomorrow:
Above 6332 = Bullish
Below 6310 = Bearish

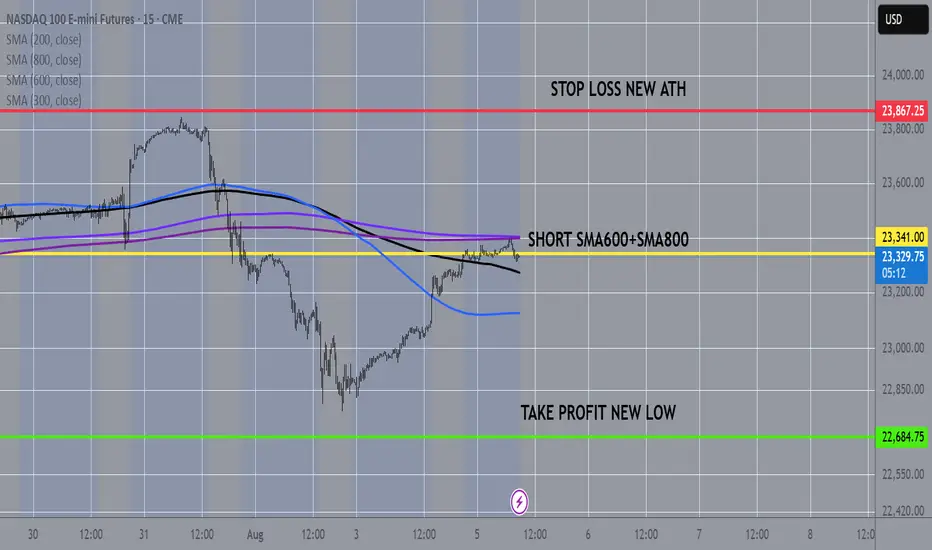
NASDAQ100 15MIN CHART FROM SMAS TO NEW LOWNasdaq100 at 10 and 15min chart touches the sma600 and the sma800 so as in many other cases before, odds are are more that it will fall from here to a new low
Day 1 Trading Only S&P Futures — Starting with $200 Profit
Day 1 — Trading Only S&P Futures
Daily P/L:+ 204 :moneybag:
Sleep: 8 hours
Emotions: Tired and sored from muay thai.
:thought_balloon: Today’s Trade thoughts:
I was leaning bearish in the market because we had such strong selling pressure on Friday butonce we broke over the level i posted last week at 6330, I gave up on my bias and I just followed the signals and traded the the X1dd buy signal with @gohawks14 and shorted the Max gamma resistance around 6352 and called a day when i made $200.
I think for this week as we start the trading challenge, I want to have one account where i just make $200 and call it a day so this way i can build consistency and get my trading % up.
:bell:News Highlights:
DOW REBOUNDS NEARLY 600 POINTS, VIX PLUNGES AS U.S. STOCKS END SHARPLY HIGHER ON RATE-CUT OPTIMISM
:bar_chart: VX Algo Signals (9:30am – 2pm EST):
9:00 AM Market Structure flipped bullish on VX Algo X3!
10:10 AM VXAlgo NQ X1 Sell Signal
10:40 AM VXAlgo ES X1 Sell Signal
11:40 AM VXAlgo NQ X1DD Buy Signal (Double buy signal)
11:40 AM VXAlgo ES X1 Buy signal
12:40 PM VXAlgo NQ X1 Sell Signal
1:21 PM VXAlgo ES X1 Sell Signal
2:00 PM VXAlgo ES X3 Sell Signal
:chart_with_upwards_trend: Key Levels for Tomorrow:
Above 6332 = Bullish
Below 6300 = Bearish
:link: Recap & Charts: www.tradingview.com

S&P 500: Bearish For The Short Term! Sell It!Welcome back to the Weekly Forex Forecast for the week of July 28 - Aug 1st.
In this video, we will analyze the following FX market for the week of Aug 4-8th:
S&P 500 (ES1!)
The S&P 500 rose Friday to fresh highs, following a busy week of tariff updates and earnings. The S&P ended the week with its fifth straight record close, its longest such streak in over a year.
No reason to consider selling. Wait for pullbacks to FVGs for high probability buys.
FOMC and NFP loom. Be careful to avoid new entries during news times.
Enjoy!
May profits be upon you.
Leave any questions or comments in the comment section.
I appreciate any feedback from my viewers!
Like and/or subscribe if you want more accurate analysis.
Thank you so much!
Disclaimer:
I do not provide personal investment advice and I am not a qualified licensed investment advisor.
All information found here, including any ideas, opinions, views, predictions, forecasts, commentaries, suggestions, expressed or implied herein, are for informational, entertainment or educational purposes only and should not be construed as personal investment advice. While the information provided is believed to be accurate, it may include errors or inaccuracies.
I will not and cannot be held liable for any actions you take as a result of anything you read here.
Conduct your own due diligence, or consult a licensed financial advisor or broker before making any and all investment decisions. Any investments, trades, speculations, or decisions made on the basis of any information found on this channel, expressed or implied herein, are committed at your own risk, financial or otherwise.

Gold Weekly Outlook. 03.08.2025, SundayCOMEX:GC1!
Expecting a run up to daily BPR. Previous weekly closure suggesting bullish price action on Gold. Paytience is the key

08/1/25 Trade Journal, and ES_F Stock Market analysis EOD accountability report: +440
Sleep: 6 hours
Overall health: Good
VX Algo System Signals from (9:30am to 2pm)
— 9:30 AM Market Structure flipped bearish on VX Algo X3!
— 10:12 AM VXAlgo ES X1 Buy signal
— 10:20 AM VXAlgo NQ X1 Buy Signal
—12:30 PM Market Structure flipped bullish on VX Algo X3!
— 1:00 PM Market Structure flipped bearish on VX Algo X3!
— 1:50 PM VXAlgo ES X1 Buy signal,
— 3:00 PM Market Structure flipped bullish on VX Algo X3!**
What’s are some news or takeaway from today? and What major news or event impacted the market today?
Market range expanded a lot today, we dropped over 100 points today and sometimes i forget to adjust my bracket orders to go for 10 -15 points take profits when the volatility is so high. But overall, it was a good day, I knew to be patient as market was wild and sometimes you want to just snipe a few trades and call it a day before you get caught on the wrong side.
The great thing about big moves is that it will eventually hit a major level and it will react really well, you just have to wait for it.
a great question is will the market recover? Or is going back down to April prices?
News
*STOCKS TUMBLE TO END THE WEEK, VIX SPIKES AS SOFT JOBS DATA STOKE ECONOMIC JITTERS
What are the critical support levels to watch?
--> Above 6330= Bullish, Under 6310= Bearish

Daily Orderflow on ES and NQ. 01.08.2025, NFP FridayCME_MINI:NQ1! CME_MINI:ES1!
Orderflow explanation. Sessional delivery and New York Price action

SPX to 6600+ by Aug 5This leg up in SPX is not over yet. Target at upper bound of the channel around 6.6K+ by Aug 5.

S&P 500 (ES1): Post FOMC, Buyers Pushing Back To The Highs!In this video, we will analyze the following FX market for July 31 - Aug 1st.
S&P 500 (ES1!)
In the Weekly Forecast for the S&P 500, we highlighted:
- price is bullish, and expected to go higher. It did move to ATH before pulling back.
- the sell side liquidity under the ascending lows would draw price.... which it did.
- the Area of Fair Value below the lows, with the Demand Zone as the potential level where a
a high probability long could setup.... which was spot on!
Did you benefit from the forecast? Let me hear from you if you did, in the comment section.
Enjoy!
May profits be upon you.
Leave any questions or comments in the comment section.
I appreciate any feedback from my viewers!
Like and/or subscribe if you want more accurate analysis.
Thank you so much!
Disclaimer:
I do not provide personal investment advice and I am not a qualified licensed investment advisor.
All information found here, including any ideas, opinions, views, predictions, forecasts, commentaries, suggestions, expressed or implied herein, are for informational, entertainment or educational purposes only and should not be construed as personal investment advice. While the information provided is believed to be accurate, it may include errors or inaccuracies.
I will not and cannot be held liable for any actions you take as a result of anything you read here.
Conduct your own due diligence, or consult a licensed financial advisor or broker before making any and all investment decisions. Any investments, trades, speculations, or decisions made on the basis of any information found on this channel, expressed or implied herein, are committed at your own risk, financial or otherwise.

**07/31/25 Trade Journal, and ES_F Stock Market analysis **
EOD accountability report: +
Sleep: 5.5 hours
Overall health: Good
** VX Algo System Signals from (9:30am to 2pm) **
— 9:00 AM Market Structure flipped bullish on VX Algo X3
— 9:30 AM VXAlgo ES X7 Sell signal
— 9:32 AM Bullish market structure got cancelled
— 11:40 AM VXAlgo NQ X1 Buy Signal
— 12:40 PM VXAlgo NQ X1 Sell Signal
— 1:00 PM Market Structure flipped bullish on VX Algo X3!
— 1:22 PM if we lose 6415 and stayy under it . Bullish Market structure is cancelled.
— 1:55 PM VXAlgo NQ X1 Buy Signal
What’s are some news or takeaway from today? and What major news or event impacted the market today?
Today marked the 4th day of the structure signals being iffy as they try to tip the volumes bullish just to cancel it right afterwards.
I was starting to get a bit tilted today as I had a bunch of orders at area that didn't get filled and eventually just gave up trying to have a green day and walked away.
looking at some of the other charts, i also we are getting a doji on the longer time frames and it is starting to look like bear's wet dream.
However, Mag 7 stock earnings were really great, the only downside was rate cut isn't happening.
News
*U.S. STOCKS END LOWER, VIX JUMPS AS S&P 500, NASDAQ RETREAT FROM RECORDS DESPITE MONSTER META AND MICROSOFT EARNINGS
What are the critical support levels to watch?
--> Above 6415= Bullish, Under 6403= Bearish

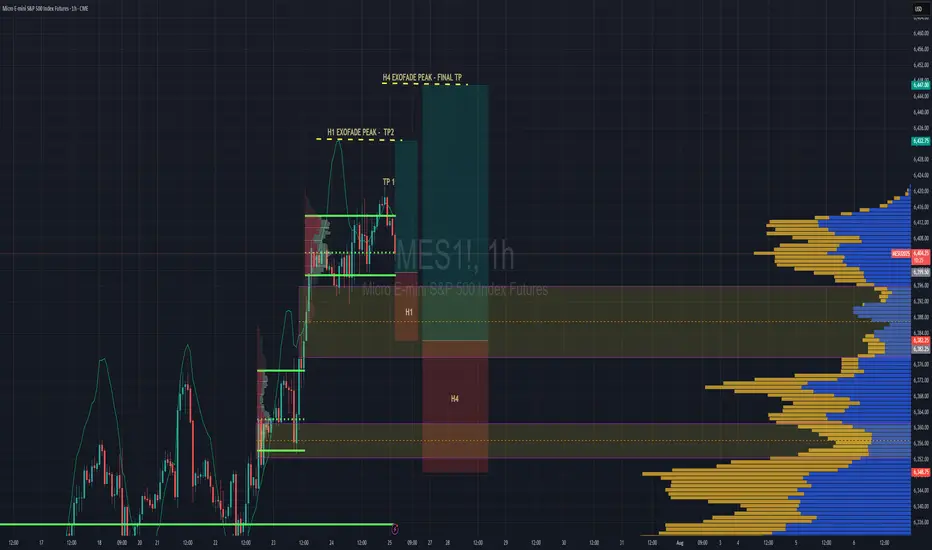
S&P 500 Intraday & Swing Entries H1 entry is close to getting activated for intraday.
If you want a swing trade then wait for H4 entry (you might be waiting a while obviously)
Reason for entries - We have broken out of Balance since July 25th and currently in a trend phase until we establish a new value area, or return to the one we broke out from.
So since Trend and Momentum is UP, then we should find Low Volume Areas to enter in the direction of the trend for a classic pullback entry trade.
07/30/25 Trade Journal, and ES_F Stock Market analysis EOD accountability report: +960
Sleep: 5 hours
Overall health: still struggling with sleep due to heat waves
VX Algo System Signals from (9:30am to 2pm)
— 8:30 AM Market Structure flipped bearish on VX Algo X3!✅
— 9:45 AM Market Structure flipped bullish on VX Algo X3! ✅
— 10:30 AM Market Structure flipped bullish on VX Algo X3!❌
— 11:30 AM Market Structure flipped bearish on VX Algo X3!❌
— 12:00 PM VXAlgo NQ X1DD Buy Signal, ✅
— 12:30 PM Market Structure flipped bullish on VX Algo X3!✅
What’s are some news or takeaway from today? and What major news or event impacted the market today?
I have started to noticed that the last 3 days, we have been getting false triggers on market structure signals and it almost feels MM are trying to do it to break people's algo that trade on that.
This is a good reminder that no matter how successful the signal has been for the last 30 days, you still need to have risk management. additionally, it's also a good way to test people's faith and trick new traders in going back to doing random things because it makes them think market can behave randomly and nothing works.
this is why i always tell people to religiously test out a system for 30 days before giving up.
News
*FEDERAL RESERVE SKIPS RATE CUT, KEEPS FED FUNDS RATE AT 4.50%
What are the critical support levels to watch?
--> Above 6410= Bullish, Under 6400= Bearish
