#ETC/USDT The price is moving within an ascending channel#ETC
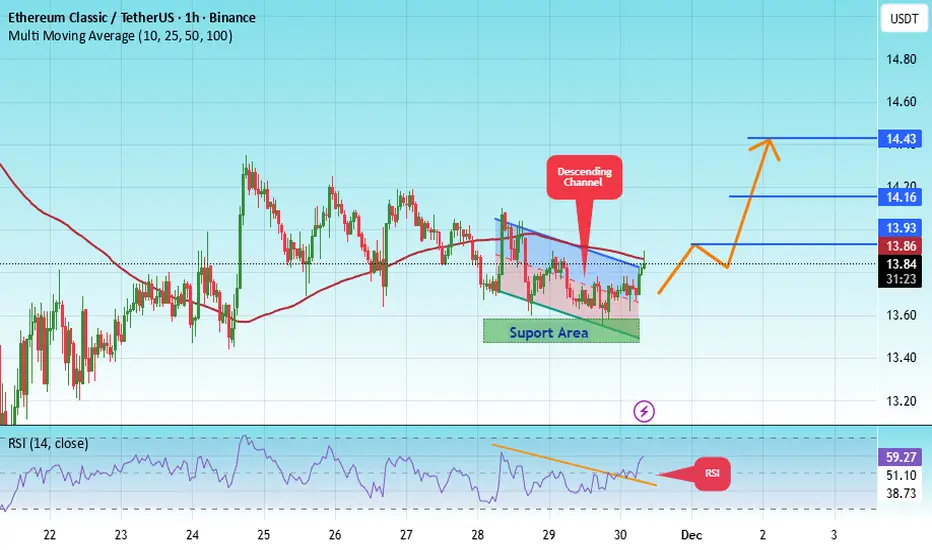
The price is moving in a descending channel on the 1-hour timeframe. It has reached the lower boundary and is heading towards breaking above it, with a retest of the upper boundary expected.
We have a downtrend on the RSI indicator, which has reached near the lower boundary, and an upward rebound is expected.
There is a key support zone in green at 13.86. The price has bounced from this zone multiple times and is expected to bounce again.
We have a trend towards stability above the 100-period moving average, as we are moving close to it, which supports the upward movement.
Entry price: 13.86
First target: 13.93
Second target: 14.16
Third target: 14.43
Don't forget a simple principle: money management.
Place your stop-loss below the support zone in green.
For any questions, please leave a comment.
Thank you.
Etc
ETCUSD - Upside Potential 700% (Check ETCETH also)Hi.
Considering the low price and decent fundamentals, ETC is a good entry.
Not a trading advice.
Thanks
Gex
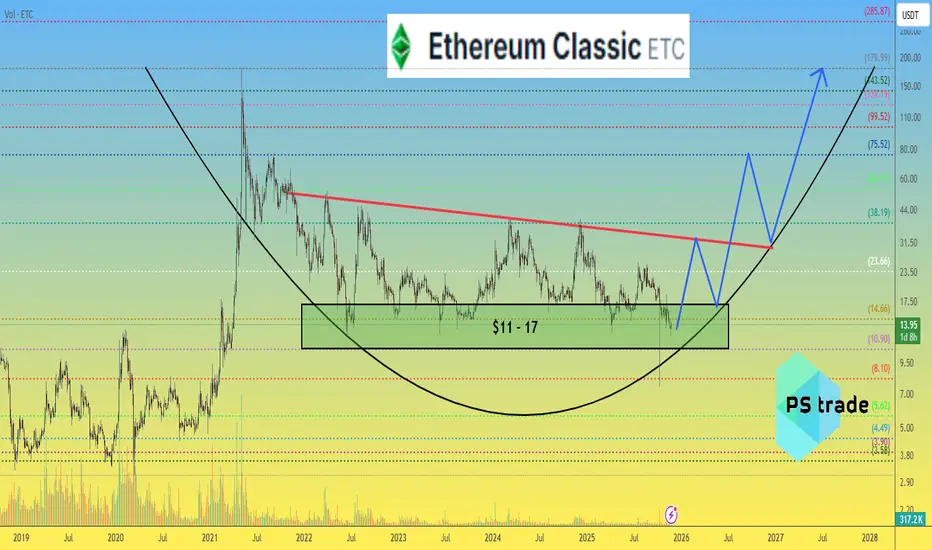
Ethereum Classic ETC price analysis#ETC continues to respect a well-defined multi-year support range at $11–17, which has historically served as a base for upward expansions.
Key resistance levels to watch:
• $32 • $75 • $180
The current market capitalization of $2.15B suggests that even a 2x–5x-10x appreciation would be noticeable for chart analysts, but insufficient to shift broader market dynamics.
Nevertheless, #ETC remains relevant for traders monitoring undervalued legacy assets with long accumulation phases.
Question:
Do you consider OKX:ETCUSDT a viable mid-cycle opportunity, or is its structural momentum too weak for strong upside continuation?
______________
◆ Follow us ❤️ for daily crypto insights & updates!
🚀 Don’t miss out on important market moves
🧠 DYOR | This is not financial advice, just thinking out loud
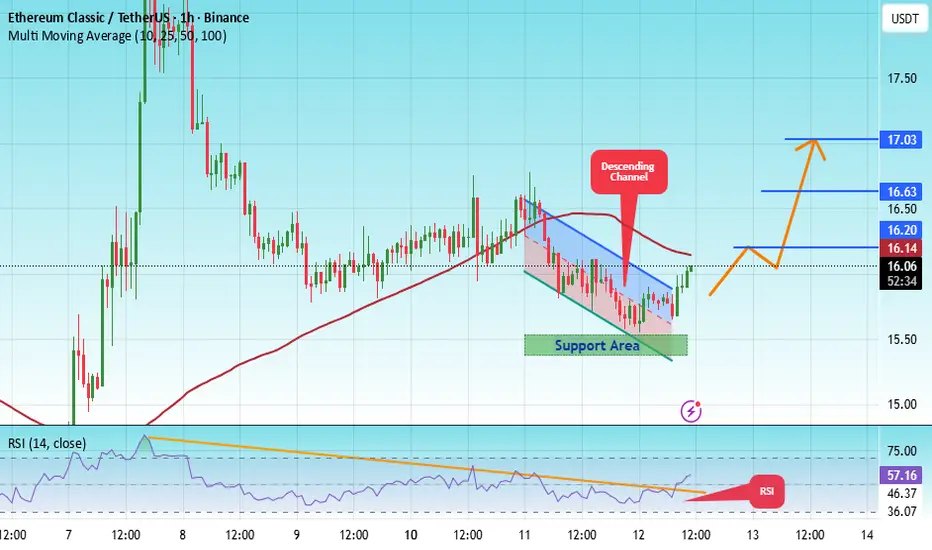
#ETC/USDT #ETC The price is moving within an ascending channel #ETC
The price is moving within an ascending channel on the 1-hour timeframe and is adhering to it well. It is poised to break out strongly and retest the channel.
We have a downtrend line on the RSI indicator that is about to break and retest, which supports the upward move.
There is a key support zone in green at the 15.50 price, representing a strong support point.
We have a trend of consolidation above the 100-period moving average.
Entry price: 16.00
First target: 16.20
Second target: 16.63
Third target: 17.00
Don't forget a simple money management rule:
Place your stop-loss order below the green support zone.
Once you reach the first target, save some money and then change your stop-loss order to an entry order.
For any questions, please leave a comment.
Thank you.
#ETC/USDT Might Be Good Zone to Bounce From#ETC
The price is moving within an ascending channel on the 1-hour timeframe and is adhering to it well. It is poised to break out strongly and retest the channel.
We have a downtrend line on the RSI indicator that is about to break and retest, which supports the upward move.
There is a key support zone in green at 15.50, representing a strong support point.
We have a trend of consolidation above the 100-period moving average.
Entry price: 15.85
First target: 16.08
Second target: 16.32
Third target: 16.68
Don't forget a simple money management rule:
Place your stop-loss order below the support zone in green.
Once the first target is reached, save some money and then change your stop-loss order to an entry order.
For any questions, please leave a comment.
Thank you.

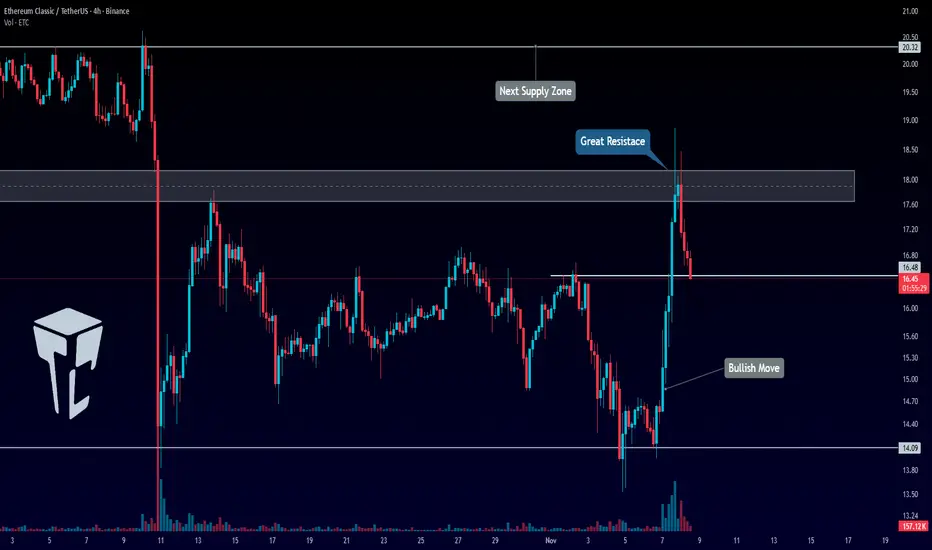
TradeCityPro | ETC: Key Levels and Trend Analysis👋 Welcome to TradeCity Pro!
In this analysis, I want to review the ETC coin—one of the Layer 1 projects with a market cap of $2.57 billion, currently ranked 39th on CoinMarketCap.
⏳ 4-Hour Timeframe
On the 4-hour timeframe, this coin made an upward move after being supported at the 14.09 level and was able to reach around the $18 zone.
✅ Currently, the price has had a minor correction, dropping to near the 16.48 level.
🎲 If the 18$ level is broken, the continuation of the move will begin, and we can use this as a trigger for a long position.
✨ If the correction continues and the 16.48 level is broken, the price could undergo deeper corrections.
📊 Currently, the volume is in favor of the buyers, and the volume has been decreasing during the correction. Therefore, if the price moves towards the 18$ zone with increasing volume, we can open a long position.
⭐ The main confirmation for a bullish trend on this coin will be breaking the 18$ zone and setting a higher high and low beyond this level. The next resistance level for the price is at 20.32$.
📝 Final Thoughts
Stay calm, trade wisely, and let's capture the market's best opportunities!
This analysis reflects our opinions and is not financial advice.
Share your thoughts in the comments, and don’t forget to share this analysis with your friends! ❤️
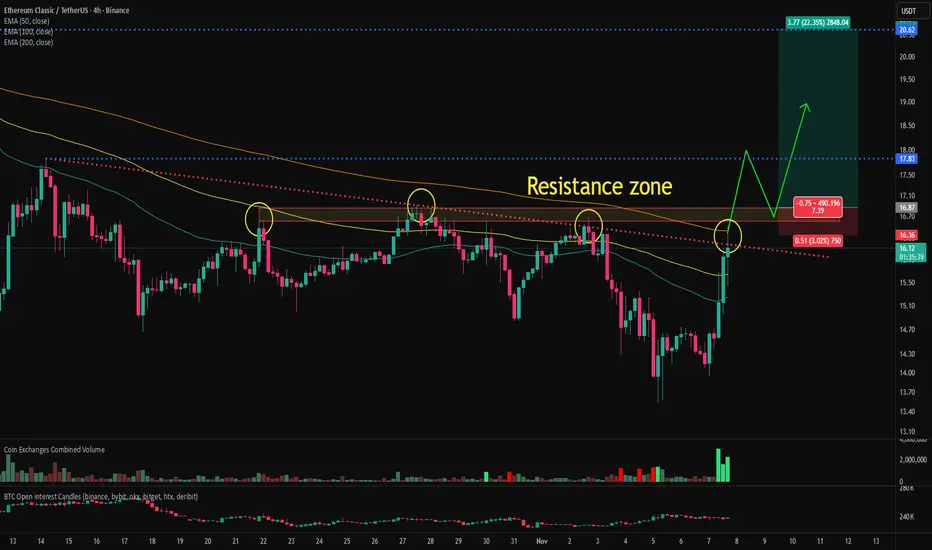
ETC(ehereum classic) chart analysis and bullish signalEthereum Classic is currently attempting to break above the 200-period moving average, a key resistance level, and a major supply zone on the 4-hour chart. Although it’s facing resistance at the moment, a decisive breakout through these overlapping resistance zones could provide an attractive long-entry opportunity with a favorable risk-to-reward ratio.
Given that this resistance area has rejected multiple breakout attempts in the past, the probability of a successful breakout this time appears relatively high.
The ETC/BTC chart has also cleared several major resistance levels, suggesting that ETC could follow a similar pattern to recent strong performers such as ZEC, DASH, and 1INCH.
The bullish alignment on the ETC/BTC chart also indicates that Ethereum Classic is outperforming Bitcoin.
If Ethereum Classic confirms a breakout above the resistance zone, I will share an updated analysis on the subsequent price outlook.
ETC - BEARISH OUTLOOKBME:ETC - price update: 🔴
The current price is sitting on a key support monthly/weekly. .
PA looks weak at the moment, but support are holding.
Yellow zone: 14.50 - 16.80$ = Neutral.
Prices remain stuck under key level, and bias is clearly bearish yet.
A daily candle close under 14.00$ could trigger another big bearish breakout toward 11.50 - 10.00$ or even 8.00$ again!
Upper key resistance:
16.80 - 17.70 - 20.00$ & downtrend daily!
To sum up:
No bull pressure yet, prices is stuck under key levels, and support could be break by the downside! 📉🔴

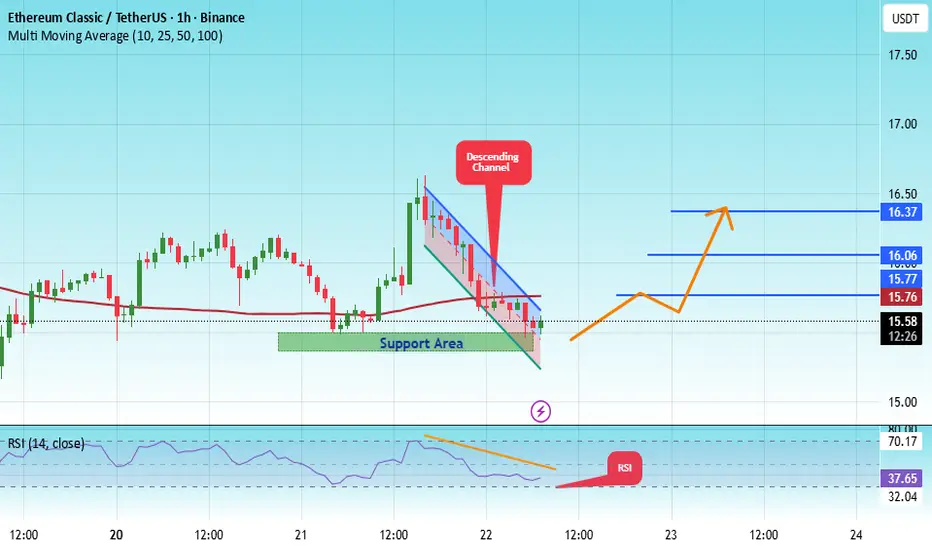
#ETC/USDT Might Be Good Zone to Bounce From#ETC
The price is moving within a descending channel on the 1-hour frame, adhering well to it, and is heading for a strong breakout and retest.
We have a bearish trend on the RSI indicator that is about to be broken and retested, which supports the upward breakout.
There is a major support area in green at 15.41, representing a strong support point.
We are heading for consolidation above the 100 moving average.
Entry price: 15.60
First target: 15.76
Second target: 16.06
Third target: 16.37
Don't forget a simple matter: capital management.
When you reach the first target, save some money and then change your stop-loss order to an entry order.
For inquiries, please leave a comment.
Thank you.
ETCUSDT — The Final Defense Zone Before a Major Move?Ethereum Classic (ETC) is once again standing at its final line of defense — the multi-year support zone between 16.40–13.50, which has successfully absorbed selling pressure several times since 2021.
This area is not just a price range; it’s a psychological stronghold that separates the potential for a massive rebound from the risk of a full-scale breakdown.
For more than three years, ETC has been forming a range-base accumulation structure, where every dip into this zone has triggered strong buying interest.
However, each rally has also failed to create higher highs — a clear signal that supply pressure remains dominant in the mid-term structure.
At this point, the market is in equilibrium — a tension zone between buyers defending the historical base and sellers pressing for continuation.
The next decisive move will be determined right here, inside the yellow block.
---
Bullish Scenario — Reclaim and Rally
If price holds above 16.40 and manages to close a weekly candle above 20.94 with strong buying volume, ETC could begin a structural reversal toward 24.95 and 36.85.
Such a move would confirm that the capitulation phase has ended and that a new accumulation cycle is underway.
Key confirmations:
Weekly close above 20.94
Higher low formed above 16.4
Rising weekly volume
Upside targets:
24.95 → 36.85 → 48.30
---
Bearish Scenario — Breakdown of the Base
Failure to defend the zone, especially with a weekly close below 13.50, would confirm a breakdown of the multi-year base.
This could trigger a new distribution phase, with potential downside targets at 11.00, 8.00, and possibly a wick toward 7.00 as liquidity gets swept.
Key confirmations:
Weekly close below 13.50
Failed retest (support turns to resistance)
Increasing sell volume
Downside targets:
11.20 → 8.00 → potential liquidity sweep near 7.00
---
Pattern Structure
Range Base Accumulation: multi-year accumulation between 13–36 since 2021.
Descending Structure: a series of lower highs, showing continuous supply pressure.
Liquidity Sweep: a deep wick to the 7.0 area indicates previous stop-hunts and possible smart-money accumulation.
Decision Point: 16.4–13.5 remains the make-or-break level that will define ETC’s long-term direction.
---
Conclusion
ETC is at a major decision point after years of sideways consolidation.
If the support holds, the asset could trigger a macro reversal and join the next major crypto bull cycle.
But if it breaks down, the fall could be steep — as liquidity below this zone is thin.
The 16.4–13.5 zone is the last line between hope and capitulation.
Watch the weekly close — that’s where the next big move will be decided.
---
#ETC #ETCUSDT #EthereumClassic #CryptoAnalysis #SwingTrading #TechnicalAnalysis #SupportResistance #WeeklyChart #CryptoBreakout #MarketStructure

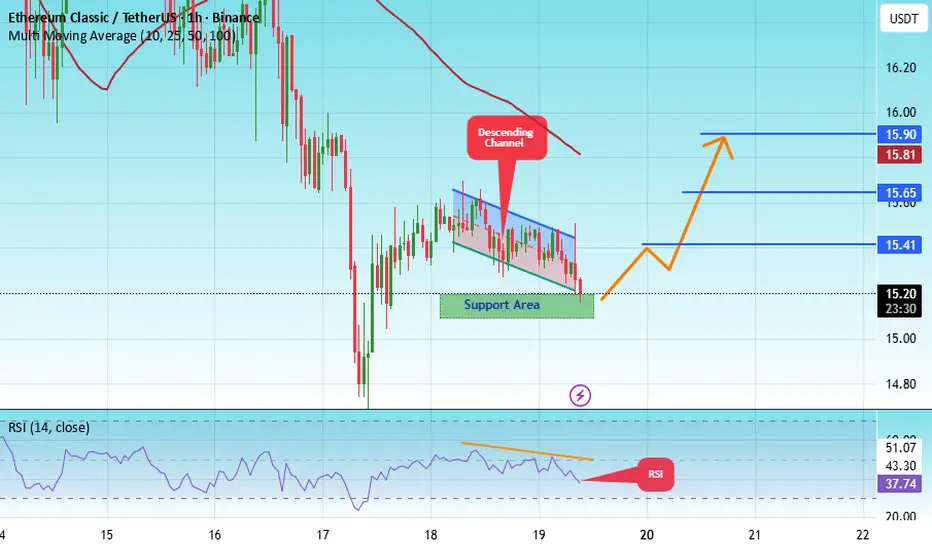
#ETC/USDT Might Be Good Zone to Bounce From#ETC
The price is moving within a descending channel on the 1-hour frame, adhering well to it, and is heading for a strong breakout and retest.
We have a bearish trend on the RSI indicator that is about to be broken and retested, which supports the upward breakout.
There is a major support area in green at 15.10, representing a strong support point.
We are heading for consolidation above the 100 moving average.
Entry price: 15.21
First target: 15.41
Second target: 15.65
Third target: 15.90
Don't forget a simple matter: capital management.
When you reach the first target, save some money and then change your stop-loss order to an entry order.
For inquiries, please leave a comment.
Thank you.
ETCUSD - Symmetrical TriangleA symmetrical Triangle can be seen on this daily timeframe
Currently price is trending along the lower trend line of this formation
As seen previously price likes to jump up from this line.
Bullish situation following breakout.

ETC - Ready to ExplodeTalked about this on todays Live Stream
Broke out of side ways accumulation
and is now currently in another side ways accumulation
Price action at top of accumulation range
- would like to see a retracement
( about the mid-line of the zone )
before upward continuation
Alert Set
Instructions on chart
NFA - Not Financial Advice
Join the Streams for Free Mentorship

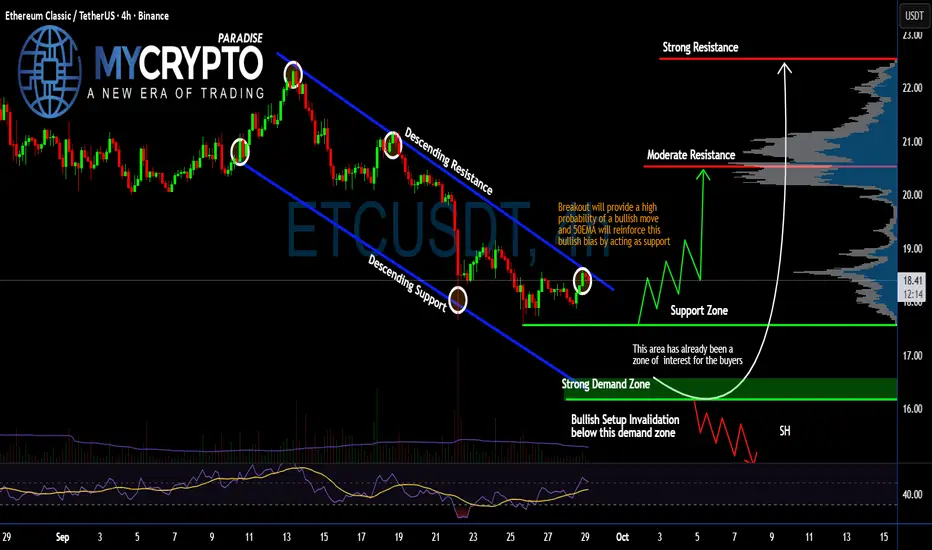
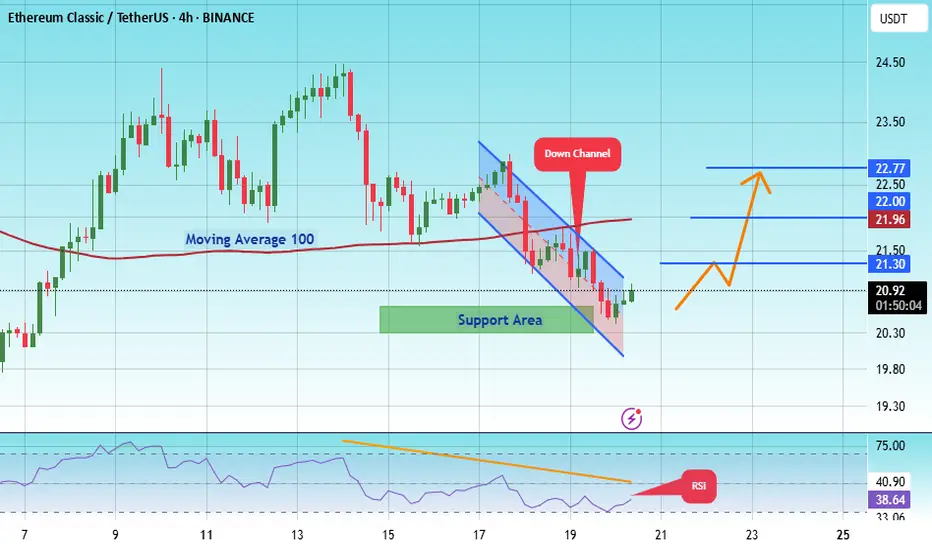
#ETC Bulls Ready For a Pullback or Not? Watch Closely for Trap Yello Paradisers! Are we about to witness #EthereumClassic finally escape this downtrend channel, or another trap lies ahead? Let's break down the #ETC setup before the trap springs:
💎#ETCUSDT has been grinding inside a clear descending channel in the 4-hour timeframe and bouncing consistently between its descending resistance and support. Price is now pushing right against the top of this channel, and this pressure is building. Any clean breakout from here will be a strong bullish signal, especially with the 50EMA lining up perfectly to act as dynamic support if the move confirms.
💎The current support zone around $17.58 has already shown buyer interest recently. A bounce from here and a breakout above the descending resistance would trigger upside momentum, with the first key test being the moderate resistance at $20.54.
💎Once #ETCUSD breaks that, we’re eyeing the final strong resistance around $22.54 — a level where smart money is likely preparing to take profits. You need to watch the volume to confirm the breakout and retest constantly.
💎However, a failure to break out, or worse, a breakdown below the strong demand zone at $16.17, would completely invalidate the bullish scenario. This area is the last line of defense. If it collapses, the next leg down could accelerate fast, triggering a deeper correction and taking out over-leveraged long positions in the process.
Strive for consistency, wait for clear confirmations, and remember that discipline always beats chasing quick profits.
MyCryptoParadise
iFeel the success🌴
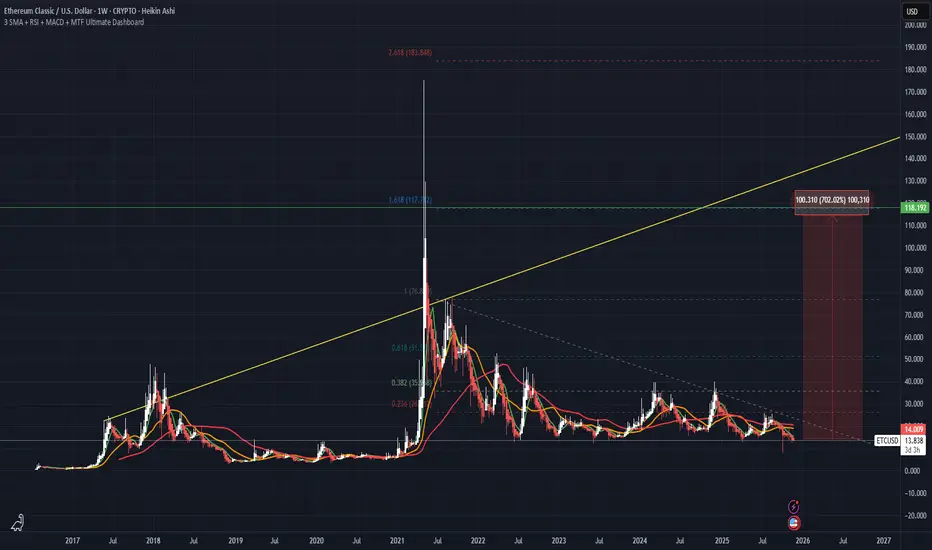
ETC Main Trend. Ascending Channel (all time) 10 2025Time frame: 1 week. Logarithm.
🔵Main trend: ascending, rising channel, since the inception of cryptocurrency.
🟡Secondary trend: descending, transitioning to a sideways trend (#accumulation), and forming a 4.9-year symmetrical triangle.
🟣Local trend: descending, trapped in the corner of a large triangle and “tension” consolidation before exiting.
Manage your risks and stick to your trading plan, don't get caught up in market and news noise, which creates dominant opinions and illogical actions by the majority, who are doomed to lose in the future.
Everything will be as it usually is with assets (stocks, less so cryptocurrencies. These are just a few examples of how these aren't real assets, but imitations of usefulness, i.e., a complete scam market). These assets have maintained an upward primary trend for a long time (from the very beginning), and huge, multi-year patterns form near dynamic support. That is, an upward breakout may initially throw passengers under the market , or some fictitious cryptocurrency events before a price rise (on a large time frame) don't be alarmed; ignore them, or use this opportunity to reduce the average price of the overall position. Or rather, before a dominant trend change, the "point of no return."
A striking example of this is XRP with its huge triangle and its exit (the first wave +600%, which is a capitulation on profits, or, in slang, a "hamster pump"). Then there will be 2-3 waves of price growth pumps, with each consolidation in the trend being "buried" and the cry "all is lost." In the final wave, possibly with spikes as before, a full-fledged #distribution zone will form.
XRP/USD Main Trend 07 2022
The market is simple at its core, but complex due to the interactions between people and their capital. The combination of simplicity and complexity creates many variations that you can exploit to profit from it. Your success and understanding of this determines your profit or loss in speculative markets.
You can complicate things without understanding their simplicity, which looks ridiculous from the outside. Playing smart. Or, conversely, simplifying complex, often false, concepts so that everything becomes clear and understandable. Simplicity is the essence of complexity.
In any activity, you should not pursue complexity to achieve the desired result, but rather simplification and optimization, so that you can achieve the same or better results with less effort and risk.
The entire secondary trend and this triangle with a local denouement zone in it.
Your trading plan and risk management eliminate all worries, indecision, emotional outbursts, predictions, and other people's right and wrong opinions.
ETC Secondary Trend 4.9 Year Triangle (like XRP) 10/2025Logarithm. Time frame: 1 week. Declines from the high in the secondary trend, as before -92%. Formation of the #accumulation zone. Price is being squeezed into a corner.
🔵 Main trend — ascending, rising channel, since the inception of cryptocurrency.
🟡 Secondary trend — downward, transition to a sideways trend - #accumulation, and formation of a 4.9-year symmetrical triangle.
🟣 Local trend — downward, squeezed into the corner of a large triangle and "tension" consolidation before an exit.
Main Trend
Control your risks and stick to your trading plan. Don't get caught up in market and news noise, which shapes dominant opinions and the illogical actions of the majority, which are doomed to lose in the future.
Everything will be as it usually is with assets (stocks, cryptocurrencies, less often, are just a few examples of how these are not real assets, but imitations of usefulness, that is, a complete scam market), which have been around for a long time. For a while (from the very beginning), the upward primary trend is maintained, and huge, multi-year patterns are formed near dynamic support. That is, an upward breakout , perhaps initially throwing passengers under the market , or some fictitious cryptocurrency events before a price rise (on a large time frame). Don't be alarmed, but ignore them, or use this opportunity to reduce the average price of the overall position. Or rather, before a dominant trend change, the "point of no return."
A striking example of this is XRP with its huge triangle and its exit (the first wave +600%, which is a capitulation on profits, or, in slang, a "hamster pump"). Then 2-3 waves of price pumps, where at each consolidation in the trend they will "bury" and cry "all is lost." In the last wave, possibly with spikes as before, a full-fledged #distribution zone will form.
XRP/USD Main trend 07 2022

#ETC/USDT Might Be Good Zone to Bounce From#ETC
The price is moving within a descending channel on the 1-hour frame, adhering well to it, and is heading for a strong breakout and retest.
We have a bearish trend on the RSI indicator that is about to be broken and retested, which supports the upward breakout.
There is a major support area in green at 18.00, representing a strong support point.
We are heading for consolidation above the 100 moving average.
Entry price: 18.80
First target: 19.19
Second target: 19.60
Third target: 20
Don't forget a simple matter: capital management.
When you reach the first target, save some money and then change your stop-loss order to an entry order.
For inquiries, please leave a comment.
Thank you.
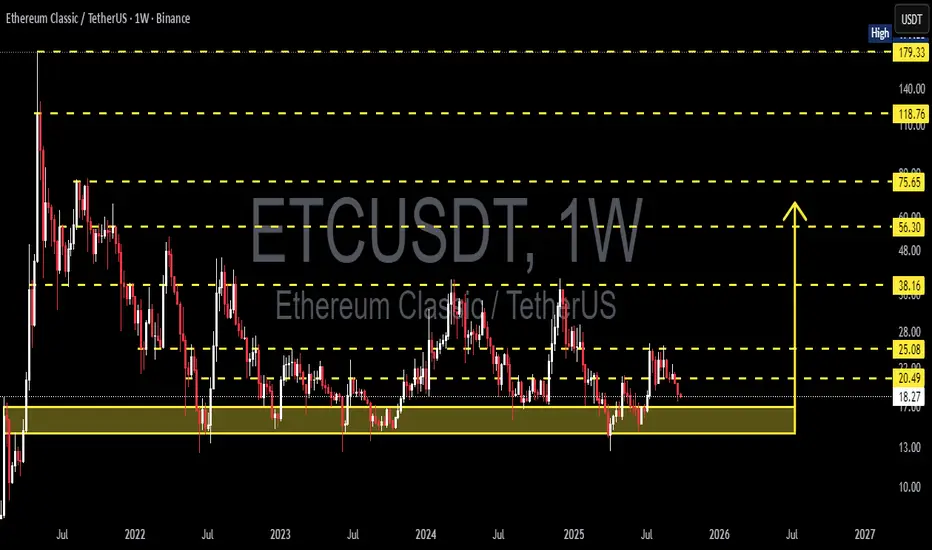
ETC/USDT — Major Support Retest, Breakout or Breakdown?🔎 Current Market Outlook
Current price: ~20.49 USDT
Price is approaching the critical support zone at 17–14 USDT (highlighted yellow).
This area has acted as a multi-year demand zone since 2021, where buyers repeatedly defended the level and triggered rebounds.
However, ETC has consistently failed to break major resistance levels, forming lower highs within a prolonged sideways range.
This makes the 17–14 zone a decision point: will buyers once again absorb supply and push for a rebound, or will sellers finally break the structure and trigger a deeper bearish trend?
---
📐 Market Structure & Price Pattern
1. Major Support Zone (17–14 USDT):
Tested multiple times since 2021.
Holding above → suggests strong accumulation.
Breaking below → could end the long-term sideways trend.
2. Key Resistance Levels:
25.08 USDT → first resistance to watch for breakout.
38.16 USDT → medium-term resistance.
56.30 & 75.65 USDT → major long-term supply zones.
Higher targets: 118.76 & 179.33 USDT (only relevant in a super bullish cycle).
3. Price Pattern:
Large sideways structure with lower highs.
Repeated tests of 17–14 → showing this demand zone is still crucial for market direction.
---
🐂 Bullish Scenario (If Buyers Defend)
Confirmation: Weekly close above 25.08 with strong volume.
Implication: Signals a new higher high on the weekly timeframe.
Targets:
TP1 → 38.16
TP2 → 56.30
TP3 → 75.65
Key Note: As long as 17–14 holds, ETC remains in accumulation territory with potential for a strong rebound in the next bullish phase.
---
🐻 Bearish Scenario (If Sellers Break Through)
Confirmation: Weekly close below 14 USDT.
Implication: Multi-year demand zone is invalidated.
Targets: Without solid support below, price could drop towards the psychological 10 USDT level or even lower.
Warning: A breakdown here would mark the end of the long-term sideways phase and trigger a deeper bearish leg.
---
🎯 Trading Strategy & Risk Management
1. Conservative Approach:
Wait for breakout >25.08 → enter long.
Targets: 38.16–56.30.
Stop loss below 22.
2. Aggressive Approach (buy the zone):
Enter within 17–14.
Stop loss below 14.
First target 25.08, scale out at 38.16.
3. Short Setup:
Only valid if weekly close <14 (confirmed breakdown).
Short-term target: 12 → 10 USDT.
⚠️ Note: This is a high risk/reward zone. Position sizing and clear stop-loss levels are critical.
---
✨ Conclusion
The 17–14 USDT support zone is ETC’s lifeline.
Holding above → accumulation continues, with rebound potential toward 25.08 → 38.16.
Breaking below 14 → long-term bearish breakdown with risk of a sharp decline.
Breakout above 25.08 → the first real trigger of a bullish trend reversal.
ETC is at a make-or-break moment. Traders should closely watch how weekly candles react around 17–14.
---
#ETC #EthereumClassic #Crypto #Altcoins #TechnicalAnalysis #PriceAction #SwingTrade #SupportResistance #CryptoAnalysis #ChartPatterns
ETC is forming a potential double bottom pattern📊 BME:ETC Market Update
BME:ETC is forming a potential double bottom pattern 🔄. If it breaks out of the red resistance zone 🔴, the first target will be the 🔵 blue line level 🎯.

ETCUSDT 1D chart reviewTrend and structure
• The price is currently in the 20.40 USDT area.
• You can see the downward trend line (orange), from which the price was rejected several times.
• The next support:
• 20.40 USDT (local, just tested)
• 19.01 USDT (stronger support from earlier holes).
• The nearest resistance:
• 21.09 USDT (SMA + local level)
• 22.64 USDT (strong resistance, last peak before fall).
Medium walking
• SMA (red/green lines) show that the short -term price is below most of the average → supply advantage.
• Only breaking above 21.1–22.6 USDT could change the fondness for more bullfinches.
MacD
• The histogram grows slightly up (less red), but MacD lines and signal are close to each other → no clear trend, rather consolidation with slight relegation.
RSI
• RSI around 45–50, i.e. neutral.
• There is neither a sale (<30) nor purchase (> 70).
⸻
📊 scenario
• bull:
If ETC persists above 20.40 and boots over 21.1 USDT, it is possible to move in the direction of 22.6 USDT (main barrier).
• Bear:
If the price drops below 20.4 USDT, another goal is 19.0 USDT. Punction of 19 could open the road even towards 18-17.5 USDT.

#ETC/USDT Might Be Good Zone to Bounce From#ETC
The price is moving within an ascending channel on the 1-hour frame, adhering well to it, and is on its way to breaking strongly upwards and retesting it.
We have support from the lower boundary of the ascending channel, at 20.00.
We have a downtrend on the RSI indicator that is about to break and retest, supporting the upside.
There is a major support area in green at 20.43, which represents a strong basis for the upside.
Don't forget a simple thing: ease and capital.
When you reach the first target, save some money and then change your stop-loss order to an entry order.
For inquiries, please leave a comment.
We have a trend to hold above the 100 Moving Average.
Entry price: 20.95
First target: 21.30
Second target: 22.00
Third target: 22.77
Don't forget a simple thing: ease and capital.
When you reach the first target, save some money and then change your stop-loss order to an entry order.
For inquiries, please leave a comment.
Thank you.
ETCUSDT positionEthereum Classic Price Analysis:
Trend & Behavior: Price has dropped from 22.33 and is near support at 19.68. If it rebounds from this level, we could see an upward move, but if it breaks below 19.68, the downtrend could continue.
Support & Resistance:
Support: 19.68 is the key level. A bounce here may lead to an upward move toward 21.88 or 22.33.
Resistance: 22.33 and 21.88 are key resistances. If price fails to break them, expect a possible retracement.
Scenarios:
Bullish: If price reacts positively at 19.68, consider buying with targets at 21.88 or 22.33.
Bearish: If price breaks below 19.68, watch for further support at 18.87 or 17.36.
Strategy: Best to enter long if the price bounces from 19.68, but be cautious if it breaks below, as further declines could follow.

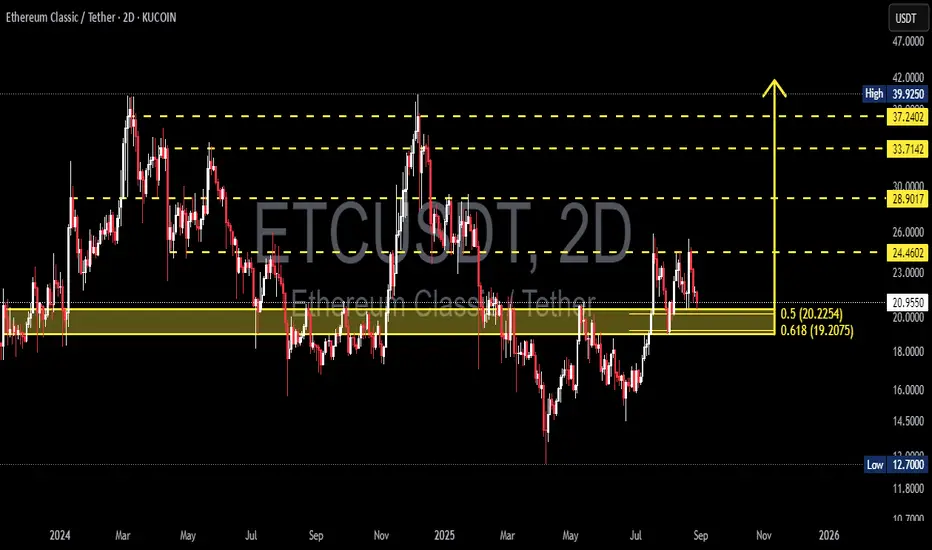
ETC/USDT — Testing Golden Pocket: Rebound or Breakdown?Ethereum Classic (ETC) is currently at a critical decision zone after being rejected around the 24.46 USDT resistance. The price has now pulled back into the Fibonacci golden pocket (0.5–0.618) at 20.22–19.20 USDT, a key support zone that previously acted as a major flip level (resistance → support).
This area carries heavy significance as it has served as a battleground for liquidity multiple times. The reaction here will likely determine whether ETC continues its mid-term bullish structure or slips back into a deeper bearish trend.
---
🔎 Market Structure & Pattern
Mid-term structure: ETC is trading within a wide range between the historical support of 12.70 and the upper resistance near 39.93.
Short-term focus: The 19.20–20.22 golden pocket is the decision point for the next move.
Bullish bias holds as long as this level remains intact.
Bearish risk emerges if the golden pocket fails, triggering a deeper breakdown.
---
🚀 Bullish Scenario
1. Strong rejection at the golden pocket with bullish reversal candles (engulfing / pin bar) → buyer confirmation.
2. Short-term target: 24.46 (nearest resistance).
3. Break and close above 24.46 on the 2D timeframe opens upside targets at 28.90 → 33.71 → 37.24 → 39.93.
4. Supporting signals: RSI holding above 50 + volume expansion on breakout.
---
⚠️ Bearish Scenario
1. Breakdown confirmed if the 2D candle closes below 19.20 → support failure.
2. Downside targets: 16.00 → 14.50 → 12.70 (historical low).
3. A weak bounce forming only a lower high below 24.46 would strengthen bearish continuation.
4. Confirmation: high volume on breakdown + strong bearish candles without lower wicks.
---
📝 Trader’s Notes
The golden pocket zone (19.20–20.22) is the decision point for the next macro move.
Aggressive traders may consider longs here with tight stops below 18.00.
Conservative traders should wait for a confirmed breakout above 24.46 before entering.
Risk management is crucial: aim for at least 1:2 risk-to-reward ratio.
---
📌 Key Levels
Support: 19.20–20.22
Nearest resistance: 24.46
Bullish targets: 28.90 → 33.71 → 37.24 → 39.93
Bearish targets: 16.00 → 14.50 → 12.70
#ETCUSD #EthereumClassic #ETC #CryptoAnalysis #Altcoin #TechnicalAnalysis #SupportResistance #Fibonacci #PriceAction #SwingTrade