BIO : BUY MARKET!!!Hello friends🙌
✅Given the good upward wave we had, the price has now corrected, providing a good opportunity to buy in steps in the specified areas with risk and capital management and move towards the specified goals.
🔥Follow us for more signals🔥
*Trade safely with us*
ETF

XRP : Will Ripple be pumped?Hello friends🙌
✅ considering the decline we had and the entire market, Ripple has also fallen like other currencies.
✅You can see that the price has hit resistance several times but failed to break it. Finally, in the last hit, which we also identified on the chart, the powerful price broke through the resistance.
✅Now, in the support area we identified on the chart, you can see that the price is supported by buyers and higher lows have been recorded.
✅Now that the price has pulled back and buyers have provided good support, you can buy in steps with risk and capital management and move with it to the specified goals.
🔥Follow us for more signals🔥
*Trade safely with us*

ETH: LIVE TRADEHello friends🙌
✅Given the good rise we had, we had a small correction that was a buying opportunity and there is another support area where we can buy the second step in case of further correction.
We have also specified targets for you, be careful and do not act emotionally and observe capital and risk management.
🔥Follow us for more signals🔥
*Trade safely with us*

Bitcoin Uptrend Intact, Pullback First? 120.0k–119.8k is Key!__________________________________________________________________________________
Market Overview
__________________________________________________________________________________
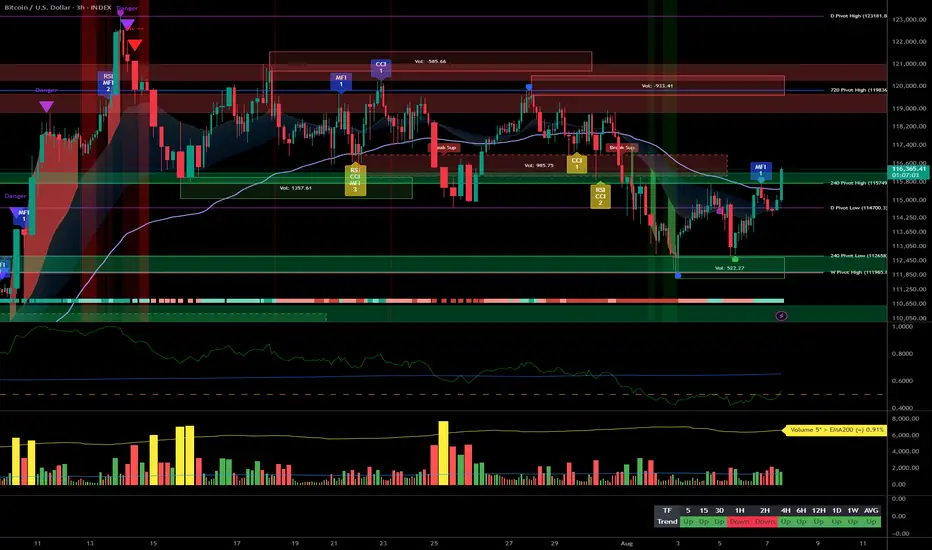
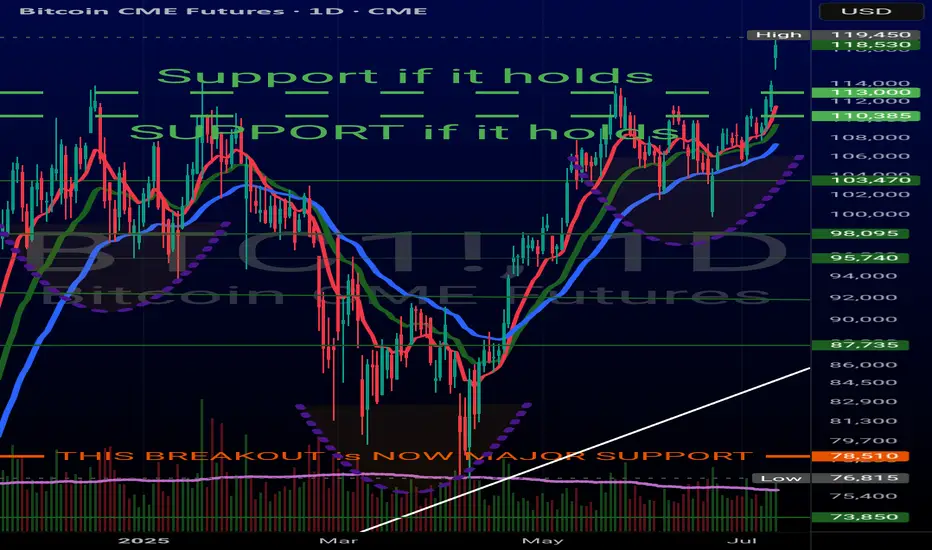
BTC is hovering near 120.6k after a clean reclaim above the 119.8k pivot, now pressing into the 121k–122.3k daily supply cluster. Trend is bullish, but we’re trading into resistance.
Momentum: 📈 Bullish, multi-timeframe HH/HL, yet approaching a dense 121k–122.3k supply.
Key levels:
- Resistances (4H/1D) : 121,000–121,500 • 122,318 (D) • 123,235 (240)
- Supports (1H/4H/1D) : 119,800 (720 pivot) • 118,500 (240) • 115,860 (240)
Volumes: Normal across most TFs; prior spikes accompanied the 119.8k breakout.
Multi-timeframe signals: 1D/12H/6H trending up toward 122.3k; 4H/2H high-base consolidation; 30m/15m locally overbought under 121k, favoring pullbacks to 120.0k–119.8k.
Risk On / Risk Off Indicator: Neutral Buy backdrop, but tilting Neutral Sell → Sell on the very short-term, slightly contradicting the bullish push into resistance.
__________________________________________________________________________________
Trading Playbook
__________________________________________________________________________________
Strategic stance: uptrend intact—prefer buy-the-dip over chasing breakouts until we get a daily close above 122,318 with volume.
Global bias: Buy bias (Neutral Buy) while 119.8k holds; key invalidation on a close below 119.8k.
Opportunities:
- Buy the dip at 120.0k–119.8k targeting 121.5k then 122.3k/123.2k.
- Bullish breakout on H4/D close > 122,318 toward 123,235 (let it run if flows expand).
- Tactical fade 120.9k–121.1k back to 120.0k if Risk On/Off stays in Sell on LTFs.
Risk zones / invalidations: Strong rejection at 122.3k plus a close < 119.8k = bull trap risk and range-back toward 118.5k; loss of 118.5k could open 115.9k.
Macro catalysts (Twitter, Perplexity, news):
- Spot ETF inflows remain positive and above new supply → supports dip-buying.
- China liquidity mixed, Euro CPI contained, no major macro shocks → technical breakout must be confirmed by volume.
- Rotation to ETH/Alts + slowing derivatives momentum → near-term cap risk on breakouts.
Action plan:
- Plan A (buy-the-dip): Entry 120.0k–119.8k / Stop < 119.6k / TP1 121.5k, TP2 122,318, TP3 123,235 • R/R ~2–3.
- Plan B (breakout): Entry on retest 122.35k–122.5k after H4/D close > 122,318 / Stop ~122.0k / TP1 123,235, TP2 let it run • R/R ~1.5–2.
__________________________________________________________________________________
Multi-Timeframe Insights
__________________________________________________________________________________
HTFs remain bullish while LTFs are stretched into resistance.
1D/12H/6H: HH/HL above 119.8k; H4/D close > 122,318 unlocks 123,235; look for volume expansion to validate extension.
4H/2H: High-base consolidation under 121k–122k; better R/R on pullbacks to 120.0k–119.8k than chasing an immediate break.
30m/15m: Local overbought and Risk On/Off in Sell; higher odds of a pullback toward 120.0k/119.8k before any attempt above 122k.
__________________________________________________________________________________
Macro & On-Chain Drivers
__________________________________________________________________________________
Macro is calm-to-supportive; ETF flows backstop BTC, but rotation to alts and slower derivatives momentum argue for caution on breakouts.
Macro events: China credit/liquidity mixed; Spain CPI contained (ECB pressure tempered); US deficit keeps the debasement/hedge narrative alive.
Bitcoin analysis: Spot ETF inflows (+$65.9M) with IBIT buys > mined supply support demand; BTC dominance slipping (rotation to ETH/Alts) can cap near-term outperformance; futures momentum has cooled.
On-chain data: Risk-on but not euphoric; compressed IV and high alts OI increase sensitivity to surprises; STH resistance near ~127k as an upper on-chain area.
Expected impact: Constructive for dip-buys; demand confirmation (volume/flows) needed to validate a daily break above 122.3k.
__________________________________________________________________________________
Key Takeaways
__________________________________________________________________________________
An uptrend is probing a 121k–122.3k daily supply cluster with normal volumes and a mixed short-term Risk On/Off read.
- Trend: bullish 📈 while 119.8k holds.
- Top setup: buy-the-dip 120.0k–119.8k; only confirm continuation on a close above 122,318.
- Macro: ETF inflows positive, macro calm; rotation into alts may cap BTC near-term.
Stay patient: favor pullbacks and wait for an H4/D close with volume to “pay” the break above 122.3k. 👀

BTC 1H Analysis – Key Triggers Ahead | Day 9💀 Hey , how's it going ? Come over here — Satoshi got something for you !
⏰ We’re analyzing BTC on the 1-hour timeframe after today’s CPI release .
👀 Following the CPI news, Bitcoin broke through key areas — including the descending channel and the $117,000 resistance — and moved higher. It then faced rejection from the previous high, pulling back to around $118,000, which aligns with a multi-timeframe 4H SMA25 bounce. After that, it broke the $119,000 level and is now heading toward its key resistance at $120,000.
🎮 Fibonacci drawn from the current high to the price jump zone shows our current key level at 0.61, which is a relatively strong resistance. Breaking above this Fibonacci level could send BTC toward its current high and potentially lead to a new ATH.
⚙️ On the RSI oscillator, the key level is 70. Entering the overbought zone could push BTC toward its current high.
👑 The 99 MA is forming a strong base below the 0.37 level, while the 25 MA is working to break resistance and push price upward. On the 4H multi-timeframe view, the 0.23 area acts as a rebound zone after touching the 25 MA.
🕯 Volume and trade count are increasing, with solid consolidation above zones where whales have been buying and accumulating. Following today’s CPI results, fresh capital has flowed into risk assets like Bitcoin. This could be highly attractive for other coins, especially BTC pairs that are bullish in these conditions.
🔔 You can set an alert at the $120,000 area to watch price action when it reaches this level. If it matches your setup confirmations, you can open a position. Personally, I have a profitable long position on Ethereum, which is considered a BTC pair.
📊 On the 1H timeframe for USDT.D, we can see that after reacting to 4.20%, it faced a drop, and with a break below 4.10%, BTC could set a new high.
🖥 Summary: Bitcoin is moving toward its $120,000 resistance, where we could consider opening positions. The most important factor will be holding and confirming above this level.
❤️ Disclaimer : This analysis is purely based on my personal opinion and I only trade if the stated triggers are activated .

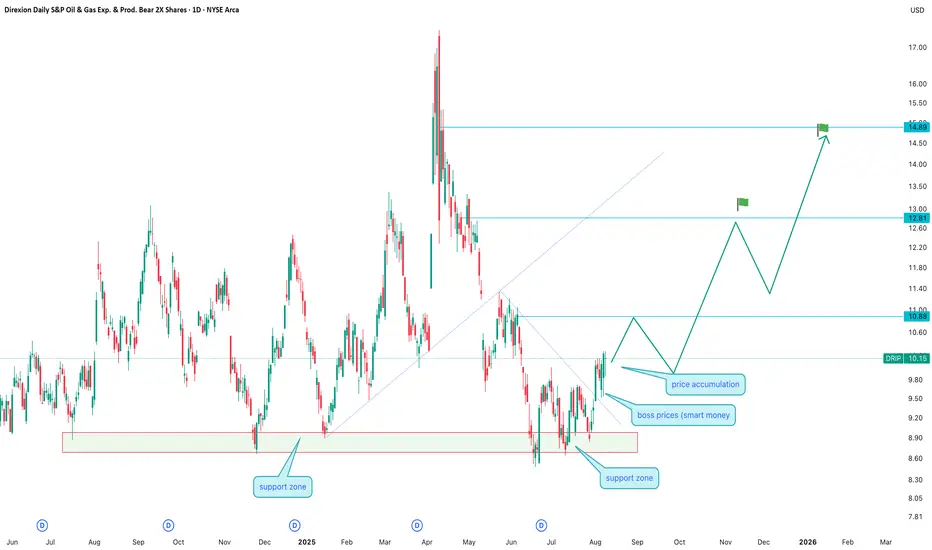
DRIP: the bear in an oilskin ready to huntDRIP: the bear in an oilskin ready to hunt
Technical analysis:
DRIP has built a solid support zone between 8.60–9.00, showing volume accumulation and smart money activity. After a recent bounce, the price broke above the 10.00 level and is holding above 10.15. The next resistance is at 10.88, followed by 12.81 and the strategic target of 14.89.
EMA and MA have turned upward, confirming a short-term trend change. MACD is moving toward the positive zone, while RSI remains neutral with room to rise.
Tactical plan: consider buying on a pullback to 10.00-10.15 with targets at 10.88, 12.81, and 14.89. Stop loss below 9.80.
Fundamental overview:
DRIP is an inverse ETF on the oil & gas sector, delivering 2x returns opposite to the market trend. Growing interest is linked to expectations of oil price declines amid potential commodity market correction, geopolitical instability, and seasonal demand slowdown. Another factor is possible OPEC+ announcements on production cuts, which could boost volatility.
Conclusion:
If oil prices stumble over geopolitical hurdles, DRIP might stage a rally where the only bored ones will be those left without a position.
BTC Support Tested, Mixed Cross-TF Signals, Tactical Caution__________________________________________________________________________________
Technical Overview – Summary Points
__________________________________________________________________________________
Momentum & context: Bullish bias confirmed on higher timeframes (1D/4H), but bearish divergences appearing from 2H downward.
Major support/resistance: 114,600–115,000 and 114,667 hold as the critical zone. Key resistance: 116,900–117,000 must break for a bullish trigger.
Volume: Normal on HTF. Very high volumes detected on 30min/15min during the 116,000+ resistance test (climax/reversal risk).
Multi-timeframe behavior: Risk On / Risk Off Indicator = “Strong Buy” from 1D to 1H, short-term sellers active below 2H (ISPD = Sell on 15min).
__________________________________________________________________________________
Strategic Summary
__________________________________________________________________________________
Overall bias: Bullish structure preserved, but fragility evident on intraday.
Opportunities: Tactical buys possible on 114,600–115,000 (stop <114,000) or strong breakout above 116,900.
Risk: Clear break below 114,000 = risk of drop to 110,000. Volume climax/ISPD Sell below resistance = profit taking advised.
Macro catalysts: Ongoing geopolitical news (US/Russia/China), volatility during US announcements; post-Fed digestion.
Action plan: Strict monitoring of ETF flows/funding/US news. Cautious accumulation on daily/4H, short-term shorts only if confirmed by lower timeframe signals.
__________________________________________________________________________________
Multi-Timeframe Analysis
__________________________________________________________________________________
1D: Strong upward bias, price at major support, calm volume.
12H/6H/4H: Robust sectorial momentum (Risk On / Risk Off Indicator “Strong Buy”), daily/4H supports holding, initial bearish signs on 2H/1H.
2H/1H: Growing fragility: “Down” trend confirmed on 2H, momentum loss, buyer exhaustion visible.
30min/15min: Very high volumes under resistance, ISPD Sell 15min: short-term correction alert. Overbought microstructure, trigger risk if rejection at 116,000–116,250.
Cross-TF summary: Market mostly “Up”, but tactical vigilance around supports, increased caution above 116,000.
Summary:
- Bullish structure maintained on daily/4H, but top/reversal warning signals on brief lowest TFs (15/30min).
- 114,600–115,000 pivot zone is decisive: holding = increased stabilization/accumulation probability; break = risk of extension down to 110,000.
- Active monitoring of ETF flows/funding/news is essential.
__________________________________________________________________________________
Macro & Bitcoin Analysis (Twitter Summary)
__________________________________________________________________________________
Geopolitical risks remain high, US/China protectionism & Fed on hold: crypto market in wait-and-see mode.
BTC broke 116k, entered low-liquidity zone; rebound remains “fragile.”
ETF flows: moderate return to buying, funding neutral.
Possible post-pullback accumulation signal, but needs confirmation.
Strategy: swing buy on defended/major supports, strict management if short-term seller signals (volume/ISPD).
__________________________________________________________________________________
Action Steps
__________________________________________________________________________________
Buy on 114,600–115,000 zone if confirmed by daily/4H, stop loss <114,000.
Re-buy or more aggressive swing on clear breakout above 116,900–117,000.
Take profits/short if clear rejection 116,000+ with volume climax/ISPD Sell.
Monitor macro (US events), ETF flows, funding rate, volume behavior.
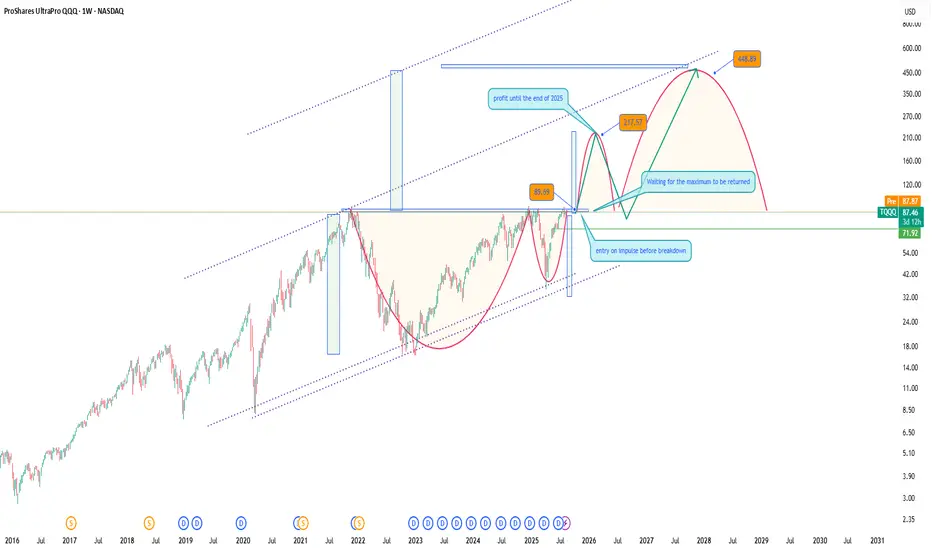
ProShares UltraPro QQQ (TQQQ) LONGThe Technology Sector Continues to Break Records
The tech sector keeps setting new highs, and alongside individual stocks, it's a great idea to consider investing in an ETF that mirrors the profits of the NASDAQ 100 index. One of the most attractive options is TQQQ - it’s more affordable than the index itself, yet offers similar growth potential aligned with the entire tech sector.
I expect continued growth through the end of the year, assuming the geopolitical landscape remains relatively stable.
From a technical standpoint, those looking to minimize risk might prefer to wait for a retest of previous highs. However, my approach is to gradually build a position both before the breakout and after the retest of the highs.
A classic technical analysis pattern -the cup formation, also supports the bullish case for entry. As George Soros wrote in his book: “What moves the market : our expectations or the events themselves?” I’d say it’s both. The key is not to miss the wave.
P.S. Don’t forget: with TQQQ, you also receive dividends - a nice bonus while riding the trend.
S&P 500 ETF & Index– Technicals Hint at a Possible Correction📉📊 S&P 500 ETF & Index at Resistance – Technicals Hint at a Possible Correction 🔍⚠️
Everything here is pure technicals— but sometimes, the market whispers loud and clear if you know how to listen. 🧠📐
The VOO ETF, which tracks the S&P 500 , has now reached the upper boundary of a long-term ascending channel, once again brushing against resistance near 590.85. This zone has consistently led to major pullbacks in the past.
On the right panel, the US500 Index mirrors this move—pushing toward all-time highs, right as broader sentiment turns euphoric. Technically, both charts are overextended and pressing into key zones.
👀 Potential Path:
🔻 Rejection from current zone ➝ Down toward 526.17, then 465.72 (green support channel)
🔁 Possible bounce after correction — trend still intact long term
And while we’re keeping it technical, it’s worth noting that the Buffett Indicator (Stocks-to-GDP) i s currently screaming “overvaluation.” This doesn't predict timing—but it adds macro context to an already overheated chart setup.
The lesson? Price respects structure. Whether or not the fundamentals are in agreement, the charts are warning that now may not be the time to chase.
History doesn’t repeat, but it often rhymes. Stay sharp, stay technical. 🎯
One Love,
The FX PROFESSOR 💙
ps. the beauty of these levels? Tight Stop loss- excellent R/R
Disclosure: I am happy to be part of the Trade Nation's Influencer program and receive a monthly fee for using their TradingView charts in my analysis. Awesome broker, where the trader really comes first! 🌟🤝📈

Bitcoin - Will Bitcoin reach its previous ATH?!Bitcoin is below the EMA50 and EMA200 on the four-hour timeframe and is in its short-term descending channel. In case of an upward correction, Bitcoin can be sold from the specified supply zone, which is also at the intersection of the ceiling of the descending channel.
It should be noted that there is a possibility of heavy fluctuations and shadows due to the movement of whales in the market and compliance with capital management in the cryptocurrency market will be more important. If the downward trend continues, we can buy in the demand range.
In recent days, Bitcoin has stabilized below the $120,000 mark, a development that reflects increasing structural maturity in the market and strong institutional capital inflows. Unlike in previous cycles, where price rallies were largely driven by retail hype, the current liquidity flows are channeled through regulated and professional instruments like ETFs. During the month of July alone, Bitcoin ETFs attracted over $6 billion in inflows, marking the third-highest monthly inflow in their history. Leading this trend were BlackRock’s IBIT and Fidelity’s FBTC, which together recorded more than $1.2 billion in net inflows within a single week. This signals a shift in trust from traditional investors toward crypto markets—within transparent, traceable, and regulated frameworks.
On-chain metrics further validate this shift. The MVRV ratio, which compares market value to realized value, is currently fluctuating between 2.2 and 2.34. These levels do not indicate profit-taking extremes nor fear of major corrections, but instead point to a healthy and rationally profitable market. Meanwhile, the supply of Bitcoin held in non-exchange wallets is rising, while exchange-held balances have dropped to their lowest levels in a decade, now accounting for just 1.25% of total supply. This trend implies reduced short-term selling pressure, as coins transition from liquid to long-term holdings.
Trader behavior is also evolving. Unlike previous bull runs, profit-taking remains controlled. The SOPR index, which measures realized profit relative to purchase price, has not yet reached saturation levels. This suggests that current holders are not satisfied with existing gains and are anticipating higher price levels. Furthermore, metrics like daily active addresses remain stable, indicating a lack of speculative retail influx. The network’s current dynamics resemble those of mature traditional markets, where investment decisions are guided by analysis, discipline, and long-term perspective.
Analysts at major financial institutions believe that if this trend continues, Bitcoin could reach targets of $180,000 to $200,000 by year-end. A more conservative scenario places the $95,000 to $100,000 range as a strong support zone—especially if political, regulatory, or macroeconomic pressures intensify. Overall, the convergence of institutional capital, rational trader behavior, stable on-chain conditions, and regulatory clarity has transformed Bitcoin into a more structured and dependable asset than ever before.
Ultimately, Bitcoin is no longer just a speculative tool. It has secured its role as a legitimate asset within the portfolios of global financial institutions. Even if the pace of capital inflow is slower than in previous cycles, the underlying structure is more robust and sustainable—offering a clearer path toward broader global adoption and higher valuation.
Nonetheless, recent data from CryptoQuant suggests that long-term Bitcoin holders (LTHs) have begun net selling near the $120,000 resistance zone—a psychologically significant level in Bitcoin’s price history. Analysts interpret this as a potential sign that veteran investors—those who entered during earlier market cycles—are now realizing profits as prices reach historic highs. If short-term holders follow suit, this shift could amplify selling pressure and trigger heightened price volatility.

S&P 500 ETF & Index Hit Resistance – A Technical Warning Shot 📉⚠️ S&P 500 ETF & Index Hit Resistance – A Technical Warning Shot 🔍🧠
Following up on the video I just posted , I had to share this updated chart of the VOO ETF (Vanguard S&P 500) and US500 Index , now that both are testing key resistance levels.
On the left: AMEX:VOO has reached the very top of a multi-year ascending channel—a zone that has historically triggered sharp corrections. The level at 590.85 marks a major resistance zone.
On the right: The US500 Index is showing a similar technical overextension, trading just under 6,450, with 5,928.25 as the nearest support below.
🎯 Technicals at play:
VOO could retrace toward 526.17 and potentially 465.72, both of which are solid technical supports within this channel.
This setup doesn't mean panic—but it does argue for caution, especially after such an extended run.
🧠 And yes, the Buffett Indicator (Stocks-to-GDP) continues to point toward an overheated market . While it's not a timing tool, it adds macro weight to the technical signals.
In the video, I also touched on:
Taking profits on NASDAQ:NVDA after a near-perfect technical rejection at target.
Reviewing Rolls Royce nearing upper channel resistance.
Gold and Silver at inflection points—likely to be impacted if equities begin to unwind.
Rotational potential into Bitcoin and Ethereum, which may benefit from macro shifts.
This is how I trade: respect structure, stay proactive, and prepare before the move—not after. Let me know how you’re positioning or if you’re sitting on hands waiting for a dip.
One Love,
The FX PROFESSOR 💙
Disclosure: I am happy to be part of the Trade Nation's Influencer program and receive a monthly fee for using their TradingView charts in my analysis. Awesome broker, where the trader really comes first! 🌟🤝📈

ETH - BTC ETF News: What It Means for the Market+ China Rumors 🚨 ETH - BTC ETF News: What It Means for the Market + China Rumors 💥🌐
July just ended with a crypto bombshell 💣 — and the market is barely reacting.
Let’s break it down:
🧠 One part hard news.
🌀 One part geopolitical smoke.
🎯 All parts worth watching if you care about macro market shifts.
🏛️ SEC Approves Real BTC & ETH for ETF Flows (July 29)
Say goodbye to the cash-only ETF model.
The SEC now allows direct in-kind creation/redemption of Bitcoin and Ethereum in ETFs.
That means providers like BlackRock, Fidelity, VanEck can now use actual BTC/ETH, not just synthetic tracking.
✅ Bullish Impact:
💰 Real Spot Demand: ETF inflows = real crypto buying
🔄 Efficient Arbitrage: No middle step via cash = faster flows
🧱 TradFi + Crypto Merge: ETFs now settle with crypto — not just track it
🎯 Better Price Accuracy: Spot ETFs reflect true market value more cleanly
📉 The market reaction? Mild.
But don’t get it twisted — this is a structural reset, not a meme pump.
⚠️ But There’s a Bearish Angle:
🏦 Centralized Custody: Crypto now lives in Coinbase, Fireblocks vaults
⚠️ Network Risks: ETF performance now tied to ETH/BTC uptime
🧑⚖️ Regulatory Overreach: More hooks into validator networks, MEV relays
🌊 Volatility Risk: Panic redemptions = real BTC/ETH sold into open markets
Still, this is good news for Ethereum in particular.
Why? Because ETH isn’t just money — it’s infrastructure.
And now Wall Street is finally using it, not just watching it.
🇨🇳 And Then There’s China… Rumor or Tumor?
Crypto Twitter is swirling with unconfirmed whispers from July 29 that China may be prepping a major Bitcoin statement ahead of the BRICS summit.
But let’s be clear:
🚨 It’s a rumor. Or a tumor. 🧠
And like many tumors in crypto — there’s a 40% chance it brings bad news. 🤕
Still, here’s what’s being floated:
🧠 Speculations Include:
🔓 BTC re-legalization in “special finance zones” (HK-style)
🏦 BTC in national reserves (!)
🤖 CBDC integration or smart contract interoperability
⚒️ Return of official state-backed Bitcoin mining
🧯 But no official sources. Just geopolitics + timing.
China’s FUD/FOMO pattern is Bitcoin tradition — don’t get trapped by hopium.
But if even half of it is true... buckle up.
📈 Ethereum Leads the Charge — But Watch These Alts:
If ETFs go fully crypto-native, some sectors light up 🔥
🔹 1. Ethereum Layer 2s (ARB, OP, BASE)
→ ETF gas pressure = L2 scaling demand
🔹 2. DeFi Protocols (UNI, AAVE, LDO)
→ TradFi liquidity meets on-chain utility
🔹 3. ETH Staking Derivatives (LDO, RPL)
→ Institutions want yield = LSD narrative grows
🔹 4. Oracles (LINK)
→ ETFs need trusted on-chain data = Chainlink shines
🔹 5. BTC on ETH Bridges (ThorChain, tBTC)
→ If BTC flows into ETH-based ETFs, bridges light up
🚫 What I will Avoid:
❌ Memecoins – zero relevance to ETF flows
❌ GameFi – not part of TradFi’s roadmap
❌ Ghost Layer 1s – no users, no narrative, no pump
🧠 My Take:
ETH is building momentum toward $4,092 — the third breakout attempt on your 1-2-3 model.
🔥 The fuse is lit. Target? $6,036
Timing? Unknown. But structure is in place.
Meanwhile, Bitcoin Dominance is rising.
ETH is shining.
Solana — while powerful — continues paying the price for memecoin madness 💀
We’re entering a new phase — where ETFs settle with real crypto , China watches the stage, and macro money is warming up behind the curtain.
So stack smart.
Study the flows.
Don’t let silence fool you — the biggest moves come after the news fades.
One Love,
The FX PROFESSOR 💙
Disclosure: I am happy to be part of the Trade Nation's Influencer program and receive a monthly fee for using their TradingView charts in my analysis. Awesome broker, where the trader really comes first! 🌟🤝📈

CRO (Crypto.com) $3 Target! Don't Miss This Move🪙 Ticker: OKX:CROUSDT
🕰 Chart: 1D (Heikin Ashi)
🔧 Tools Used: Fibonacci Extension, Fundamental News (ETF Filing)
🔍 Chart Analysis: Fibonacci Extension Targeting $3+
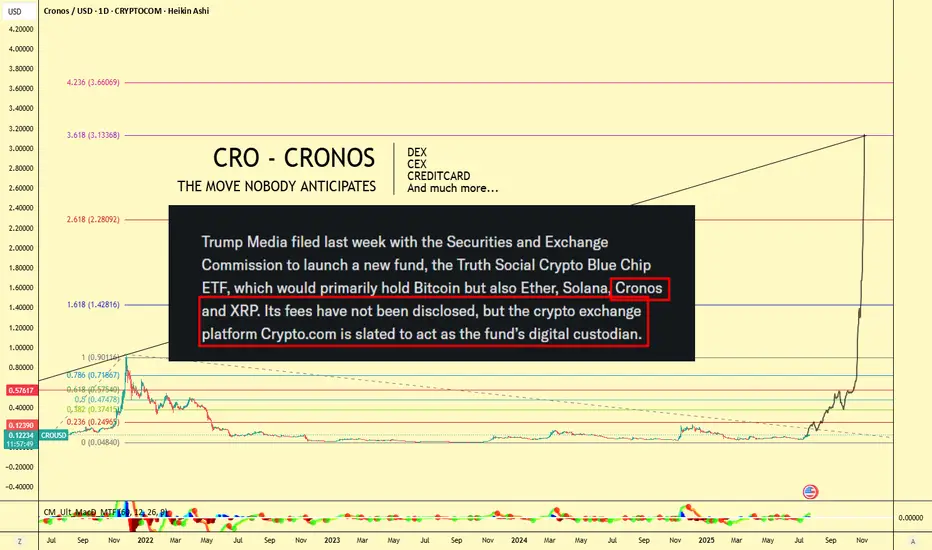
The Fibonacci Extension tool has been applied to the major CRO impulse wave from its peak near $0.90 (late 2021) to the 2022–2023 bottom at $0.0484, confirming a multi-year retracement and consolidation period.
Let’s break down the major Fib levels:
Extension Level Price Target
0.236 $0.2495
0.382 $0.3741
0.618 $0.5745
1.0 $0.9011
1.618 $1.4281
2.618 $2.2809
3.618 $3.1336
📌 Current Price: ~$0.12
🔥 Upside Potential to $3.13+ — a 25x move from current levels if full extension plays out!
📣 Fundamental Catalyst: CRO in Trump Media ETF
According to the chart note (sourced from SEC-related headlines):
"Trump Media filed with the SEC to launch a new ETF, the Truth Social Crypto Blue Chip ETF, which would primarily hold Bitcoin, but also Ether, Solana, Cronos (CRO), and XRP."
Even more important:
"Crypto.com is slated to act as the fund’s digital custodian."
This is massive fundamental validation for CRO — not just as a token, but as an ecosystem and financial infrastructure provider.
🌐 Why Crypto.com Matters: Utility, Ecosystem, Adoption
Crypto.com isn't just an exchange — it's a comprehensive Web3 ecosystem, which includes:
🔁 CEX (Centralized Exchange):
Buy, sell, stake, and trade hundreds of cryptocurrencies with high liquidity and low fees.
🔄 DEX (Decentralized Exchange):
Cronos Chain supports decentralized trading and DeFi apps — with low gas fees and EVM compatibility.
💳 Visa Credit Card Integration:
Crypto.com offers one of the most popular crypto Visa debit cards — earn cashback in CRO and enjoy perks like Spotify/Netflix rebates.
📱 Mobile Super App:
Buy/sell/stake/farm on-the-go with a seamless user interface.
📈 Earn & Lending Services:
Stake CRO or other assets for up to double-digit yields.
🤝 Strategic Partnerships
Crypto.com has been aggressively investing in brand and adoption:
🏟 Official partner of UFC, FIFA World Cup, and Formula 1
🏀 NBA’s Los Angeles Lakers Arena naming rights (Crypto.com Arena)
💼 Member of Singapore's regulated exchanges
🔐 ISO/IEC 27701:2019, PCI:DSS 3.2.1, and SOC 2 compliance — one of the most secure platforms in the industry
🧠 Conclusion: The Perfect Blend of TA + FA
With CRO being included in a potential U.S.-regulated ETF, the Crypto.com ecosystem booming, and technical patterns pointing to a Fib-based target above $3, CRO might be the sleeper play of the next bull run.
"The move nobody anticipates" might just be the most explosive one.
🎯 Short-Term Targets:
$0.25
$0.37
$0.57
🎯 Mid-Term Bull Targets:
$0.90 (prior ATH)
$1.42
$2.28
🎯 Full Cycle Extension:
$3.13
📢 Let me know in the comments:
Are you holding GETTEX:CRO ? What do you think about its inclusion in the ETF?
#CRO #CryptoCom #ETF #TrumpMedia #Altcoins #Bullrun #CryptoTrading #DeFi #FibTargets #CronosChain
ARKK: when a breakout isn’t just a breakout-it’s a runway to $91On the weekly chart, ARKK has broken out of a long-standing ascending channel, ending a year-long consolidation phase. The breakout above $71.40, with a confident close and rising volume, signals a transition from accumulation to expansion. The move came right after a golden cross (MA50 crossing MA200), further confirming institutional interest. Price has already cleared the 0.5 and 0.618 Fibonacci retracements — and the 1.618 extension points to $91.40 as the next technical target.
Momentum indicators like MACD and stochastic remain bullish with room to run. Volume profile shows low supply above $75, which could fuel an acceleration toward the target zone.
Fundamentally, ARKK remains a high-beta, high-risk vehicle — but one with focus. The ETF is positioned around next-gen tech: AI, robotics, biotech, and automation. Assets under management now exceed $9.3B with +$1.1B net inflow in 2025. YTD return stands at 37%, and its top holdings (TSLA, NVDA, COIN) are back in favor. This isn’t just a bet on innovation — it’s diversified exposure to a full-blown tech rally.
Tactical setup:
— Entry: market $69.50 or on retest
— Target: $80.21 (1.272), $91.40 (1.618 Fibo)
Sometimes a breakout is just technical. But when there’s volume, a golden cross, and billions backing it — it’s a signal to buckle up.

LITCOIN BUY OR SELL !!!Hello friends🙌
🔊According to the price drop, you can see that the price has been below the specified resistance for a while and when it was able to break the resistance, it shows us the power of the buyers. Now, when we return to the previous resistance, which has now become a support, you can see that the buyers are providing good support and the price is expected to move to the specified targets.
Note that the most important rule in trading is capital and risk management So make sure to follow it.
🔥Follow us for more signals🔥
*Trade safely with us*

XRP : ETF...Hello dears
Considering the good growth we had, you can see that the price is stuck in a long-term range and has not managed to break it yet...
We must be prepared for any scenario, so the best thing to do is to buy stepwise, of course with capital and risk management.
Note that this analysis is on a daily time frame and may take a while, so if you are not patient, do not enter.
*Trade safely with us*

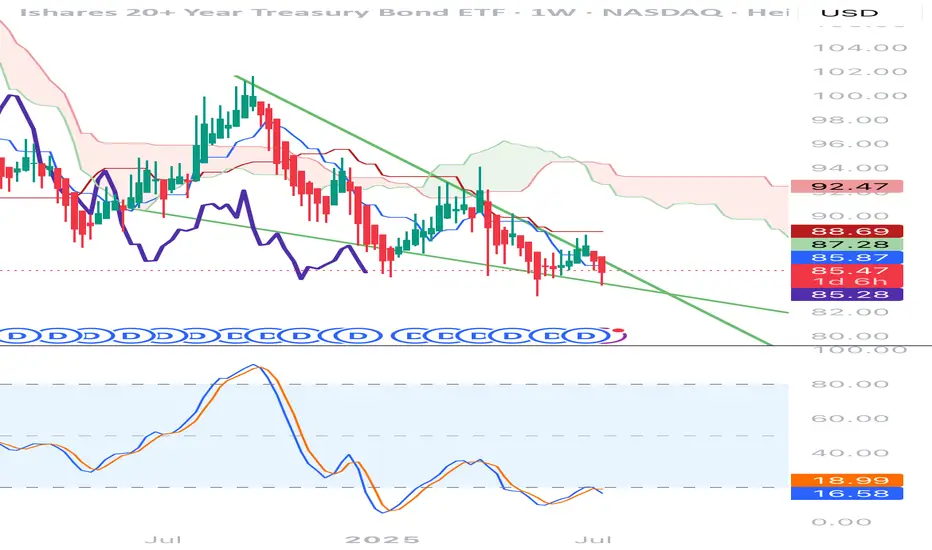
Do we continue the wedge…Bonds have been hit hard and Crypto at Ath trend lines, do we need to finish the wedge
SOXL — Buying on a Strong Uptrend with 30%+ Profit PotentialDirexion Daily Semiconductor Bull 3x Shares (SOXL) continues to move in a clear uptrend after breaking long-term resistance. Price is consolidating above the breakout level, indicating sustained interest from major market participants.
Long positions remain valid.
Profit targets:
First target — 39.85
Second target — 60.42
The setup offers over 30 percent profit potential. The semiconductor sector continues to lead the broader market higher.
Focus on trading with the trend. Adding on pullbacks is reasonable with proper risk management in place.

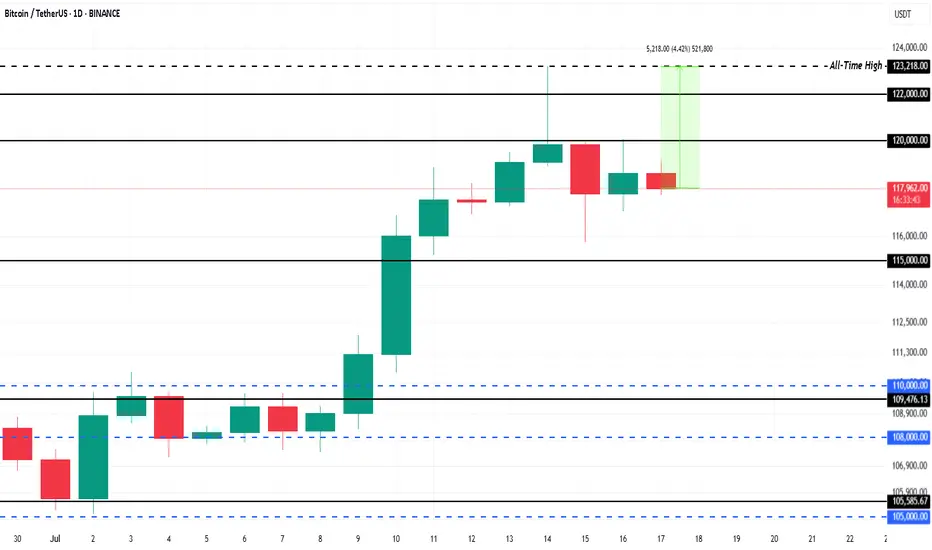
$1.5 Billion ETF Inflows Could Push Bitcoin Price 4% to New ATHBINANCE:BTCUSDT is currently trading at $118,325, facing resistance at the $120,000 level. This resistance is crucial for Bitcoin if it wants to break back to its ATH of $123,218 . The 4.4% gap to reach the ATH indicates potential for growth, but Bitcoin needs to secure support above $120,000 for this to happen.
This week, spot BINANCE:BTCUSDT exchange-traded funds (ETFs) saw over $1.5 billion in inflows , a significant portion of which occurred in the last 48 hours during Bitcoin’s dip.
The influx of institutional money highlights that investors are confident in Bitcoin’s potential despite the market cooling. If this trend persists, it could propel BINANCE:BTCUSDT price upward, as institutional support provides stability.
If BINANCE:BTCUSDT can hold above $120,000 and push past $122,000, it could continue its ascent toward new all-time highs. The current market conditions and ETF inflows support a bullish outlook, with a significant chance of breaking the resistance.
However, the risk of profit-taking remains , which could lead to a price drop. If BINANCE:BTCUSDT faces selling pressure, it could fall back to $115,000 , erasing a portion of recent gains. This would invalidate the bullish thesis, causing Bitcoin to retest lower support levels.
LITCOIN : So what is an ETF ?Hello friends
Be careful with the recent fluctuations of this coin because the movements of this coin have become unpredictable and we suggest that if you want to buy, buy in the specified support areas and in steps, of course with capital and risk management...
We have also specified targets for you.
*Trade safely with us*

Beautiful Bitcoin breakout, as called. PLEASE SEE PROFILE FOR MORE INFO!
What an absolutely gorgeous Inverse Head & Shoulder for #Bitcoin.
Had suspicion this time WAS different for #BTC.
Let's talk ROUGH ESTIMATES for social #gold.
CRYPTOCAP:BTC is no longer a hard to anticipate as it's become an institutional asset. Follow the $, volume. ETF's are performing similar. Leveraged funds, not so much
Anyway, enjoy the ride #Crypto!
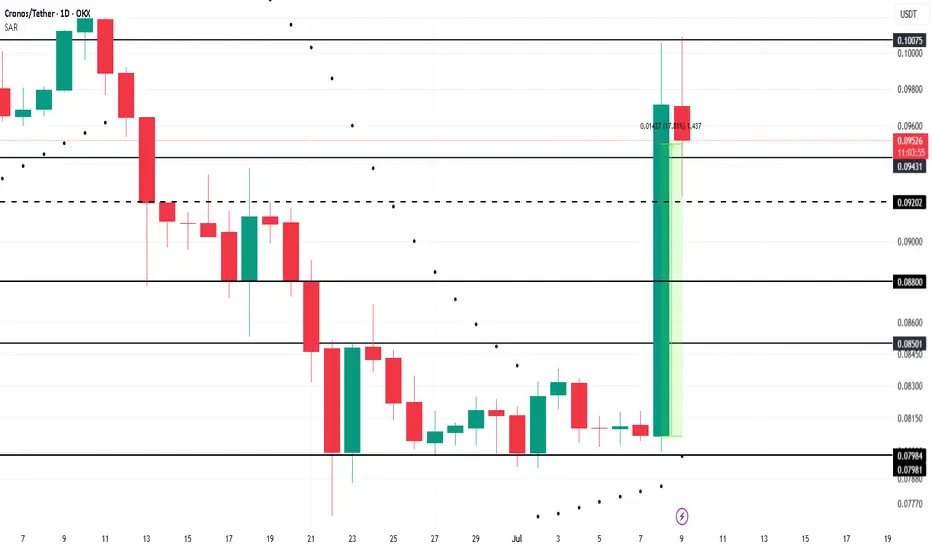
Cronos Rallies 18% After Truth Social Files for Blue-Chip ETFOKX:CROUSDT is a leading candidate for a Binance listing this month, following the proposed Crypto Blue-Chip ETF filed by Truth Social with the SEC. The fund includes 70% Bitcoin, 15% Ethereum, 8% Solana, 5% Cronos, and 2% XRP , positioning Cronos as a key asset in the fund.
Of the tokens in the proposed fund, only Cronos (CRO) is not currently listed on Binance. If the SEC approves the Crypto Blue-Chip ETF, Binance could fast-track the listing of Cronos . This move would likely draw more liquidity and investor interest toward CRO, fueling its price growth.
OKX:CROUSDT price surged by 17.8% over the last 24 hours, signaling strong momentum. If the ETF listing is approved and Binance acts swiftly, CRO could break through key resistance levels, potentially surpassing $0.1007. This upward movement would benefit investors, continuing the positive trend for the altcoin.
Bitcoin - Will Bitcoin record a new ATH?!Bitcoin is above the EMA50 and EMA200 on the four-hour timeframe and is in its medium-term ascending channel. Maintaining the specified support area will lead to the continuation of Bitcoin’s upward path and recording a new ATH. If it is corrected, we can look for Bitcoin buying positions from the specified demand zones.
It should be noted that there is a possibility of heavy fluctuations and shadows due to the movement of whales in the market and compliance with capital management in the cryptocurrency market will be more important. If the downward trend continues, we can buy within the demand area.
In recent days, Bitcoin has been stabilizing in a price range of around $107,000, with the market simultaneously witnessing a combination of short-term volatility and massive accumulation by institutional investors. A close examination of Bitcoin’s fundamental parameters shows that the market has entered a different phase than in the past; one that is no longer driven solely by momentary excitement, and that structured capital flows and on-chain data have formed its main axis. At the forefront of this trend are Bitcoin spot investment funds (Bitcoin ETFs), which reached their highest level of capital inflows in June. Total net inflows of these funds reached more than $4.5 billion last month, and on some days even approached more than $1 billion. Funds such as BlackRock’s IBIT and Fidelity’s FBTC now have billions of dollars in assets under management, a clear sign of increasing institutional participation in the Bitcoin market. These institutional investors are accumulating Bitcoin not with a short-term view, but with a long-term view and through legal means, which has reduced selling pressure and increased market stability.
On the other hand, the data from Anchin clearly shows that the market is in a steady accumulation trend. The amount of old Bitcoins held for more than 8 years experienced a significant growth of 5% in the second quarter of 2025. This statistic shows that long-term investors are not only reluctant to sell, but are still accumulating their assets. Also, the MVRV ratio, which indicates the relative profit or loss of the market, has decreased from 2.29 to 2.20, indicating mild and controlled profit taking by some investors, rather than widespread selling pressure or general panic. This rational behavior is a sign of market maturity and investors’ intelligence in managing short-term profits.
On-chain activity data also shows a similar trend. The average daily active addresses have reached around 1.02 million, indicating a decrease in market inflammation while maintaining overall dynamism. Other indicators such as Liveliness and Whale Accumulation also confirm that the amount of old transaction traffic has decreased and whales are mainly accumulating, not supplying. This trend is very valuable, especially in a market that has been far from explosive growth. From a macro perspective, the Bitcoin market is clearly in a consolidation and accumulation phase, but this consolidation is based on much stronger foundations than in previous periods. Institutional capital inflows via ETFs have reached over $50 billion, providing a strong foundation for continued growth. Also, some very old wallets that have been inactive for nearly 14 years have recently woken up and moved around $2 billion worth of Bitcoin. Although this could be a sign of potential supply, the market has not yet seen a significant negative reaction to it in the current market conditions and the market remains cautious.
Analysts believe that Bitcoin is in the third phase of its bullish cycle after the halving, which could bring gains of more than 120%. Some forecasts suggest a price range of $200,000-250,000 by the end of this year; however, the realization of such levels is subject to stable macroeconomic data, ETF performance and the absence of severe geopolitical shocks.
Finally, it can be said that the Bitcoin market has now reached a maturity where even periods of consolidation tend to strengthen its fundamentals rather than weaken the market. High-powered institutional investors are entering, whales continue to accumulate instead of selling, and long-term investors also see a bright outlook for the coming months. In this phase, price levels of $125,000 to $140,000 are likely by the end of the summer if the current trend continues, while in the event of severe economic or political pressures, key support for Bitcoin will be in the $95,000 to $100,000 range. Overall, Bitcoin is moving slowly but steadily towards higher targets, with stronger support than at any time in its history.
