ETH New Update (4H)After being rejected from the higher levels and losing the trigger line, Ethereum now appears to have pulled back into the range zone and the trigger line.
It is expected that the price will be rejected once again from the red zone to the downside, and then turn bullish again from one of the two green zones and move upward.
This is our current outlook on Ethereum. The analysis will be updated accordingly.
Keep in mind that taking short positions in these zones is not low-risk either!
For risk management, please don't forget stop loss and capital management
Comment if you have any questions
Thank You
ETH-D

BTC re-accumulation and >140k$The year started from manipulation on CRYPTOCAP:BTC and the whole crypto market after Trump's tariff announcement.
Since the start of the summer season, we've already seen another manipulation between Trump and Elon Musk.
On BTC I see weekly FVG and good pinbar candle. I guess we have already entered to consolidaton and summer will also consolidation, but starting from august we will see the final uptrend with euphoria which can finish on October nearly 241.000$ on BTC, but let's see it later
I think this period will be light with base summer and $MOCHI because it's a memecoin which holds the bottom well , when in that time another altcoins are making another bottom

Important Support and Resistance Area: 2572.5-2783.5
Hello, traders.
Please "Follow" to get the latest information quickly.
Have a nice day today.
-------------------------------------
(MET1! 1D chart)
The current price range of 2572.5-2783.5 is an important support and resistance area.
If it falls in this section, it is likely to fall to the support section of 1693.5-1933.0.
If it rises,
1st: 3293.0-3448.0
2nd: 3902.0-4141.5
You need to respond depending on whether there is support near the 1st and 2nd above.
-
I think that in order to rise above 2783.5, OBV needs to rise above the High Line and remain there.
Therefore, you need to have a relaxed mind and check whether there is support.
-
Thank you for reading to the end.
I hope you have a successful trade.
--------------------------------------------------
- This is an explanation of the big picture.
(3-year bull market, 1-year bear market pattern)
I will explain more details when the bear market starts.
------------------------------------------------------

ETH. seed at 2400 zone today. Poised for +1000$ price growth.ETH was met with a good healthy correction back to 38.2 Fib. An ideal retracement zone for new buyers to converge.
ETH was able to tap 2800 zone before retreating back to -400 -- and everything is moving based on expectation. The current behavior just made the bull scenario much attractive now conveying some healthy metrics for the bulls.
Best to seed at the current price as 2400 levels. Based on our diagram this is replicating the same structure as the last surge from 1500 area last April 2025.
From this range hibernation, we can see some good setup forming for the BULLS -- an apparent accumulation zone in progress.
Don't miss out if you missed the last pump -- its your chance today. It does'nt come often.
Spotted at 2400
Mid Target at 3400.
* The chart above is in USDETH, an eth reverse metrics -- depicting the heavy gravity bears at the moment. Bulls are about to take over soon.
TAYOR.
Trade safely.

Ethereum: No Sellers, No Bears, No Pressure; Bullish ConfirmedTo put it simple, there is absolutely no selling pressure on ETHUSDT. And this is reasonable, Ethereum is now so cheap that not many people are looking to sell.
Let's dive into this chart and see what we can find.
Spoiler alert: I am no longer bearish on ETHUSDT. "The retrace" simply isn't a thing on this pair. There is no bearish action. Let's read the chart and see what it has to say.
The low 7-April... Ok.
8-May ETHUSDT produced a very strong green candle to break above EMA55 and EMA89. Volume was also high on this date. These levels tend to work as strong resistance and the fact they broke decisively, means that the bullish bias is confirmed and Ethereum isn't likely to move back below again. Whenever there is a drop, these lines will work as support.
The peak soon happened and Ethereum went sideways, it has been sideways in a small phase of consolidation. The lowest point came 18-May. There was a failed attempt by the bears to push prices lower but this ended as a big fail. Ethereum continues strong.
Here we have again EMA55 and EMA89, magenta and blue lines on the chart. These levels remain untested as support which is a signal of strength. While some pairs went down 20%, 30%, 50%, Ethereum's maximum drop has been 14%, now, that's strength.
As seen from the diagram on the chart, we are about to enter the third wave of a bullish impulse. There can be a correction after the third wave ends followed by additional growth.
The break of EMA55/89 as resistance confirms that Ethereum is bullish mid- to long-term. This means 3-6 months of growth.
Once MA200 is broken as resistance, we have at least six months of bullish growth confirmed, this will happen later this month.
No bears means the bulls are in control.
A very small retrace means buyers are strong.
It all makes sense, who would be willing to sell their Ether when there is so much room left for prices to grow?
No one, that is why prices remain strong.
Adapt to market conditions fast and live.
Some pairs are going down while others are going up.
Some pairs are sideways; some are growing strong.
This is the early stage of the 2025 bull-market, just wait and watch... Just watch! It will get wild faster than you think and it will become so wild that you won't be able to handle the market at all. Everything will become so good, so fast, that you will feel blessed for deciding to enter the Cryptocurrency market during April's low.
It is still early though, remember, $7,000 is the minimum price for Ethereum in late 2025. $11,000 is also possible.
Thanks a lot for your continued support.
Namaste.

Long-Term Technical Outlook: Critical Decision Point Approaching
The chart illustrates a long-term technical structure where the price has been following an ascending channel after a prolonged bearish trend. However, recent price action indicates a breakdown below the green ascending trendline, raising concerns about a potential shift in market sentiment.
Currently, the $117 level is acting as a pivotal support zone. A sustained breakdown below this level — and more critically, below the red lower trendline — would validate the bearish scenario. This could trigger a deeper correction phase, with downside targets aligned along the red projection path. Such a move may lead to significantly lower price levels in the medium to long term.
🔽 Bearish Scenario:
If the price fails to hold above $117 and breaks below the red trendline, this would confirm the start of a bearish leg. Based on historical structure and projected trajectories, this could result in a descent toward the $93 level initially, with the possibility of extending further downward depending on market conditions.
🔼 Bullish Scenario:
On the other hand, if the price manages to reclaim the green trendline and more importantly, stabilize above the $204 resistance zone, it would signal renewed bullish strength. Such a move would open the path toward higher highs, potentially re-entering the previous upward channel and continuing the macro uptrend.
🧭 The price structure is now approaching a decisive zone, where either a confirmation of bearish continuation or a bullish recovery will likely unfold. Both scenarios have been visually outlined — green lines indicating bullish continuation, and red lines representing bearish momentum.
📌 Note: This analysis is for educational purposes only and should not be interpreted as financial advice.

Ethereum Breakdown Ahead? Classic Head & Shoulders Pattern Hello Guys!
Ethereum looks like it’s setting up for a potential drop after forming a textbook Head & Shoulders pattern on the 4H chart.
This pattern (marked clearly with a left shoulder, head, and right shoulder) is often seen before a price reversal. Right now, ETH has already broken below the neckline (around $2,480), confirming the bearish pattern, and is currently retesting that level from below.
📉 What’s Next?
If the pattern plays out, we could see ETH drop toward the projected target zone around $2,200–$2,250, which is highlighted in blue on the chart. This zone also lines up with a previous area of interest and sits near a broken trendline, adding confluence to the setup.
✅ What I see:
Resistance: ~$2,500 (neckline retest)
Target: ~$2,200 support zone
Broken trendline adds downside pressure
Unless bulls reclaim the neckline quickly and push above the right shoulder (~$2,650), this looks like a bearish continuation setup.

Ethereum Danger Zone —Protection, Correction or Continuation?Ethereum can be seen trading below EMA55 on the 4H timeframe. The biggest volume session happened 9-May and it was red. This tells us that there is correction potential after a very strong 101.1% bullish growth wave.
There are mainly three levels to consider for the correction potential after ~100% growth. 0.382, 0.618 & 0.786 Fib. retracement levels. After the test of these levels, whichever one comes last, we can read the chart again and see if Ethereum will continue lower or produce a bullish wave.
One thing is very certain though, after strong growth, there is always a correction/retrace. This is what you are seeing now in this chart. The start of the drop. Taking action is best.
The market moves in waves and will never stop this pattern, it fluctuates. To trade, one buy lows near support; sells high when resistance hit. 100% growth is very strong for the second biggest Cryptocurrency project, the #1 Altcoin.
After a strong bullish wave there is always a correction. After the correction there can be more correction but at some point the market turns. Each chart/pair needs to be considered individually on multiple timeframes to have a better understanding as to what will happen next.
In a single day, based on the news, market conditions can always change. Stay alert!
Namaste.

Ethereum, Guessing The Next Move ($1,500 or $2,000?)The million dollars question; What about Ethereum, lower or recovery?
And this is truly a million dollars question because knowing the answer can make you millions. It can either safe you lots of money or it can make you lots of money.
👉 Ethereum is going lower.
The 18-May low happened at $2,323, and this low wasn't challenged, the drop yesterday ended as a higher low. But, there is something... We lost some important support levels.
ETHUSDT lost the 0.236 Fib. retracement, when this happens, the action tends to move to the next lower-level which is below the 18-May low.
Looking at the 4H TF, ETHUSDT lost EMA55 and MA200, so these are also pointing lower.
Just a few days back I mentioned $2,000 entry LONG opportunity for Ethereum, this price might be possible but it is still really early.
The market has been sideways and this breakdown is new. It would be good to wait for the weekly session close to see what prices we will get, without this information, I can say that it is still too early to say, but I can still make my guess. My guess is that it is going lower.
Thank you for reading.
Namaste.

ETH Bullish | Inverse H&S | Cup and Handle PatternEthereum is still dragging its feet towards a new ATH, or at least, towards a high. But there are some positive signs showing up on the chart.
Make sure to check out yesterday's update on Bitcoin:
____________________________
BINANCE:ETHUSDT

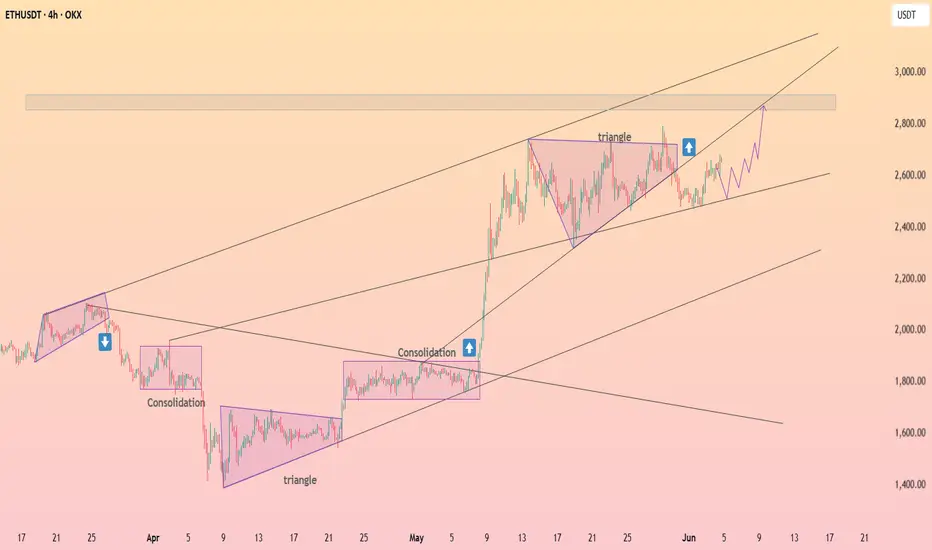
HolderStat┆ETHUSD channel climbCRYPTOCAP:ETH cruises within a steep four-hour rising channel; the latest triangle breakout paused near 2.6 k. Converging trendlines, former consolidation support and higher-low structure all aim for the 2.9 k liquidity zone. Bulls steer while the channel median holds.
ETHCHAN. Vitalik like it.ETHCHAN with a strong narrative experiences fluctuations and now the price can make a Fibo bounce.

SNX/USDT Short-Term Trade | Entry at 0.627 with Clear TargetsMidterm/Intra-day Setup
This is an intra-day (midterm) trading setup.
Entry Price: 0.627
Take Profits (TPs): Refer to the marked levels on the screen for target points.
Stay disciplined and manage your risk accordingly.

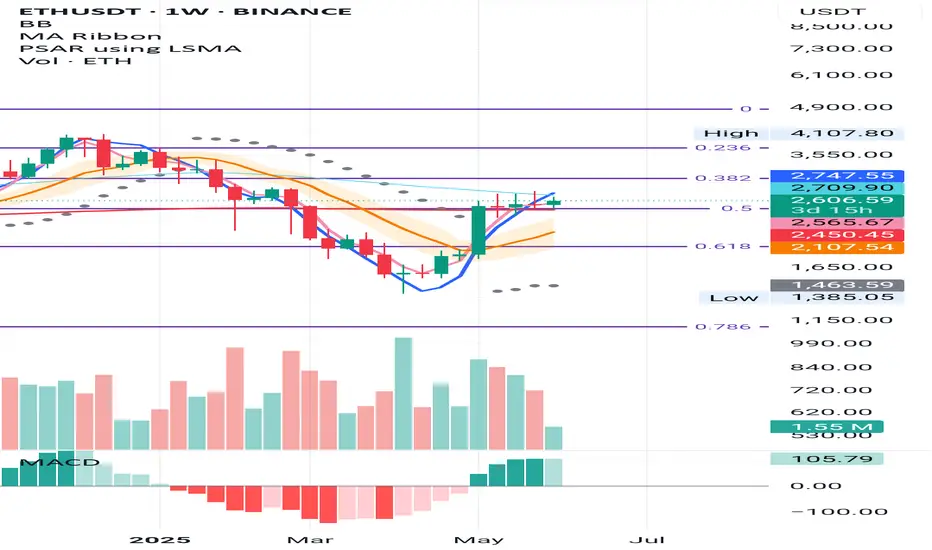
ETH Weekly – Signs Aligning for a Long Setup
ETH is forming subtle higher lows above the 0.5 Fibonacci level and the 200MA—both sitting near the same key support zone.
The 50MA is currently acting as resistance, but structurally we’re seeing MLR > SMA > BB center, and the PSAR flipped bullish since the week of May 12.
We now have all the signals needed for a valid long entry on this timeframe.
Feel free to drop your thoughts in the comments—good or bad, all engagement is appreciated.
Take profits. Manage risk. Stay sharp.
ETH Monthly – Fibonacci Structure in Play
ETH has been respecting the monthly Fibonacci levels with surprising precision.
There was a clear double top at the 0.236 Fib in May and November 2024, with a base forming at the 0.5 Fib. That same 0.5 Fib now acts as support, aligned with the 50MA.
The BB centre is currently stopping price, but for how long remains to be seen.
SMA is above MLR and rising, which supports a bullish bias.
If this structure holds, the next resistance zones may align with the higher Fib levels.
Feel free to drop your thoughts in the comments—good or bad, all engagement is appreciated.
Take profits. Manage risk. Stay sharp.

$ETH - Short-term Outlook Ethereum is stuck in a neutral zone. Unless it breaks above the $2.8k resistance, altcoins likely won't see much movement either.
It's consolidating below the resistance, in a high-volume node after strong impulse from $1.7k
No strong seller absorption yet at resistance → suggests indecision
We have to break above the mid-range for a bullish shift or possible retest of the supply zone at $3k to $3.4k

Ethereum Prediction update 7% PUMP and Targets HIT! Whats Next?Ethereum hit both of our targets, and pumped by 8% without any leverage!! What is going to happen next?

Ethereum is still bullish! (1D)First of all, read the text carefully to avoid any misunderstandings.you should know that the market is currently at a sensitive point, and Ethereum’s bullish move does not necessarily mean other coins will follow the same path.
As marked on the chart, the START of Ethereum’s bullish move began after a lengthy and deep correction. Observing ETH's current behavior, this wave is sharp and appears to be more of a time-based correction rather than price-based. Wave B moved sideways and took significantly more time than wave A, suggesting that wave C could very well begin without a deep pullback, pushing price toward higher levels.
There’s a liquidity pool in the upper area that we’ve highlighted. In order for this momentum to slow down, price likely needs to hunt a major liquidity level.
There was a fresh order block inside the liquidity pool, and although price touched it, there wasn’t a deep reaction | lows weren’t taken out, and all the lows during the correction have remained intact, which is a bullish signal.
It seems that price intends to at least reach the red zone we've marked.
For this scenario to play out, the two green lines near the current price candles must hold. A daily candle closing below the invalidation level would invalidate this outlook.
For risk management, please don't forget stop loss and capital management
Comment if you have any questions
Thank You

$ETH Broadening Wedge TargetCRYPTOCAP:ETH reached its technical target of $4K from the ascending triangle (Jul '22-Oct '23).
CRYPTOCAP:ETH appears to be back in the multi-year range between $1.9K-$4K.
If the Bull Market continues, the current macro pattern could develop into a flat top broadening wedge with a target of $11.7K.
Invalidation if it fails to break $4K, or falls to Hades.

ETH/USD gearing up for potential breakoutThe ETH/USD has been coiling inside a bullish continuation pattern for several weeks now and a breakout could be on the cards soon. The consolidation suggests ETH is gearing up for a potential breakout soon, as it chips away at resistance coming from the 200-day moving average near $2700.
Further resistance is seen between $2745 to $2855, as shaded in grey on the chart. If it gets through this area of resistance in the coming days, then a big breakout could be on the cards, with the first stop likely around $3,000, but we could go much further than that over time, given the length of the current consolidation.
However, it is essential that the ETH/USD doesn't break the support trend of the consolidation pattern and key support at $2470 now. If it does, then that would invalidate the bullish price structure.
By Fawad Razaqzada, market analyst with FOREX.com

ETH at a Critical Decision Level – $2260Ethereum is currently showing strong price action around the key decision level of $2260. This zone will likely determine the next major move:
A breakout above could trigger a bullish continuation.
A rejection here may send ETH down, possibly all the way toward $1000 in the long term.
📌 Stay tuned — we'll update you as the move unfolds. Keep in touch!

Raoul Pal's Big Banana. $100 Trillion dollars Crypto market.And how on earth do we reach that point?
Is Raoul's thesis regarding the exponential age accurate, suggesting we have until 2030 to invest and reap the benefits; so "don't F@ck this up!"
As a charting enthusiast, I am eager to see if there exists a technical foundation that could allow us to teleport to those levels and estimate how many years it might take.
Let's examine the entire crypto market, which includes everything from stable coins to tangible real world assets like Gold.
We can distinctly identify three significant consolidation patterns.
Rising wedge #1
a sideways pennant
rising pennant #2
Now, considering this is a logarithmic chart.
It provides us with logarithmic amplitudes and projections.
An amplitude is a calculated move based on the boundaries of the consolidation pattern.
Essentially, it involves taking the top and bottom width and applying it to the breakout point for a rising pattern.
In a #HVF, we utilise the midline of the funnel to forecast targets.
The projections illustrated on this chart pertain to the sideways pennant, employing the flagpole to establish our target.
It is this sideways pennant pole projection that leads us to 100 trillion dollars and beyond. Test it out for yourself if you find it hard to believe these figures could become a reality :)
So there we have it; yes, 100 trillion dollars may appear excessively optimistic and fantastical, especially since we are currently at 3.28 trillion dollars.
However, the charts indicate that Crypto could indeed be the sector where the majority of financial transactions take place in the forthcoming exponential future.

"ETH - Time to buy again!" (Update)The ETH will increase $2K and reach to the top of the wedge in the coming weeks .
Best regards CobraVanguard.💚

ETH/USDT 1DAY CHART UPDATE !!ETH has broken out of a long-term downtrend (black diagonal trendline) and is now in a consolidation phase below the $2,800–$2,850 resistance.
The price is currently $2,612, showing hesitation below the key horizontal resistance.
Resistance Zones:
$2,800–$2,850: Key horizontal resistance. Breaking above this confirms bullish continuation.
$3,200 and $3,600: Medium to long-term bullish targets.
Support Zones:
$2,000–$2,200: Strong horizontal support + ascending trendline + 50 EMA (red line)
$1,410: Key long-term support (unlikely to be tested soon unless the market reverses)
ETH breaks and closes above $2,850 ➝ $3,200 → $3,600 → $3,800+ likely to rise
The structure suggests that a higher low will likely form before the breakout.
If ETH rejects at $2,850, expect a retest of $2,000–$2,200 (golden zone)
This would create a bullish higher low setup and could be a strong buy-dip opportunity.
Thanks for your support!
DYOR. NFA
