BANANA TIME FOR ETHEREUM? or BIG SHORT? #ETHInstitutional holdings: Public companies accumulated over 1.2M ETH, with strategies leaning into staking and liquid staking for reserve yield.
Supply and fees: Circulating supply rose 0.1% QoQ to 120.7M ETH; network fees fell to multi‑year lows as activity migrated to L2s and alternative L1s.
Staking: Total staked ETH climbed to 35.7M (29.6% of supply), with USD stake value up 43% to $89.2B
Bullish momentum narrative: Multiple outlets point to consolidation below major resistance with upside targets between $4,500 and ~$6,900 contingent on breakouts and institutional flows resuming.
On-chain/structural context: Continued high staked share (~30–35% of supply) and ETF rotation narratives underpin reduced liquid supply and potential resilience, though breakouts hinge on clearing $4,500–$4,975 resistance and defending ~$3,800 support
Main news that captured my Attention is:
Animoca Brands plans to go public on Nasdaq via a reverse merger with Currenc Group, expected to close in 2026.
The Hong Kong-based firm, valued at $6 billion in 2022, has invested in over 600 projects across gaming, DeFi, NFTs, and metaverse sectors.
The merger will make Animoca the world’s first publicly-listed, diversified digital assets conglomerate, with Animoca owning 95% of the new entity.
Currenc will divest from its current operations, including a digital remittance platform, as part of the deal.
Animoca’s digital asset treasury includes Bitcoin, Ethereum, Solana, and MOCA, with a market cap of $208 million for MOCA.
The merger is subject to Australian regulatory approval; Animoca previously traded on the Australian Securities Exchange before delisting in 2020.
Ethereum Layer 2 project MegaETH announced its third community-led raise, starting at a $1 million valuation with a cap of $999 million via an English auction.
The raise is conducted through Sonar, Coinbase-acquired ICO platform founded by Jordan “Cobie” Fish.
Coinciding with the raise, Hyperliquid launched MEGA pre-market perpetuals, quickly valuing MegaETH at $6 billion pre-market, with a current FDV of $5.2 billion.
If the raise hits the maximum valuation, ICO participants could see a 5x return; early Echo round investors are up 23x, and Fluffles NFT holders nearly 10x.
The event marks MegaETH’s third community-focused funding effort, emphasizing long-term social and onchain engagement.
The rapid valuation surge signals strong investor interest ahead of the official launch.
ETH

Ethereum - Expecting Bearish Continuation In the Short TermH1 - Strong bearish move.
No opposite signs.
Currently it looks like a pullback is happening.
Expecting bearish continuation until the two Fibonacci resistance zones hold.
If you enjoy this idea, don’t forget to LIKE 👍, FOLLOW ✅, SHARE 🙌, and COMMENT ✍! Drop your thoughts and charts below to keep the discussion going. Your support helps keep this content free and reach more people! 🚀
-------------------------------------------------------------------------------------------------------------------

Ethereum Recovery Stalls — $3K Retest on the Horizon?After the flash crash on October 10th, ETH recovered quite well — but as mentioned at that time, for a full recovery and return to a bullish tone, the price needed to reclaim the $4,300 resistance.
That never happened...
After a second attempt on Monday, the price is now back below $4,000, testing the recent short-term support zone.
Looking at the broader structure since early August, the market has turned decisively bearish, showing two clear phases of distribution.
As previously noted, the price continues to press against the confluence support, and I expect a breakdown to occur soon.
If that happens, ETH could fall toward the $3,000 area to retest the major support level that dates back to 2024.

ETHUSDT.P - November 4, 2025ETHUSDT.P is maintaining a clear bearish structure, with price accelerating lower toward the $3,400.00–$3,381.34 zone. The setup indicates a potential continuation of the downtrend toward this target area, unless invalidated by a recovery above the $3,681.23 resistance level. A decisive breakdown below $3,381.34 would open further downside extension, while a rebound from this zone could signal short-term relief before further weakness.
Risk Assessment: Moderate risk — momentum remains bearish, but proximity to a key support zone may trigger temporary corrective bounces before continuation.

ETHUSDT.P - November 4, 2025ETHUSDT.P is currently attempting a short-term bullish reversal within a broader corrective structure. After forming a local low near the $3,460.00–$3,446.72 support zone, price has rebounded and is now targeting a potential buy setup around the $3,538.13 level. This suggests buyers are seeking confirmation for continuation toward the $3,625.51 partial profit area and ultimately the $3,647.77 profit target.
A break and sustained move above $3,625.51 would reinforce the bullish momentum, while failure to hold above the $3,538.13 entry zone could expose ETH to renewed downside pressure, revisiting the stop level.
Risk Assessment: Moderate risk — price is showing early signs of recovery, but confirmation is needed above near-term resistance. The trade setup offers a favorable risk-to-reward ratio if the $3,460.00 support holds, though volatility may persist before directional clarity emerges.

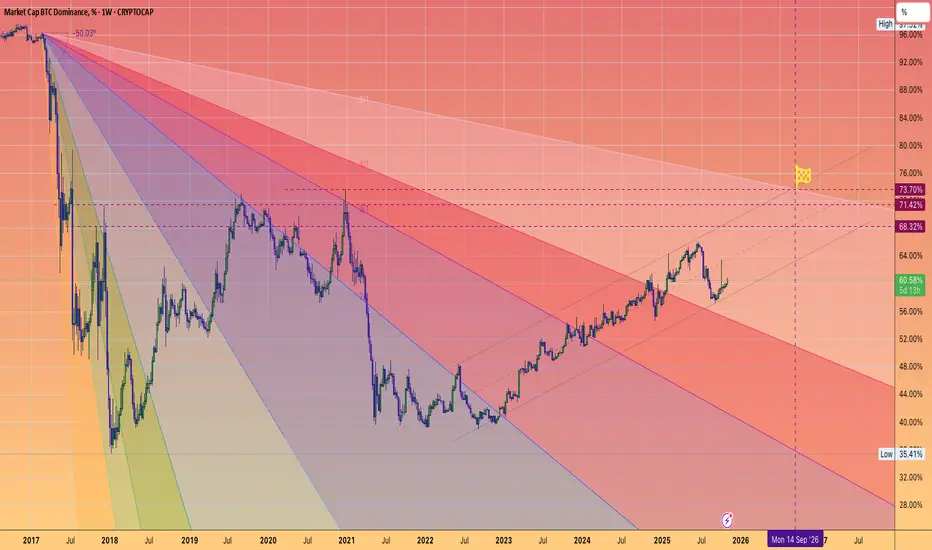
BTC.D May not TOP until next September!Despite alt/BTC pairs looking battered
**Capitulation is likely not complete**
Most Altcoins remain in downtrends v BTC
Timeline:
2025: grind to 63-65%
2026 Final Push to 73%?
Altcoins to seek relief once this finally turns around.
You may be able to start DCA'ing BTC as early as next March in preparation to buy beaten down quality Alts...
focusing on ETH, SOL, and 2's that have usage... not simply clogging up the landscape of empty chains.
AFTER THE BREAKDOWN 105K IS THE KEY LEVEL FOR RECOVERYWe have seen an unexpected breakdown in BTC, even despite the positive news about the China deal. BTC continued to decline further, although the data has generally been pointing in the right direction.
At the moment of writing, BTC is still in a downtrend. However, the $105K level could be a key point that triggers a potential recovery, depending on how the upcoming data unfolds.
We will continue to monitor whether BTC can enter the $105K zone in the coming time frames.

$ETH at Crucial SupportThe market took a hit - total cap fell from $4.28T to $3.5T, and CRYPTOCAP:BTC is testing support near $103,800. We’ve seen this setup before: panic, whales moving coins, fear everywhere. Yet November often flips sentiment fast - historically, Bitcoin averages +40% this month.
Ethereum is under heavier pressure, possibly heading toward $2,700-2,500 zone. $3,300 remains the key level to watch staying above it keeps the momentum alive, but a break below could open the door to downside pressure.
But these shakeouts often reset the market before the next trend begins - and when liquidity returns, Ethereum usually leads the rebound.
The crypto market is bleeding, major assets like CRYPTOCAP:BTC , CRYPTOCAP:ETH and others have been slipping while liquidity pulls back and sentiment cools.
The total market cap has dipped; multiple large‑cap coins are down over the last 24 hours. We’re possibly entering a phase where panic gives way to opportunity, but timing and tone matter. What’s your move: sit tight, buy the dip, or wait for a clearer signal?

ETH Analysis: Key Support Zone Could Signal the Next Big Move Ethereum ETH is currently trading into a critical support zone 🧱 — one that aligns with both weekly and daily order blocks on the higher timeframes. This confluence marks an area where institutional buying interest often re-emerges. Beneath the current price, there’s also a liquidity pool resting under prior lows 💧 — a region likely to attract stop hunts before any significant move higher.
From a macro perspective, my bias remains bullish 🐂. What we’re seeing now appears to be a deep corrective pullback, not a structural reversal. On the monthly and weekly charts, Ethereum continues to respect bullish market structure, holding above key swing points.
For that reason, I’m focused primarily on buy setups from areas of premium-to-discount rebalancing. However, if price decisively breaks lower and retests the volume profile levels discussed in the video 📉, I’d be open to shorting opportunities — but only with confirmation. Ideally, I’d like to see a structural break to the upside 🕊️ followed by a retracement to enter long.
⚠️ Disclaimer: This is not financial advice. Always do your own research and manage risk appropriately.

ETHUSDT 4-Hour Chart Analysis. ETHUSDT 4-Hour Chart Analysis.
ETH is forming a falling wedge, a typically bullish reversal pattern, with price just above strong support ($3,389, orange line).
RSI: The indicator is showing bullish divergence—price is making lower lows, but RSI lows are rising, hinting at possible reversal.
Expect further consolidation or small dips toward wedge support, followed by a breakout attempt.
On breakout, resistance is at $3,900–$4,100, then $4,830 as the next major target.
ETH is holding above support and showing bullish RSI divergence. Watch closely for wedge breakout—this could trigger a strong rally if confirmed.
DYOR | NFA

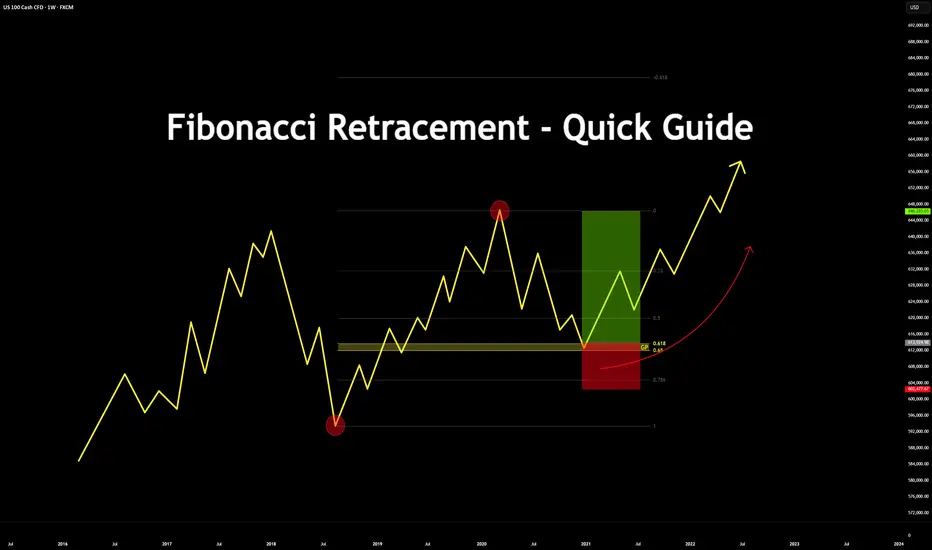
Fibonacci Retracement - Quick Guide in 5 StepsTrading the Fibonacci Retracement - Quick Guide in 5 Steps.
What is the Fibonacci tool?
The Fib Retracement Tool is a tool used widely across many charts. From crypto to stocks.
It assists in identifying the Golden Pocket, along with any potential Support and Resistance zones based on the sequence in Fibonacci.
Investors & Traders draw it from a previous high/low or low/high.
On a chart, each key level shows where price might pause or reverse during a pull back, before it continues the trend.
In this guide you will learn how to use the Fibonacci tool in 5 steps.
1. Configurations
Open up your Fib Retracement Tool's settings, apply the below configurations.
(You can change the color to your choice)
2. Identify High/Low's
Identify, recent highs and lows of your current chart/pair.
3. Applying Fib Retracement
Select your Fib Retracement tool. Place it on your chart starting from the swing low to the swing high.
4. Once completed
Highlight the Golden Pocket Field in the zone (0.65-0.618)
5. Review Entry
Price will eventually make it's way back down to the Golden Pocket to retest and reverse.
SL Placement would be on a previous low or key level, TP placement would be at a previous high or key level.
Bonus:
See the real time example below:
Please like, comment and follow if this guide was useful to you.
If you have any requests on analysis or tutorial requests, let me know and I'll be happy to make one!
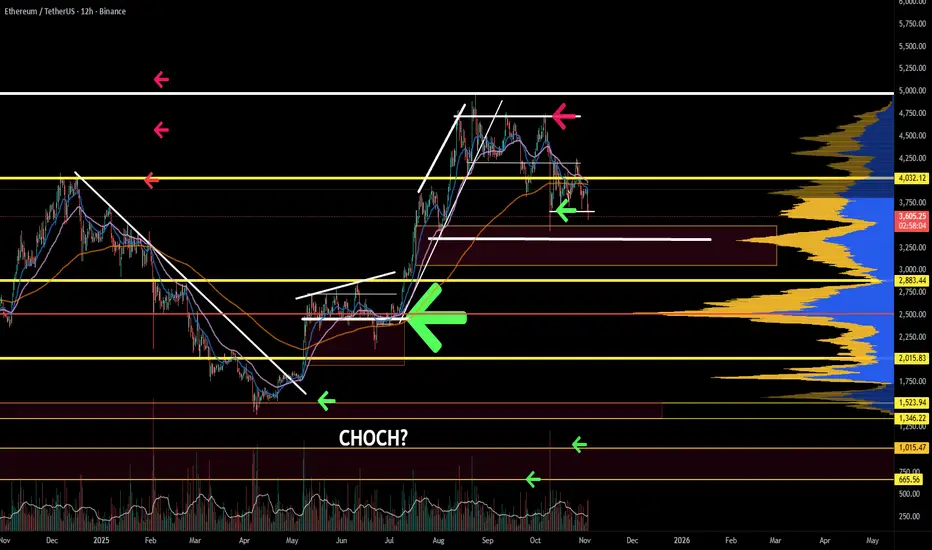
ETH/USDT 1W Chart📊 Market Structure:
Main Trend: Still up (higher lows and highs pattern persists).
Current Phase: Correction in an uptrend.
Local Trend: Down for several weeks (series of red weekly candles).
⚙️ Key Support and Resistance Levels:
Resistance (green lines):
4,753 USDT – recent local high, very strong resistance.
4,373 USDT – previous consolidation level, currently a supply zone.
3,979 USDT – current key local resistance, which previously served as support.
Support (red lines):
3,600 USDT – currently tested support level (coincides with the uptrend line).
3,165 USDT – next strong support level (previous local lows).
2,740 USDT – strong long-term support, potential target for further correction.
📈 Trendline:
The black uptrend line connects successive higher lows since April 2024.
The current weekly candlestick is testing this line (confluence with support at 3,600 USDT).
Maintaining this line = still a bullish medium-term scenario.
A breakout and weekly close below ~3,580–3,600 USDT → a signal of a possible trend reversal.
📉 Volume:
Downward volume is increasing, indicating supply pressure.
A lack of strong demand candlesticks = buyers are cautious in this zone.
🔄 Stoch RSI Oscillator (bottom of the chart):
Located in the oversold zone (below 20).
The %K (blue) and %D (orange) lines are starting to converge → a possible rebound signal in the coming weeks if a crossover occurs upwards.
🧭 Scenarios:
🟢 Bullish
Holding support at 3,600 USDT + trendline.
Confirmation with a bullish candle with higher volume.
Target: Return to 3,980 → 4,370 USDT.
🔴 Bearish:
Closing the week below 3,580 USDT (trendline + support).
Potential decline to 3,165 USDT, and even 2,740 USDT beyond.
RSI and volume suggest that downward pressure remains significant.
📌 Summary:
Key level: 3,600 USDT → decisive point for the market's further direction.
Short-term: Still downward pressure, but a technical rebound is possible (Stoch RSI).
Medium-term: The uptrend has not reversed until ETH closes below the trend line and 3,550 USDT.

ETHEREUM getting a spanking but its not over yetETH is in a downtrend; however, the structure looks retracive, which means that a corrective move would be almost over. If it is not, this means the price will break structure and fall further down. If the objective is to hunt liquidity, expect further downside.
ETHEREUM BEARISH BREAKOUT|SHORT|
✅ETHUSD after a clean breakout below the supply level, ETH shows bearish order flow with potential continuation toward 3520$. Price may retest imbalance before expansion to downside. Time Frame 2H.
SHORT🔥
✅Like and subscribe to never miss a new idea!✅

Why is crypto dumping? Bitcoin, Ether, and other cryptocurrencies extended their losses on Monday, even as stocks traded mostly higher.
Bitcoin hovers near $106,980, down about 3% in 24 hours, while Ethereum fell roughly 7% to around $3,642. Most major altcoins mirrored the decline (but more pronounced), reflecting a broader pullback in market sentiment.
Investors may have turned cautious after U.S. Treasury Secretary Scott Bessent suggested that the Federal Reserve’s interest rate policy may have already pushed parts of the economy (particularly housing) into recession.

BITCOIN – LONG - 105K SWEEP BEFORE WE LEAPTraders,
In my latest analysis I said that Bitcoin will reach 117.000-117.500 before a bigger dump. Price didn't reach those levels yet, and dumped instantly instead.
However, the main thesis still stands: price is likely to reach that zone (117.000-117.500) before a larger reversal down. But before that, I expect a short squeeze beginning at $105.000.
Why I Expect a Squeeze
During the Asia session, new leveraged short exposure was built. Open Interest (OI) increased while Net Shorts rose, showing that traders were adding fresh short positions.
Around 107,000–107,500, both Spot CVD and Coin-Margined CVD are showing bullish divergence. Sellers are active, but price is holding, which indicates absorption.
Stablecoin-Margined CVD in the same range shows exhaustion, suggesting selling pressure is fading.
At New York open, OI continued to rise together with Net Longs, meaning aggressive longs are now fading into the short exposure created during Asia.
What This Means
Historically, the London and New York sessions tend to sweep Asia’s positioning. When Asia builds short exposure, the later sessions often push price higher to liquidate those shorts. This often results in a short squeeze, which aligns with what we may be seeing now.
Determining the Next Move Down
Before deciding if price extends lower first, we must identify the variables of probability (VOP) — the “magnets” that increase the likelihood of a lower sweep.
1. Weak Thursday Low
There is a weak low that has not been properly tested. In TPO (Time Price Opportunity) terms, a weak low forms when price finds temporary support without strong buying response. Such levels often get revisited.
2. Unswept Sunday 19 Oct Low
There is also an unswept Sunday low from 19 October. Sunday lows are often swept because weekend liquidity is thin and order books are shallow. When liquidity returns during the week, those inefficient areas tend to get filled.
Imbalances and Volume Gaps Below
Next we look for gaps, imbalances, or LVNs (Low Volume Nodes) — areas where trading activity was limited or one-sided. These zones often attract price because markets seek balance.
Many traders identify “fair value gaps” by looking at candles, but that only shows part of the picture. To locate the real inefficiency, we need to look inside the candles using order flow or a Fixed Range Volume Profile (FRVP) to find the exact levels of bid-ask imbalance.
Volume Profile and Fibonacci Confluence
Drawing the Fixed Range Volume Profile from the impulse move below the Sunday 19 Oct low shows a clear imbalance at 105,070.
Checking confluences:
The 0.786 Fibonacci retracement (low to high) aligns exactly with 105,070
The 0.886 retracement (higher low to high) also aligns exactly with 105,070
Fibonacci extensions (1.113 and 1.272) both target around 105,000
The 0.618 extension also lands near 105,000
Thesis Summary
Based on all data and confluence:
Price likely dips to sweep the weak 30 Oct low and the 19 Oct Sunday low
Target zone: LVN / imbalance near 105,000
Expect a liquidity grab that traps late shorts and shakes out weak longs
After that, expect a reversal toward 117,000–117,500, where the next major liquidity pool lies
Why a Lower Sweep Is Expected
The Asia session built significant short exposure
There is an inefficiency and low-volume magnet around 105k
Weak lows provide clear liquidity targets
Once those areas are cleared, market structure favors a strong reversal upward
In summary:
Bitcoin is likely to make one more sweep toward the 105,000 zone to clear liquidity before expanding upward into the 117,000–117,500 area, where a larger reversal setup is likely to form. Of course, price can always move up or down without perfectly respecting these levels — the market does not owe us precision. These levels simply represent the highest-probability areas based on current data and confluence.

EtHUSD M30 | Bullish Bounce Off Key SupportETH/USD has bounced off the buy entry, which is a pullback support that aligns with the 50% Fibonacci retracement and could potentially rise from this level to the upside.
Buy entry is at 787.96, which is a pullback support that aligns with the 50% Fibonacci retracement
Stop loss is at 3,679.04, which is a swing low support.
Take profit is at 3,4.94, which his an overlap resistance that is slightly above the 40% Fibonacci retracement.
Stratos Markets Limited (tradu.com ):
CFDs are complex instruments and come with a high risk of losing money rapidly due to leverage. 68% of retail investor accounts lose money when trading CFDs with this provider. You should consider whether you understand how CFDs work and whether you can afford to take the high risk of losing your money.
Stratos Europe Ltd (tradu.com ):
CFDs are complex instruments and come with a high risk of losing money rapidly due to leverage. 70% of retail investor accounts lose money when trading CFDs with this provider. You should consider whether you understand how CFDs work and whether you can afford to take the high risk of losing your money.

Bearish drop off?The Ethereum (ETH/USD) could rise to the pivot and could reverse to the 1st support, which is an overlap support.
Pivot: 4,270.27
1st Support: 3,471.82
1st Resistance: 4,852.38
Disclaimer:
The above opinions given constitute general market commentary, and do not constitute the opinion or advice of IC Markets or any form of personal or investment advice.
Any opinions, news, research, analyses, prices, other information, or links to third-party sites contained on this website are provided on an "as-is" basis, are intended only to be informative, is not an advice nor a recommendation, nor research, or a record of our trading prices, or an offer of, or solicitation for a transaction in any financial instrument and thus should not be treated as such. The information provided does not involve any specific investment objectives, financial situation and needs of any specific person who may receive it. Please be aware, that past performance is not a reliable indicator of future performance and/or results. Past Performance or Forward-looking scenarios based upon the reasonable beliefs of the third-party provider are not a guarantee of future performance. Actual results may differ materially from those anticipated in forward-looking or past performance statements. IC Markets makes no representation or warranty and assumes no liability as to the accuracy or completeness of the information provided, nor any loss arising from any investment based on a recommendation, forecast or any information supplied by any third-party.

ETHUSDT: Short-Term Pullback Toward Trendline Before PotentialHi guys!
On the current 1h chart, Ethereum shows a clear structure of recovery following a liquidity sweep marked as “Hunting happened.” This move indicates that liquidity below the previous lows has already been collected, creating a potential base for a short-term bullish correction.
Price is currently consolidating above a minor support zone (highlighted in pink), showing a possible accumulation phase. The projected path suggests a potential bullish move toward the major supply zone around $4,080–$4,180, which aligns with the descending trendline acting as dynamic resistance.
However, given the overall bearish market structure and the dominance of the descending trendline, the area around $4,100 could serve as a strong reaction zone. A rejection from this level would likely confirm continuation of the broader downtrend, with a possible retracement toward the $3,700–$3,750 area.

BTC Entering New Uptrend —Weekend Volume Could Drive Price $116+BTC Entering New Uptrend — Weekend Volume Could Drive Price Above 116K +🚀
Bitcoin is showing strong signs of recovery after stabilizing at the lower support zone near 106K. The current structure indicates that BTC is entering a new uptrend, with higher lows forming and momentum gradually building.
📊 Market Structure:
BTC successfully held the volume support area and has begun to reclaim key short-term levels.
A break above 112K would confirm the shift in market momentum toward bullish continuation.
The next key resistance and target zone sits around 116K–117K.
💥 Weekend Outlook:
Volume is expected to increase through the weekend, which could fuel a strong upward move toward the 116K+ region.
With sentiment recovering and liquidity returning to the market, BTC appears positioned for a potential weekend breakout.
⚙️ Scenarios to Watch:
Holding above 109K–110K keeps the structure bullish and supports continuation toward 116K+.
Rejection below 109K could lead to a short pullback before another attempt upward.
💬 Summary:
BTC has entered a new uptrend phase, supported by strengthening volume and structure.
If momentum continues, a push beyond 116K during the weekend looks increasingly likely.

the real question is what happens to $ETH at ATH?eth is currently holding above the quarter channel with resistance above between 3500-ATH
there is a potential moonshot to 7k and beyond (13k?), if the markets are indeed in the infant stage of a bull run.
for now eth is heading towards the golden pocket of the move down with support from ath avwap
as htf bullish market structure never broke this could mean that the highs are ran, rsi has bounced the mid point and could be cruising towards the cook zone again, its here i will watch to see a divergence form when the 3M OB and yearly level is approached.
upside 3500, 4500/ATH, 7000, 130000
downside 1900, 1200, 800
its quite possible that we put in a long term range drifting between 5k and 1k before we see expansion upwards
nfa, just food for thought on the htf but most of the volume is supporting price.

ETHUSDT.P - November 1, 2025ETHUSDT.P is forming a corrective pullback within an intraday bullish structure, maintaining higher lows from the recent swing base. A buy limit order is positioned near $3,850, anticipating continuation toward the $3,891 resistance target. The stop-loss is set around $3,828 to manage downside risk. A rebound from the order zone would confirm bullish momentum resumption, while sustained price action below $3,828 would invalidate the setup.

Will Ethereum’s tight range lead to a breakout? | Day 34☃️ Welcome to the cryptos winter , I hope you’ve started your day well.
⏰ We’re analyzing BTC on the 1-Day timeframe .
👀 Ethereum on the daily timeframe. Ethereum is currently inside a box-like structure in a trading range format. The top of this trading range is in the $4,161 area, and the bottom of this trading range is in the $3,801 price area, where by breaking these zones, Ethereum can start a stronger and more impulsive leg of movement.
🧮RSI oscillator, which has now formed two important oscillation zones for us — one around 54, which overlaps with our long trigger, and the other around 40, which overlaps with our short trigger. The fluctuation limit crossing these zones can give more momentum to Ethereum’s next move on the daily timeframe.
🕯 Ethereum’s volume, after the flash crash the market experienced, has increased sharply, but the tendency has been pushed toward selling pressure, which has caused Ethereum’s corrections to always come with selling pressure.
📈 For Ethereum positioning, the specified zones have high price action validity, where you can set alerts so that if the price reaches these zones, you can open a position. Or, in the multi-timeframe, you can find the identified support and resistance zones and open positions with lower risk around these areas, moving toward anticipating higher or lower levels, so that in each level, you can add some risk to your position.
❤️ Disclaimer : This analysis is purely based on my personal opinion and I only trade if the stated triggers are activated .
