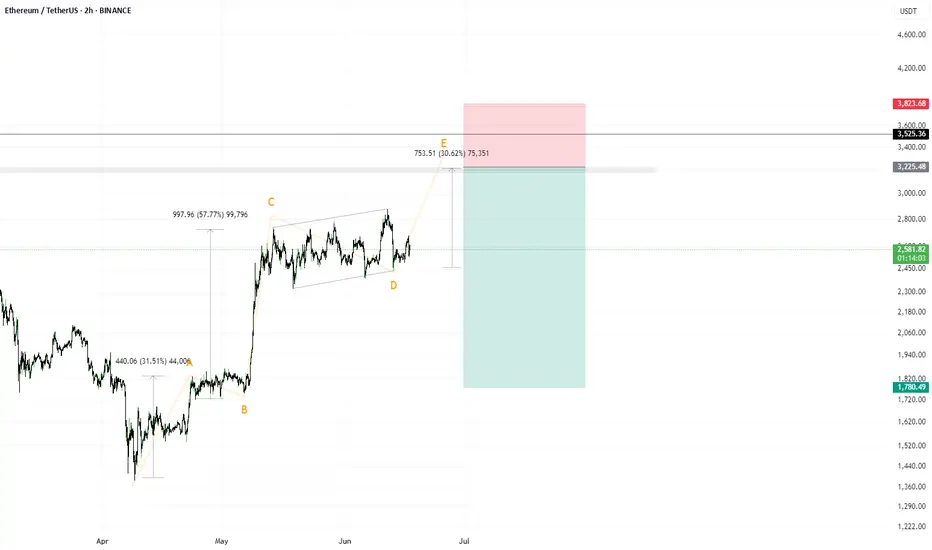
Short idea on $ETHJudging by the structure, if the vector is correctly identified, then on the ETH instrument, a rise to 3400–3600 remains relevant until the first serious correction (this idea would be invalidated in that case).
As for the potential trade — a breakout of the local highs amid global chaos and during the formation of wave 4 of a 5-wave structure. Typically, during the formation of wave 4, there is more media involvement, more noise, and panic.
I’m observing and planning to enter this trade.
Do not follow my vision blindly, as it could be detrimental to you.
ETHPERP
Ethereum Whale Buys $422M in ETH: Bullish Signal or False Hope?
The cryptocurrency market has always been a playground for big players, often referred to as "whales," whose massive transactions can influence market sentiment and price action. Recently, one such Ethereum whale has made headlines by accumulating a staggering $422 million worth of ETH in less than a month. This aggressive buying spree has sparked curiosity and speculation among investors and analysts alike. Is this whale positioning for a massive rally, or are they simply hedging against market uncertainty? Let’s dive into the details of this significant accumulation and explore its potential implications for Ethereum’s price trajectory.
The Whale’s Buying Spree: A Breakdown
Blockchain analytics platforms like Lookonchain and Whale Alert have been tracking the movements of this Ethereum whale over the past few weeks. According to their data, the whale has been systematically purchasing large quantities of ETH across multiple transactions, totaling over 150,000 ETH at an average price of approximately $2,800 per token. This accumulation, valued at $422 million, represents one of the largest buying sprees by a single entity in recent months.
What’s particularly intriguing is the timing of these purchases. The whale began accumulating during a period of relative market uncertainty, with Ethereum hovering near key support levels after a significant correction from its earlier highs. This suggests that the whale may have viewed these price levels as a buying opportunity, potentially anticipating a rebound or long-term growth in Ethereum’s value.
Why Are Whales Accumulating Now?
There are several reasons why a whale might choose to accumulate such a massive amount of ETH at this juncture. First, Ethereum remains the backbone of decentralized finance (DeFi) and non-fungible tokens (NFTs), two sectors that continue to drive innovation and adoption in the crypto space. Despite short-term price volatility, Ethereum’s fundamentals—such as its developer activity, network usage, and upcoming upgrades—remain strong.
Second, the whale may be betting on the long-term impact of Ethereum’s transition to Proof-of-Stake (PoS) via the Merge and subsequent upgrades like sharding. These upgrades are expected to make Ethereum more scalable, energy-efficient, and cost-effective, potentially driving greater adoption and value over time.
Finally, macroeconomic factors could be at play. With inflation concerns and uncertainty in traditional markets, some institutional investors and high-net-worth individuals are turning to cryptocurrencies like Ethereum as a store of value or hedge against economic instability. This whale’s buying spree could be a signal of growing institutional interest in Ethereum as a long-term investment.
Market Implications of the Whale’s Actions
The actions of whales often have a ripple effect on the broader market. When a single entity accumulates such a large amount of a cryptocurrency, it can create a supply crunch, reducing the amount of ETH available for sale on exchanges. This, in turn, can drive up prices if demand remains constant or increases.
Moreover, whale activity often attracts the attention of retail investors, who may interpret such moves as a bullish signal. Social media platforms like Twitter and Reddit are already buzzing with discussions about this whale’s accumulation, with many speculating that a major price rally could be on the horizon. However, it’s worth noting that whale movements can also be a double-edged sword—while accumulation can signal confidence, sudden sell-offs by the same whale could trigger panic and price crashes.
For now, the Ethereum market appears to be reacting positively to this news. In the days following the whale’s most recent purchases, ETH’s price has shown signs of recovery, bouncing off key support levels. But is this just a temporary blip, or the beginning of a sustained rally? Let’s explore this further in the next section.
________________________________________
Ethereum Bounces Hard After Support Bluff: A False Alarm or Fresh Rally?
Ethereum’s price action in recent weeks has kept traders on edge. After a prolonged period of consolidation and a dip toward critical support levels, ETH staged a powerful bounce, reclaiming key technical levels and reigniting hopes of a broader rally. However, the question remains: is this bounce a genuine signal of bullish momentum, or merely a false alarm before another downturn?
The Support Bluff and Subsequent Bounce
Ethereum had been trading in a tight range for much of the past month, with $2,500 acting as a crucial support level. This level was tested multiple times, and on several occasions, it appeared that bears would succeed in pushing the price lower. However, each time ETH approached this support, buyers stepped in, preventing a breakdown.
This repeated defense of $2,500 created what some analysts call a “support bluff”—a situation where the market tests a key level multiple times, creating uncertainty about whether it will hold. Just when it seemed like the support might finally give way, Ethereum staged a hard bounce, surging over 10% in a matter of days to reclaim the $2,800 level. This move caught many traders off guard, particularly those who had positioned for a breakdown.
Technical indicators also supported the bullish case for this bounce. The Relative Strength Index (RSI) moved out of oversold territory, signaling renewed buying pressure, while the Moving Average Convergence Divergence (MACD) showed a bullish crossover on the daily chart. Additionally, on-chain data revealed a spike in transaction volume and active addresses during the bounce, suggesting that the move was backed by genuine market participation.
False Alarm or Fresh Rally?
While the bounce has undoubtedly injected optimism into the Ethereum market, it’s too early to declare a full-fledged rally. Several factors could determine whether this move has legs or if it’s just a temporary relief rally before further downside.
On the bullish side, the whale accumulation discussed earlier could provide a psychological boost to the market. If other large players follow suit and start buying ETH at these levels, it could create a self-reinforcing cycle of demand. Additionally, Ethereum’s fundamentals remain strong, with ongoing developments like the upcoming Cancun-Deneb (Dencun) upgrade, which aims to reduce Layer 2 transaction costs, potentially driving greater adoption.
However, there are also bearish risks to consider. The broader cryptocurrency market remains correlated with macroeconomic conditions, and any negative developments—such as interest rate hikes or geopolitical tensions—could weigh on risk assets like Ethereum. Moreover, if the whale who accumulated $422 million in ETH decides to take profits at higher levels, it could trigger a sharp sell-off, undermining the current momentum.
For now, traders are closely watching key resistance levels around $3,000 and $3,200. A break above these levels could confirm a fresh rally, potentially targeting Ethereum’s previous highs near $4,000. On the other hand, a failure to sustain the current bounce could see ETH retest the $2,500 support, with a breakdown below this level opening the door to further declines.
________________________________________
Ethereum Developer Proposes 6-Second Block Times to Boost Speed, Slash Fees
Ethereum’s scalability and transaction costs have long been points of contention among users and developers. While the transition to Proof-of-Stake has improved energy efficiency, issues like high gas fees and network congestion persist, particularly during periods of high demand. In a bid to address these challenges, Ethereum developer Barnabé Monnot has proposed a radical change: reducing Ethereum’s slot times (the time between blocks) from 12 seconds to just 6 seconds. This proposal aims to make the network more responsive, improve efficiency for DeFi applications, and significantly lower transaction fees. But what are the implications of this change, and is it feasible?
Understanding Slot Times and Their Impact
In Ethereum’s current Proof-of-Stake consensus mechanism, validators propose and confirm blocks in slots that occur every 12 seconds. This slot time was chosen to balance network security, decentralization, and performance. A shorter slot time means blocks are produced more frequently, which could theoretically increase transaction throughput and reduce latency for users.
Barnabé Monnot’s proposal to halve slot times to 6 seconds is based on the idea that faster block production would make Ethereum more responsive, particularly for time-sensitive applications like decentralized exchanges (DEXs) and other DeFi protocols. Additionally, by processing transactions more quickly, the network could reduce congestion during peak periods, potentially leading to lower gas fees for users.
Potential Benefits of 6-Second Slot Times
If implemented successfully, Monnot’s proposal could have several positive impacts on Ethereum:
1. Improved User Experience: Faster block times would reduce the time users have to wait for transactions to be confirmed, making Ethereum more competitive with centralized payment systems and other blockchains like Solana, which boast sub-second transaction finality.
2. Enhanced DeFi Efficiency: DeFi protocols often rely on rapid transaction processing for arbitrage opportunities, liquidations, and other automated functions. A 6-second slot time could make these processes more efficient, potentially attracting more users and capital to Ethereum’s DeFi ecosystem.
3. Lower Gas Fees: By increasing the frequency of block production, the network could process more transactions per minute, reducing competition for block space during high-demand periods. This could lead to lower gas fees, addressing one of the most persistent criticisms of Ethereum.
4. Competitive Edge: Faster block times could help Ethereum maintain its dominance in the smart contract space, especially as rival blockchains continue to innovate with speed and cost efficiency.
Challenges and Risks
While the proposal sounds promising, it’s not without challenges. Reducing slot times could place additional strain on validators, particularly those with less powerful hardware. This could lead to missed slots or delays in block production, potentially undermining network stability. Additionally, shorter slot times could increase the risk of network forks or reorgs (reorganizations of the blockchain), where competing blocks are proposed simultaneously, creating temporary uncertainty about the canonical chain.
Another concern is the impact on decentralization. If faster block times disproportionately favor validators with high-performance hardware or low-latency connections, it could lead to greater centralization of the network, as smaller validators struggle to keep up. This would go against Ethereum’s core ethos of maintaining a decentralized and accessible infrastructure.
Finally, implementing such a change would require extensive testing and coordination among Ethereum’s developer community. Any misstep could result in bugs or vulnerabilities that compromise the network’s security.
Community Response and Next Steps
Monnot’s proposal has sparked lively debate within the Ethereum community. Some developers and users are enthusiastic about the potential for faster transactions and lower fees, while others caution against the risks of rushing such a significant change. Ethereum co-founder Vitalik Buterin has expressed cautious optimism, noting that shorter slot times could be a viable long-term goal but emphasizing the need for thorough research and simulation to understand the full implications.
For now, the proposal remains in the discussion phase, with no concrete timeline for implementation. If it gains traction, it could be tested on Ethereum testnets before being rolled out to the mainnet as part of a future upgrade. Regardless of the outcome, Monnot’s idea highlights Ethereum’s ongoing commitment to innovation and addressing user pain points.
________________________________________
Is Ethereum Staging a Repeat of 2021? Here’s Why a 200% Surge Could Follow
Ethereum’s price history is full of dramatic rallies and corrections, with 2021 standing out as a particularly bullish year. During that period, ETH surged from around $700 at the start of the year to an all-time high of nearly $4,900 in November—a gain of over 600%. As Ethereum shows signs of recovery in 2023, some analysts are drawing parallels to 2021, suggesting that a 200% surge could be on the horizon. But are these comparisons justified, and what factors could drive such a rally?
Parallels Between 2021 and 2023
Several factors from 2021 appear to be resurfacing in 2023, fueling speculation of a repeat performance:
1. Market Sentiment: In early 2021, the crypto market was riding a wave of optimism driven by institutional adoption, mainstream media coverage, and retail FOMO (fear of missing out). Today, while sentiment isn’t quite at 2021 levels, there are signs of growing interest, with major financial institutions exploring blockchain technology and retail investors returning to the market.
2. Network Upgrades: The lead-up to Ethereum’s London Hard Fork in 2021, which introduced the EIP-1559 fee-burning mechanism, was a major catalyst for price appreciation. In 2023, upcoming upgrades like Dencun and potential improvements to block times (as discussed earlier) could similarly boost confidence in Ethereum’s long-term value.
3. DeFi and NFT Growth: The explosive growth of DeFi and NFTs in 2021 drove massive demand for Ethereum, as most of these projects were built on its blockchain. While the hype around NFTs has cooled, DeFi continues to evolve, and new use cases like decentralized social media and gaming could reignite interest in Ethereum.
4. Macro Conditions: In 2021, loose monetary policies and stimulus packages created a favorable environment for risk assets like cryptocurrencies. While the macro environment in 2023 is more challenging, any shift toward accommodative policies—such as interest rate cuts—could provide a tailwind for Ethereum.
Why a 200% Surge Could Happen
If Ethereum is indeed staging a repeat of 2021, a 200% surge from current levels (around $2,800) would take ETH to approximately $8,400—a new all-time high. Several catalysts could make this possible:
• Institutional Adoption: Increased participation from institutional investors, as evidenced by whale accumulation like the $422 million ETH purchase, could drive sustained demand.
• Bitcoin Halving Effect: The upcoming Bitcoin halving in 2024 historically triggers bull runs across the crypto market, with Ethereum often outperforming BTC during these cycles.
• Technical Breakout: If Ethereum breaks above key resistance levels like $3,200 and $4,000, it could trigger a wave of buying momentum from technical traders and algorithms.
• Network Improvements: Successful implementation of upgrades like Dencun or shorter block times could enhance Ethereum’s utility, attracting more users and capital to the ecosystem.
Risks to the Bullish Thesis
Despite the optimism, there are significant risks that could derail a 200% surge. Regulatory uncertainty remains a major concern, with governments worldwide scrutinizing cryptocurrencies and DeFi. Additionally, competition from other Layer 1 blockchains like Solana, Avalanche, and Polkadot could divert developer and user attention away from Ethereum if it fails to address scalability and cost issues.
Moreover, the macro environment remains unpredictable. Persistent inflation, geopolitical tensions, or a prolonged recession could dampen risk appetite, weighing on Ethereum’s price regardless of its fundamentals.
Conclusion
Ethereum is at a fascinating crossroads. The massive $422 million accumulation by a whale signals strong confidence from big players, while the recent price bounce suggests that bullish momentum may be building. At the same time, innovative proposals like Barnabé Monnot’s 6-second block times highlight Ethereum’s commitment to addressing long-standing issues like fees and speed. Whether these factors coalesce into a 2021-style rally remains to be seen, but the potential for a 200% surge is not out of the question if key catalysts align. For now, investors and traders should remain vigilant, keeping an eye on technical levels, on-chain activity, and broader market trends to navigate the exciting but volatile world of Ethereum.

#ETH/USDT#ETH
The price is moving within a descending channel on the 1-hour frame, adhering well to it, and is heading toward a strong breakout and retest.
We are experiencing a rebound from the lower boundary of the descending channel, which is support at 2460.
We are experiencing a downtrend on the RSI indicator, which is about to break and retest, supporting the upward trend.
We are heading toward stability above the 100 moving average.
Entry price: 2540
First target: 2582
Second target: 2646
Third target: 2717

It tapped the level I was watching. Now it’s time to act, not reBINANCE:ETHUSDT just kissed the 0.382 fib at 2479 — and that’s not coincidence. That’s engineered precision. Anyone still waiting for confirmation is late. The confirmation already happened.
Here’s the structure:
4H FVG sits just below, untouched. It’s a magnet — but we may front-run it.
Price reacted from the 0.382, aligning with volume and previous inefficiency.
The 1H OB above (2541–2585) is the first real test. Break it, and we’re looking for 2640+.
This isn’t trend-following. This is manipulation-following. Watch where price shouldn’t go — and then track where it chooses to go.
What I’m watching:
Long is active from the 2479–2441 zone
TP1: 2510 (half-level reclaim)
TP2: 2541–2585 OB sweep
Final target: 2640.86 (EQ of full move)
Invalidation: clean break below 2440 FVG
A level doesn’t need your belief to hold. It needs liquidity.
More setups — real Smart Money reads, not noise — are posted in the profile.

#ETH/USDT#ETH
The price is moving within a descending channel on the 1-hour frame and is expected to break and continue upward.
We have a trend to stabilize above the 100 moving average once again.
We have a downtrend on the RSI indicator that supports the upward move with a breakout.
We have a support area at the lower limit of the channel at 2429, acting as strong support from which the price can rebound.
Entry price: 2535
First target: 2564
Second target: 2598
Third target: 2647

#ETH/USDT#ETH
The price is moving within a descending channel on the 1-hour frame, adhering well to it, and is heading for a strong breakout and retest.
We are seeing a rebound from the lower boundary of the descending channel, which is support at 2460.
We have a downtrend on the RSI indicator that is about to be broken and retested, supporting the upward trend.
We are looking for stability above the 100 moving average.
Entry price: 2506
First target: 2550
Second target: 2600
Third target: 2656

No impulse here is random. Each wick is a message.ETH has been rotating around inefficiency — not in confusion, but in setup.
This isn’t sideways. It’s structured accumulation just beneath premium OB.
Here’s the narrative:
Price swept the local low, then tapped the 2,619.06 level — a key reaction zone
Above us: a 15M OB at 2,639.07 — this is where early longs will either get paid or punished
Below: 2,592.78, the real demand block — if we break down, that’s the last hold before structure flips
The volume profile shows clear interest at mid-range — meaning Smart Money isn’t chasing price. It’s absorbing.
Expectations:
Hold above 2,619 → target 2,639 and reevaluate
Failure below 2,592 → rotation opens into inefficiency
Execution plan:
Clean long above 2,619, invalidation below 2,592
Short only if price flips 2,639 and fails to hold it on the retest
This is a reaction zone — I’m not chasing. I’m positioned.
Don’t confuse consolidation with indecision. Smart Money’s already placed.
More trades mapped like this — before they move — are in the profile description.

They bought the dip. I anticipated the shift.This ETH setup didn’t require hopium — just structure, volume, and timing.
The chart respected every level I mapped days ago. And now? Price is setting the table again.
We swept liquidity below 2488.11 — textbook turtle soup into a bullish STB on the 1H.
Then price ripped clean into the 4H OB and tapped 2649.12 — the fib extension target. That’s not retail momentum. That’s interbank delivery at work.
Now we’re pulling back. And here’s where it gets clear:
The 0.5–0.618 zone sits between 2586.56–2571.80
It overlaps with the 1H STB zone — a demand pocket from the origin of the expansion
If price consolidates above 2550.78 (the 0.786) and flips 2564.83 again, I expect continuation back toward 2618.32 and 2648.46
If we sweep 2524.01 without reaction — then it’s a deeper rotation
This isn’t a “buy support” setup. This is a model-driven continuation based on structure and internal range logic.
Entry bias is valid above 2580. Below 2524 — it’s invalidated.
I don’t guess entries. I forecast structure.
More models and trades? Check the profile description. Precision lives there.

Price doesn’t chase liquidity. It engineers it.ETH is mid-delivery — not in trend, not in reversal — but in execution. This is where most get faked out. I’m just reading the structure.
Here’s the play:
We’ve tapped into the FVG 4H, reacting from an inefficiency left by the last aggressive selloff
Above that, the BPR 4H marks a supply zone engineered for reaction, not breakout — that’s where early longs will get tested
Fib levels are clean: price is hovering around 0.5 (2,623.76), with clear tolerance for a dip into the 0.618–0.786 (2,584–2,528)
Two paths from here:
A clean push into 2,662.89 → 2,711.32, possibly even sweeping into 2,789.59, followed by rejection from premium imbalance
A deeper pull into OB 4H at 2,457.92 before any real mark-up begins
Execution mindset:
Intraday longs are valid as long as we hold above the 4H OB
HTF liquidity targets sit above 2,660 — but the smarter entries were already taken lower
If we reject the BPR without breaking 2,662, I expect a controlled drop back into discount
This isn’t a breakout. It’s a rebalancing. You don’t follow price. You align with its logic.
For more setups with structure, not noise — check the account description.

ETH/USDT 4H Chart Analysis – Bullish Continuation with Profit You're currently in a solid long position from 2,476.60, and with the price now at 2,537, your unrealized P&L shows strong gains (+$6,322.66). The technicals support your trade with the following highlights:
📊 Key Technical Insights:
Entry Zone: 2,476 – 2,488 (ideal long from OB + 0.786 fib retrace)
OB 4H Supply Target: 2,616.99 – potential area of resistance
Current Price Reaction Zone:
2,550 tapped and acting as interim resistance
Midterm pullback expected toward 2,514–2,490 before another leg up
🎯 Targets:
TP1: 2,550 (hit)
TP2: 2,616.99 (next key resistance/OB)
TP3: Trail to 2,660+ if momentum sustains
🛑 Stop-Loss Consideration:
Below 2,474 = invalidation of structure reclaim
🔁 Possible Scenarios:
Continuation to OB 4H
✔️ Breaks and holds above 2,550
✔️ Momentum push to 2,616
Retest Before Push
🔁 Pullback to 2,514 or 2,488 zone
🔁 Reaccumulation for next move
Failure Risk
❌ Rejection from 2,550–2,560
❌ Break below 2,474 = setup invalidated
📌 “Strong move off the lows with excellent risk-reward. Watch OB 4H at 2,616 closely for next decision zone.”

ETH 4H Setup – Double Tap Reversal + Fib TargetsEthereum has printed a double bottom wick rejection just above the 2,468 level and is now attempting a breakout above the local range high. Price has reclaimed structure, indicating potential momentum toward key fib resistances.
Key Technical Zones:
Support Zone: 2,468 – local double bottom (0% fib)
Breakout Level: 2,544 (0.236 fib)
Targets:
TP1: 2,590
TP2: 2,628
TP3: 2,666 (0.618 fib / likely exhaustion zone)
Scenario Outlook:
🟩 Bullish Path:
Strong rejection from 2,468 confirms demand
Push through 2,544 unlocks path to mid 2,600s
Trend continues if macro holds above 2,500
🟥 Bearish Reversal:
Rejection near 2,590–2,666
Bearish engulfing back below 2,507 invalidates this long setup
Could revisit 2,468 and break to 2,440s
Play Idea:
Entry: Reclaim 2,544 with confirmation
SL: Below 2,496
TP1: 2,590
TP2: 2,628
TP3: 2,666
📌 “ETH bulls defend the low — the battle now shifts to mid-range fib control.”

The wick was the test.Ethereum just kissed the 1.0 fib at $2475.33, tapping into a local demand pocket. That sweep cleared weak longs and set up a cleaner drive back into inefficiency.
What’s happening?
→ ETH is targeting the 1H Fair Value Gap (FVG) around $2512–$2522.
→ $2500 zone = critical reaction level.
→ Volume profile confirms buyer interest above $2480.
Entry Zone: $2480–$2490
SL: Below $2475 swing low
TP1: $2512.75
TP2: $2550.14 (liquidity sweep)
Bias: Bullish while above $2475
Why it matters:
ETH rejected the lows and reversed with structure + timing.
If it reclaims the FVG → it reclaims the narrative.

#ETH/USDT#ETH
The price is moving within a descending channel on the 1-hour frame, adhering well to it, and is heading for a strong breakout and retest.
We are seeing a bounce from the lower boundary of the descending channel, which is support at 2465.
We have a downtrend on the RSI indicator that is about to break and retest, supporting the upward trend.
We are looking for stability above the 100 moving average.
Entry price: 2558
First target: 2640
Second target: 2702
Third target: 2768

#ETH/USDT#ETH
The price is moving within a descending channel on the 1-hour frame, adhering well to it, and is on its way to breaking it strongly upwards and retesting it.
We are seeing a rebound from the lower boundary of the descending channel, which is support at 2313.
We have a downtrend on the RSI indicator that is about to break and retest, supporting the upward trend.
We are looking for stability above the 100 moving average.
Entry price: 2400
First target: 2466
Second target: 2512
Third target: 2602

$ETHUSDT - Major Breakout Alert! CRYPTOCAP:ETH has officially broken out of a long-standing descending parallel channel on the daily chart — a key structural shift in market sentiment. This breakout is further supported by a successful close above the 50 EMA, which had acted as dynamic resistance throughout the downtrend.
Key Technical Developments:
- Broke out of a descending parallel channel
- Closed above 50 EMA for the first time in weeks
- Strong daily candle with 8% gain confirms momentum shift
Immediate Support: $1,790 (former resistance zone turned support)
Next Major Resistance: $2,393
This is the mid-zone before ETH challenges the broader supply area around $2,550–2,850.
This breakout mirrors Ethereum's typical behavior during previous cycle expansions — grinding accumulation followed by aggressive breakout moves. The confluence of the EMA breakout and channel structure suggests we could be looking at the beginning of a broader trend reversal.
Trading Plan:
Retests towards $1,850–$1,790 can offer high R:R entries.
Watch for continuation patterns or consolidation above $2,000 for the next push.
CRYPTOCAP:ETH is reclaiming momentum — if BTC remains stable, this move could expand quickly.
If you find this analysis helpful, please hit the like button to support my content! Share your thoughts in the comments, and feel free to request any specific chart analysis you’d like to see.

Ethereum Golden Cross: ETH Eyes $3,000 BreakoutEthereum Flashes Golden Cross: A Bullish Beacon or a Fleeting Glimmer for the $3,000 Target?
The cryptocurrency market is once again abuzz with technical signals, and this time, Ethereum (ETH), the second-largest cryptocurrency by market capitalization, is in the spotlight. Traders and analysts are keenly observing a "Golden Cross" that has recently manifested on Ethereum's price charts. This classic bullish indicator has historically been associated with potential upward momentum, igniting discussions and hopes among investors: could this be the catalyst that propels ETH bulls to conquer the coveted $3,000 price level?
Understanding the Golden Cross: A Primer
Before diving into Ethereum's specific prospects, it's crucial to understand what a Golden Cross signifies. In technical analysis, a Golden Cross occurs when a shorter-term moving average (MA) of an asset's price crosses above a longer-term moving average. Most commonly, this involves the 50-day moving average (50-MA) moving above the 200-day moving average (200-MA).
The rationale behind its bullish interpretation is straightforward: the 50-MA reflects the average price over the last 50 trading days, representing recent momentum. The 200-MA, on the other hand, represents the longer-term trend. When the shorter-term momentum (50-MA) surpasses the longer-term trend (200-MA) from below, it suggests that the recent buying pressure and positive price action are strong enough to potentially shift the overall market sentiment and initiate a more sustained uptrend.
However, it's vital to approach this signal with a degree of caution. The Golden Cross is a lagging indicator, meaning it confirms a trend that has already been underway for some time, rather than predicting a future one with certainty. By the time a Golden Cross appears, a significant portion of the initial upward move might have already occurred. Furthermore, like all technical indicators, it's not infallible. False signals can happen, where a Golden Cross appears but fails to lead to a sustained rally, sometimes even preceding a market downturn. Therefore, while a Golden Cross is a positive sign, it’s best used in conjunction with other indicators and a broader market analysis.
Ethereum's Current Landscape and the Significance of the Signal
For Ethereum, the appearance of a Golden Cross is a noteworthy development, especially considering its price action in recent months. After periods of consolidation and navigating broader market uncertainties, such a signal can inject a fresh wave of optimism. It often attracts trend-following traders and algorithms programmed to react to such patterns, potentially increasing buying pressure.
The journey towards $3,000 for Ethereum is not just a numerical target; it represents a significant psychological level. Reclaiming this mark would signify a strong recovery and could pave the way for further exploration of higher price territories. The Golden Cross, in this context, acts as a technical validation for bulls who believe in Ethereum's underlying fundamentals and its potential for growth.
Factors Fueling the Bullish Case for ETH to $3,000
Several factors, beyond the Golden Cross itself, could support a bullish push for Ethereum towards the $3,000 milestone:
1. Strong Network Fundamentals: Ethereum continues to be the dominant smart contract platform, hosting the vast majority of decentralized finance (DeFi) applications, non-fungible tokens (NFTs), and a burgeoning ecosystem of Layer 2 scaling solutions. Ongoing development, such as progress on future upgrades aimed at enhancing scalability and efficiency (like proto-danksharding with EIP-4844), bolsters long-term confidence.
2. The Impact of "The Merge" and Staking: The transition to a Proof-of-Stake (PoS) consensus mechanism (The Merge) has fundamentally changed Ethereum's tokenomics. It significantly reduced new ETH issuance and, coupled with the EIP-1559 fee-burning mechanism, has often made ETH deflationary during periods of high network activity. The growth in staked ETH, which secures the network and earns rewards for stakers, also reduces the liquid supply available on exchanges, potentially creating upward price pressure.
3. Layer 2 Scaling Solutions Gaining Traction: Solutions like Arbitrum, Optimism, zkSync, and StarkNet are increasingly handling a significant portion of Ethereum's transaction load. This alleviates congestion on the mainnet, reduces gas fees for users interacting with these Layer 2s, and improves the overall user experience, making the Ethereum ecosystem more attractive and scalable. As these solutions mature and gain wider adoption, they enhance Ethereum's value proposition.
4. Renewed Institutional Interest: While institutional adoption of crypto can be cyclical, a clear bullish signal like a Golden Cross, combined with improving macroeconomic conditions or regulatory clarity, could reignite interest from larger financial players looking for exposure to digital assets beyond Bitcoin. Ethereum's utility and its role as a platform for decentralized applications make it an attractive candidate for institutional portfolios.
5. Positive Market Sentiment: The cryptocurrency market is heavily influenced by sentiment. A Golden Cross can contribute to a positive feedback loop: the signal encourages buying, which pushes prices up, further reinforcing bullish sentiment and attracting more participants. If Bitcoin, the market leader, also shows strength, it often creates a favorable environment for altcoins like Ethereum to rally.
6. Growing NFT and DeFi Ecosystems: Despite market fluctuations, innovation within the NFT and DeFi sectors on Ethereum continues. New use cases, improved user interfaces, and greater mainstream adoption of these technologies can drive demand for ETH, which is used to pay for transactions and interact with these applications.
Potential Headwinds and Obstacles on the Path to $3,000
Despite the optimism generated by the Golden Cross, several challenges could hinder Ethereum's ascent to $3,000:
1. Macroeconomic Uncertainty: Broader economic factors, such as inflation rates, interest rate policies by central banks, and geopolitical events, can significantly impact risk assets, including cryptocurrencies. A deteriorating macroeconomic outlook could dampen investor appetite and stall any potential rally.
2. Regulatory Scrutiny: The regulatory landscape for cryptocurrencies remains a significant unknown in many jurisdictions. Unfavorable regulations or enforcement actions targeting Ethereum, DeFi, or staking could negatively impact its price.
3. Technical Resistance Levels: The path to $3,000 is likely to encounter several technical resistance levels where selling pressure might increase. Traders will be closely watching these zones, and failure to break through them decisively could lead to pullbacks.
4. Profit-Taking: As the price of ETH rises, especially after a significant signal like a Golden Cross, traders who bought at lower levels may decide to take profits, creating selling pressure that needs to be absorbed by new buyers for the uptrend to continue.
5. Competition: While Ethereum is the dominant player, it faces ongoing competition from other Layer 1 blockchains (e.g., Solana, Avalanche, BNB Chain) that also aim to offer scalable smart contract platforms. Significant advancements or adoption shifts towards competitors could impact Ethereum's market share and sentiment.
6. The "False Signal" Risk: As mentioned earlier, no technical indicator is perfect. The Golden Cross could prove to be a false signal if broader market conditions turn bearish or if unforeseen negative catalysts emerge.
Conclusion: A Promising Signal, But Prudence is Key
The appearance of a Golden Cross on Ethereum's charts is undeniably a positive development that warrants attention. It provides a technical basis for bullish optimism and could indeed be a contributing factor if ETH is to make a sustained push towards the $3,000 mark. The combination of this signal with Ethereum's strong network fundamentals, ongoing technological advancements, and the deflationary pressures from its tokenomics paints a compelling picture for potential price appreciation.
However, investors should approach this scenario with a balanced perspective. The Golden Cross is a piece of the puzzle, not the entire picture. Its predictive power is enhanced when considered alongside other market indicators, fundamental analysis, and the overall macroeconomic environment. While bulls may feel emboldened by this signal, the path to $3,000 will likely involve navigating volatility, overcoming resistance levels, and contending with potential external shocks.
Ultimately, whether Ethereum can leverage this Golden Cross to reach $3,000 will depend on a confluence of factors: sustained buying momentum, continued positive developments within the Ethereum ecosystem, a favorable broader market sentiment, and the absence of significant negative catalysts. For now, the Golden Cross serves as a beacon of hope for ETH holders, but diligent research, risk management, and an awareness of the inherent uncertainties in the crypto market remain paramount.

#ETH/BTC Update:- This will trigger the real Altseason!The $ETH/BTC chart is making a strong attempt to break above the channel resistance, which aligns with the 100 EMA (the blue line).
Once it breaks above these two levels, it will trigger the real altseason as alt/BTC pairs start to pump. Until then, as long as we stay within this channel, we won’t see an altseason. ETH needs to break this resistance.
I recommend bookmarking this post to stay updated.
Cheers

ETH/USDT – First Support in the Blue BoxETH has been slowing down after its latest push, and the first real area to watch is that blue box below price. It’s where buyers will likely step back in, and a clean reaction there could spark a bigger move—especially if ETH/BTC starts to turn higher at the same time.
What you need before pulling the trigger
• A volume surge that outstrips the prior pullback and aligns with a bullish CDV divergence
• A quick break under the blue box on your one- or five-minute chart followed by a fast reclaim, showing order flow flipped to the buy side
• Genuine buying pressure, not just a wick into the zone
“If the levels suddenly break upwards and do not give a downward break in the low time frame, I will not evaluate it. If they break upwards with volume and give a retest, I will look long.”
Jumping in without those confirmations is the easiest way to get shaken out. But if ETH dips into that box, lights up on volume and CDV, and then retests cleanly on the low timeframe, that’s your signal. With ETH/BTC potentially gearing up to rise too, a solid bounce here could turn into something you don’t want to miss.
📌I keep my charts clean and simple because I believe clarity leads to better decisions.
📌My approach is built on years of experience and a solid track record. I don’t claim to know it all but I’m confident in my ability to spot high-probability setups.
📌If you would like to learn how to use the heatmap, cumulative volume delta and volume footprint techniques that I use below to determine very accurate demand regions, you can send me a private message. I help anyone who wants it completely free of charge.
🔑I have a long list of my proven technique below:
🎯 ZENUSDT.P: Patience & Profitability | %230 Reaction from the Sniper Entry
🐶 DOGEUSDT.P: Next Move
🎨 RENDERUSDT.P: Opportunity of the Month
💎 ETHUSDT.P: Where to Retrace
🟢 BNBUSDT.P: Potential Surge
📊 BTC Dominance: Reaction Zone
🌊 WAVESUSDT.P: Demand Zone Potential
🟣 UNIUSDT.P: Long-Term Trade
🔵 XRPUSDT.P: Entry Zones
🔗 LINKUSDT.P: Follow The River
📈 BTCUSDT.P: Two Key Demand Zones
🟩 POLUSDT: Bullish Momentum
🌟 PENDLEUSDT.P: Where Opportunity Meets Precision
🔥 BTCUSDT.P: Liquidation of Highly Leveraged Longs
🌊 SOLUSDT.P: SOL's Dip - Your Opportunity
🐸 1000PEPEUSDT.P: Prime Bounce Zone Unlocked
🚀 ETHUSDT.P: Set to Explode - Don't Miss This Game Changer
🤖 IQUSDT: Smart Plan
⚡️ PONDUSDT: A Trade Not Taken Is Better Than a Losing One
💼 STMXUSDT: 2 Buying Areas
🐢 TURBOUSDT: Buy Zones and Buyer Presence
🌍 ICPUSDT.P: Massive Upside Potential | Check the Trade Update For Seeing Results
🟠 IDEXUSDT: Spot Buy Area | %26 Profit if You Trade with MSB
📌 USUALUSDT: Buyers Are Active + %70 Profit in Total
🌟 FORTHUSDT: Sniper Entry +%26 Reaction
🐳 QKCUSDT: Sniper Entry +%57 Reaction
📊 BTC.D: Retest of Key Area Highly Likely
📊 XNOUSDT %80 Reaction with a Simple Blue Box!
📊 BELUSDT Amazing %120 Reaction!
📊 Simple Red Box, Extraordinary Results
I stopped adding to the list because it's kinda tiring to add 5-10 charts in every move but you can check my profile and see that it goes on..

#ETH/USDT#ETH
The price is moving in a descending channel on the 1-hour frame and is adhering to it well and is heading to break it strongly upwards and retest it
We have a rebound from the lower limit of the descending channel, this support is at a price of 2000
We have a downtrend on the RSI indicator that is about to break and retest, which supports the rise
We have a trend to stabilize above the moving average 100
Entry price 2117
First target 2211
Second target 2304
Third target 2433

#ETH/USDT#ETH
The price is moving within a descending channel on the 1-hour frame, adhering well to it, and is heading for a strong breakout and retest.
We are seeing a rebound from the lower boundary of the descending channel, which is support at 1815.
We have a downtrend on the RSI indicator that is about to be broken and retested, supporting the upward trend.
We are looking for stability above the 100 Moving Average.
Entry price: 1840
First target: 1860
Second target: 1876
Third target: 1890

Ethereum's $2k Crossroads: Squeeze Up or Crash Down?Ethereum at a Crossroads: Eyeing $2,000 Amidst Short Squeeze Hopes, Crash Warnings, and Existential Questions
Ethereum (ETH), the bedrock of decentralized finance (DeFi) and the engine behind countless non-fungible tokens (NFTs), finds itself ensnared in a complex web of conflicting market signals and divergent analyst opinions. On one hand, recent price action shows resilience, with ETH powering through previous resistance levels and setting its sights on the psychologically significant $2,000 mark. This move is potentially bolstered by intriguing on-chain data, such as declining supply on major exchanges like Binance, sparking whispers of an impending short squeeze. Yet, casting a long shadow over this optimism are stark warnings: technical analysts point to rare, potentially bearish patterns forming, prominent trading firms question its fundamental value proposition compared to Bitcoin (BTC), highlighting its staggering year-to-date losses, and some even provocatively label it more akin to a "memecoin."
This cacophony of bullish hopes and bearish alerts places Ethereum at a critical juncture. Is the recent surge the beginning of a sustained recovery, fueled by tightening supply and renewed developer activity? Or is it merely a deceptive bounce within a larger downtrend, vulnerable to a potential crash as underlying weaknesses and unfavorable comparisons to Bitcoin take hold? Dissecting these opposing narratives is crucial for understanding the intense battleground Ethereum's price chart has become.
The Bullish Ascent: Powering Through Resistance, Eyeing $2,000
The immediate catalyst for renewed optimism stems from Ethereum's recent price performance. After a period of consolidation and, at times, significant downward pressure, ETH has demonstrated notable strength. Headlines proclaiming "Ethereum Price Powers Through Resistance — Eyes on $2,000?" capture this sentiment. Breaking through previously established resistance levels (potentially building on support found around the $1,800 mark) is a technically significant event. It suggests buyers are stepping in with enough conviction to overcome selling pressure that had previously capped advances.
Successfully reclaiming and holding levels above former resistance transforms these zones into potential new support floors, providing a base for further upward movement. The $2,000 level looms large, not just as a round number, but often as a key area of historical price interaction – a zone where significant buying or selling interest has previously materialized. A decisive break above $2,000 could inject further confidence into the market, potentially attracting momentum traders and reinforcing the bullish narrative.
The Binance Supply Drop and Short Squeeze Speculation
Adding intrigue to the bullish case is the observation of declining Ether supply on major exchanges, specifically Binance. Exchange supply is a closely watched metric. When the amount of ETH held on exchanges decreases, it generally implies that investors are withdrawing their coins to private wallets, often for longer-term holding ("HODLing") or for use within the DeFi ecosystem (staking, lending, etc.). This reduction in readily available supply on exchanges can, in theory, create a tighter market.
This dynamic fuels speculation about a potential "short squeeze." A short squeeze occurs when the price of an asset starts to rise rapidly, forcing traders who had bet against it (short sellers) to buy back the asset to close their positions and cut their losses. This forced buying adds further upward pressure on the price, creating a rapid, cascading effect. If a significant number of traders have shorted ETH, anticipating further price declines, a sustained move upwards coupled with shrinking exchange supply could create the conditions for such a squeeze, dramatically accelerating the price towards and potentially beyond the $2,000 target. While short squeezes are relatively rare and difficult to predict accurately, the declining supply on a major platform like Binance certainly adds a compelling element to the bullish thesis.
Underlying Strengths: The Long-Term Vision
Beyond short-term price action and supply dynamics, Ethereum's bulls point to its fundamental strengths. The successful transition to Proof-of-Stake (PoS) via "The Merge" was a monumental technical achievement, drastically reducing the network's energy consumption and changing its tokenomics by potentially making ETH a deflationary asset under certain conditions (where more ETH is "burned" via transaction fees than is issued as staking rewards). Ongoing scalability upgrades, often referred to under the umbrella of Ethereum 2.0 developments (like proto-danksharding via EIP-4844), aim to reduce transaction fees and increase throughput, making the network more efficient and attractive for developers and users.
Ethereum remains the dominant platform for smart contracts, DeFi applications, and NFT marketplaces. Its vast developer community, established network effects, and continuous innovation pipeline are often cited as core long-term value drivers that short-term price volatility cannot erase. For believers in Ethereum's vision, the current price levels, even after the recent bounce, might represent an opportunity to accumulate an asset with significant future potential.
The Bearish Counter-Narrative: Red Alerts and Worrying Comparisons
However, the optimism is heavily tempered by significant bearish signals and critiques. This serves as a stark warning. Technical analysis involves studying chart patterns and indicators to forecast future price movements. While the specific "rare pattern" isn't detailed, the emergence of such signals often causes significant concern among traders. Patterns like head-and-shoulders tops, descending triangles, or bearish divergences on key indicators can suggest that upward momentum is waning and a significant price decline could be imminent. Such technical warnings cannot be easily dismissed, especially when they align with other concerning factors.
The Stark Reality: Underperformance and the "Memecoin" Jab
Perhaps the most damaging critique comes from the direct comparison with Bitcoin and the assessment of Ethereum's recent performance. A large year-to-date drop is a brutal statistic, especially when Bitcoin, while also volatile, may have fared comparatively better during the same period (depending on the exact timeframe and BTC's own fluctuations).
Why the "memecoin" comparison? Memecoins are typically characterized by extreme volatility, price movements driven largely by social media hype and sentiment rather than clear fundamental value, and a lack of a distinct, widely accepted use case beyond speculation. While some calling Ethereum a memecoin is hyperbolic – given its vast ecosystem and utility – the critique likely stems from its recent high volatility and its struggle to maintain value relative to Bitcoin. The trading firm's assertion that Ether's "risk-reward is now unjustifiable compared to Bitcoin" encapsulates this view. They likely argue that Bitcoin's clearer narrative as a potential store of value or "digital gold," potentially bolstered by institutional adoption via ETFs, offers a more compelling investment case with potentially less downside risk compared to Ethereum, which faces ongoing scalability challenges, competition from other Layer 1 blockchains, and perhaps greater regulatory uncertainty regarding its status (security vs. commodity).
This underperformance raises difficult questions. If Ethereum is the backbone of Web3, why has its price struggled so much relative to its peers or even its own potential? Possible contributing factors include:
1. Capital Rotation: The excitement and capital inflows surrounding spot Bitcoin ETFs may have drawn investment away from Ethereum and other altcoins.
2. Regulatory Uncertainty: Ongoing debates, particularly in the US, about whether ETH should be classified as a security could be creating hesitancy among institutional investors.
3. Competition: Numerous alternative Layer 1 blockchains (Solana, Avalanche, etc.) are competing fiercely for developers and users, potentially fragmenting the market share Ethereum once dominated.
4. Post-Merge Narrative Shift: While technically successful, the immediate post-Merge price action was underwhelming for many, and the narrative focus may have shifted elsewhere.
Synthesizing the Dichotomy: A Market Divided
Ethereum's current situation is a textbook example of a market grappling with deeply conflicting data points and narratives.
• Bullish Signals: Price breaking resistance, targeting $2k, falling exchange supply, potential short squeeze, ongoing network development, strong ecosystem.
• Bearish Signals: Severe YTD underperformance, concerning technical patterns ("red alert"), critical comparisons to Bitcoin's risk/reward, being labeled "memecoin-like" by traders, regulatory overhang, Layer 1 competition.
This dichotomy creates significant uncertainty. Is the falling supply on Binance a sign of HODLer conviction paving the way for a short squeeze, or simply users moving assets to DeFi protocols, with little bearing on immediate price direction? Is the push towards $2,000 the start of a real trend reversal, or a bull trap set by bearish technical patterns? Is Ethereum's fundamental value being overlooked amidst short-term noise, or are the critiques about its risk/reward profile relative to Bitcoin valid warnings?
Investor Sentiment and Key Factors to Watch
This environment fosters polarized investor sentiment. Optimists see a buying opportunity, focusing on the recent strength and long-term potential. Pessimists see confirmation of underlying weakness and prepare for further declines. The path forward will likely be determined by several key factors:
1. Bitcoin's Trajectory: As the market leader, Bitcoin's price action heavily influences the broader crypto market, including Ethereum. Continued strength in BTC could provide a tailwind for ETH.
2. Technical Levels: Whether ETH can decisively breach and hold $2,000, or if it gets rejected, will be a critical short-term indicator. Equally important is whether current support levels hold during any pullbacks.
3. Exchange Flows & On-Chain Data: Continued monitoring of exchange supply, staking activity, and transaction volumes will provide clues about investor behavior.
4. Regulatory Developments: Any clarification on Ethereum's regulatory status, particularly in the US, could significantly impact sentiment.
5. Macroeconomic Environment: Broader market risk appetite, influenced by inflation, interest rates, and economic growth prospects, will continue to play a role.
Conclusion: Navigating Ethereum's Uncertain Path
Ethereum stands at a precarious crossroads. The recent climb towards $2,000, supported by encouraging signs like falling exchange supply, offers a glimmer of hope for bulls anticipating a recovery and perhaps even a short squeeze. However, this optimism is aggressively challenged by alarming technical warnings, significant underperformance compared to market expectations and Bitcoin, and pointed critiques questioning its current investment viability.
The "memecoin" comparison, while harsh, reflects a genuine frustration and concern among some market observers about ETH's volatility and perceived lack of decisive direction relative to the "digital gold" narrative solidifying around Bitcoin. The formation of rare bearish patterns adds a layer of technical urgency to these concerns.
Ultimately, the market remains deeply divided on Ethereum's immediate future. The battle between the potential for a supply-driven squeeze towards $2,000 and the risk of a pattern-induced crash is palpable. Investors must weigh the platform's undeniable long-term technological significance and ecosystem strength against the immediate headwinds of poor recent performance, regulatory ambiguity, and concerning technical signals. The coming weeks are likely to be crucial in determining whether Ethereum can overcome the prevailing skepticism and validate the recent bullish momentum, or if the bears will regain control, confirming the warnings of a continued downturn. The price action around the $2,000 level will be a key battleground in this ongoing struggle.
Disclaimer: The information presented in this article is for informational and educational purposes only. It is based on the analysis of the provided headlines and general market knowledge. It does not constitute financial advice. Investing in cryptocurrencies involves significant risk, including the potential loss of principal. Readers should conduct their own thorough research and consult with a qualified financial advisor before making any investment decisions.

Ethereum CME Gaps: Inevitable Fill Zones Ahead Chart shows the daily Ethereum (ETH) futures on CME, highlighting three significant CME futures gaps—areas where price jumped due to the weekend market closure. These gaps are key zones where price has historically returned to “fill” the missing trading activity.
Gap 1 at $1,770 is the most recent and closest to the current price of $1,477, suggesting a possible short-term bullish move.
Gap 2 at $2,630 and
Gap 3 at $3,290 are higher up and reflect unfilled areas from previous market drops.
ETH is currently trading below all three gaps, creating a strong technical case for future upward movement. Sooner or later, these gaps will get filled. 🧘♀️

#ETH/USDT#ETH
The price is moving within a descending channel on the 1-hour frame, adhering well to it, and is heading for a strong breakout and retest.
We are seeing a rebound from the lower boundary of the descending channel, which is support at 1555.
We have a downtrend on the RSI indicator that is about to be broken and retested, supporting the upward trend.
We are looking for stability above the 100 moving average.
Entry price: 1591
First target: 1628
Second target: 1658
Third target: 1695
