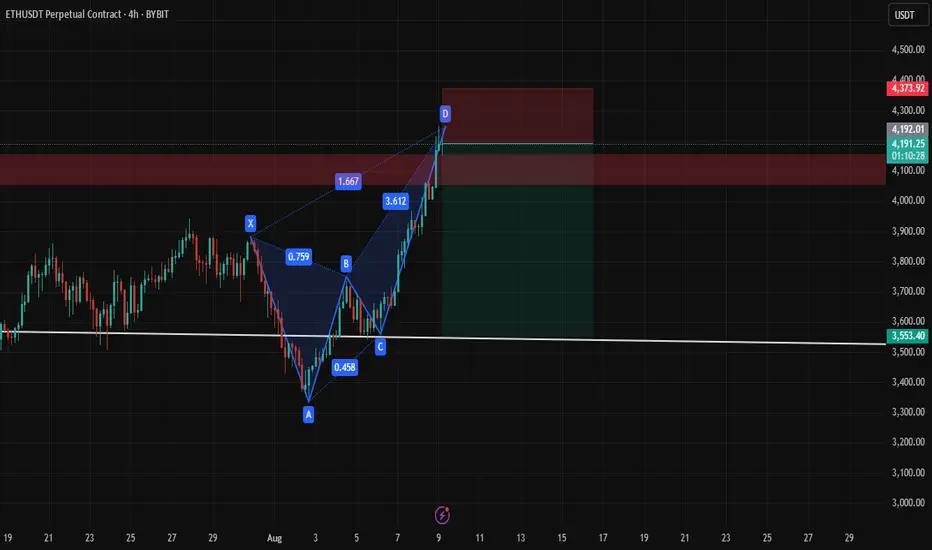
Eth Short Bearish Butterfly The Bearish Butterfly setup with price levels:
📍 Entry
Around point D, which looks close to $4,186–$4,190.
🛑 Stop Loss (SL)
Safest SL: Above 1.27 XA extension (slightly beyond D) → around $4,230–$4,240.
Conservative SL: Just above 1.618 XA extension (~$4,255).
🎯 Take Profits (TP)
We use Fibonacci retracements from the AD leg for targets:
TP1: 38.2% retracement of AD → ~$3,960
TP2: 61.8% retracement of AD → ~$3,800
TP3: Full retrace to point B area (~$3,700)
Ethshort
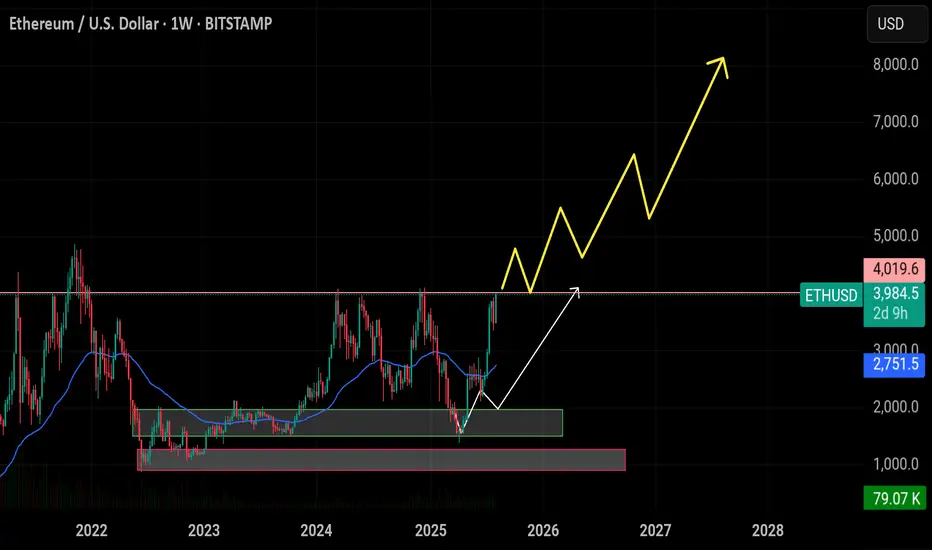
$ETH/USDT Breakout Analysis 1W Chart: Ethereum $ETH/USDT Breakout Analysis 1W Chart:
ETH has successfully reached the $4,000 breakout level, completing our first major target from the accumulation zone ($1,500–$1,900). Price is currently testing the critical $4,000 resistance. If ETH can close a weekly candle above this level and hold, it will confirm a strong continuation structure — potentially targeting $5,000, $7,000, and up to $8,000 in the coming months.
🔸 Support LEVEL: $3,500 is now the key weekly support zone. This level aligns with previous resistance and structure, offering a strong base for bullish continuation. If ETH holds $4,000+ weekly, $3,500 becomes a high-conviction re-entry zone.
🔸 Upside Target: Upon confirmation above $4,000, ETH could rally toward $5,000 short-term, with extended targets at $7,000 and $8,000 if momentum continues.
🔸 Risk Level at $3,500: A weekly close below $4,000 followed by a drop under $3,500 would invalidate the breakout. This could signal a failed breakout and return to range. High risk zone opens below $3,200.
🔸 Watch for Retest ZONE: Look for a healthy retest of the $3,900–$4,000 zone. If ETH pulls back and holds this zone on weekly, it offers a strong entry with targets toward $5,000 and above.
ETH-----Sell around 3905, target 3850 areaAugust 8th ETH Contract Technical Analysis:
Today, the long-term daily chart closed with a small bullish candlestick pattern, with consecutive bullish candlestick patterns and a single bearish candlestick pattern. The price is above the moving average, and the accompanying indicator shows a death cross with shrinking volume. The overall upward trend is very clear, but the current price is deviating from the moving average, so traders should be aware of the risk of a large pullback. There are also news and data stimuli. The short-term hourly chart shows a pattern of oscillating upward movement, with prices continuing to break higher. The more such a trend is, the more we need to pay attention to the support level of the pullback. This is crucial. Many friends want to sell, and that's fine, but you must not be greedy. Only short-term trading is necessary. If you can't do it, don't do it. Currently, the price is under pressure, with consecutive bearish candlestick patterns and the accompanying indicator showing a downward death cross. A pullback is also important for the day.
Today's ETH Short-Term Contract Trading Strategy:
Sell at the current price of 3905, with a stop loss at 3935 and a target of 3850.


ETH/USD Analysis – Smart Money Breakdown ETH/USD Analysis – Smart Money Breakdown & Rejection from Premium Zone
🔍 Key Breakdown:
✅ BOS (Break of Structure): The initial BOS on July 15 signaled a strong bullish shift in market structure, triggering a sustained upside rally.
💪 Strong Bullish Rebound: After the BOS, ETH experienced impulsive buying, confirming institutional order flow and liquidity injection.
🔺 Resistance Zone (Premium Area): The price formed a clear TOP at the resistance (near $3,950–$4,000), a common zone where smart money distributes positions.
📉 Reaction from Resistance: As ETH tapped into the resistance, price sharply rejected — a potential mitigation move or distribution phase.
⚠️ Current Price Structure: After the correction, ETH is retracing back into the resistance zone. The projected arrow indicates a possible lower high formation, followed by a continuation to the support zone ($3,300–$3,400).
🧠 Educational Takeaways:
Structure Is King: Market structure (HHs, HLs, BOS) is the foundation of SMC-based trading.
Premium vs. Discount Zones: Smart money sells in premium (resistance) and buys in discount (support).
Liquidity Reversal: Tops often trap late buyers before a reversal — watch for liquidity grabs at key zones.
Wait for Confirmation: Always wait for confirmation (candlestick or structure shift) before entering trades.
🎯 Potential Scenarios:
✅ Bearish Case: ETH forms a lower high and drops to support (~$3,350).
❌ Invalidation: Clean breakout and hold above $4,000 could open doors for further bullish continuation.

ETH/USDT Bearish Setup – Rising Wedge Breakdown & RetestEthereum (ETH/USDT) has broken down from a rising wedge — a classic bearish pattern — and is now showing signs of rejection after a clean retest of the broken trendline around $3,679.
Structure:
Rising wedge pattern on the higher timeframe
Breakdown confirmed with retest of lower trendline as resistance
No bullish follow-through after retest
Trade Plan:
Bias: Bearish below $3,680
Entry Zone: Anywhere below $3,670–3,680 if rejection is confirmed
Stop Loss: Above $3,720 (invalidation)
Targets:
Target 1: $3,298
Target 2: $2,880
Target 3: $2,640
Key Notes:
If ETH reclaims and holds above $3,680, the setup gets invalidated
Watch BTC behavior — ETH tends to follow
Volume shows no strength from bulls post-breakdown
This setup presents a high-risk, high-reward opportunity if the price continues to decline from this zone.
Conclusion:
Stay cautious, as the market could see more downside if ETH stays below $3,680. Manage risk accordingly.
DYOR | Not Financial Advice

ETH-----Sell around 3670, target 3600 areaAugust 5th ETH Contract Technical Analysis:
Today, the daily chart closed with a small bullish candlestick pattern, with consecutive bullish candlesticks and prices consolidating at high levels. The accompanying indicator formed a death cross. The price did not break through the previous high on the pullback, so the overall downtrend is still favorable. However, it should be noted that yesterday's pullback interrupted the ongoing downward trend, so this is important to note. The hourly chart showed continued gains during the European and American sessions, while prices came under downward pressure during the Asian morning session. The current candlestick pattern is a series of bearish candlesticks, with the accompanying indicator forming a downward death cross. This suggests a continued upward trend within the next few days, but the strength and impact of the European session remain important to monitor.
Today's ETH Short-Term Contract Trading Strategy:
Sell on pullbacks to the 3670 area, with a stop loss at 3700 and a target at 3600.

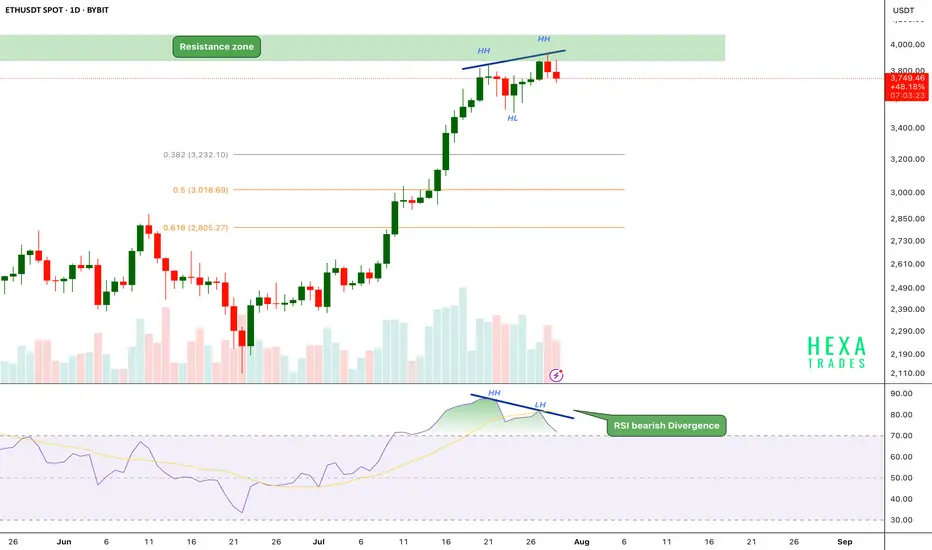
ETH Bearish Divergence!CRYPTOCAP:ETH has been in a strong uptrend, printing consistent higher highs (HH) and higher lows (HL). However, on the daily chart, the price has now reached a critical resistance zone near the $3,800–$4,000 range.
Key Points:
🔸 Bearish RSI Divergence
While price action has formed a new higher high, the RSI has printed a lower high, signaling bearish divergence.
This indicates that upward momentum is weakening even as price attempts to push higher — a common early warning of a possible short-term reversal.
🔸 Fibonacci Retracement Levels
The fib 0.382 at $3240 and 0.5 and 0.618 retracement levels are sitting around $3,000 and $2,800, respectively, potential targets if a correction follows.
🔸 Volume Profile
Volume is gradually declining as price approaches resistance, suggesting buyer exhaustion.
If the price breaks above the $4,000 psychological resistance, we could see a strong bullish move.
ETH is facing strong resistance after a powerful rally, with RSI bearish divergence and weakening momentum hinting at a possible short-term pullback. We should be cautious entering fresh longs here without confirmation.
Support: $3,200, $3,000, and $2,800
Cheers
Hexa
BINANCE:ETHUSDT BITSTAMP:ETHUSD
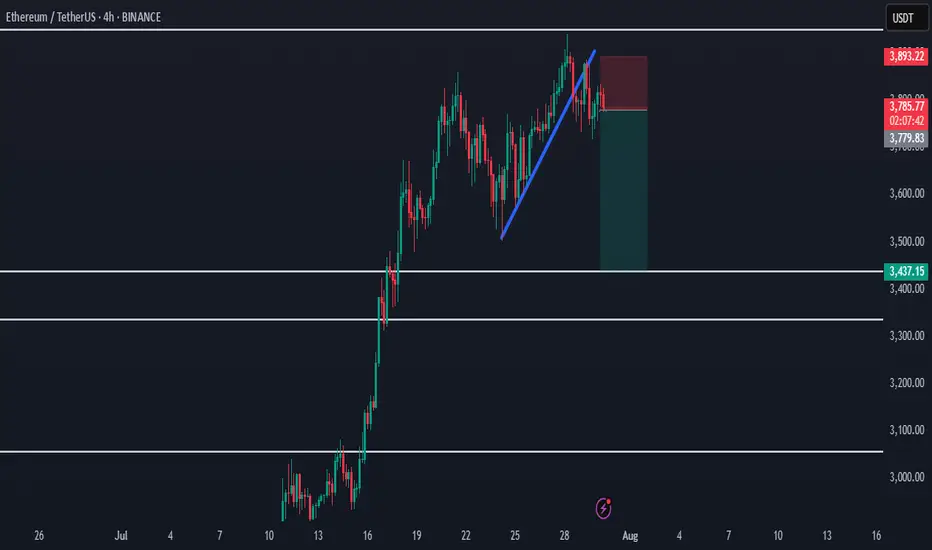
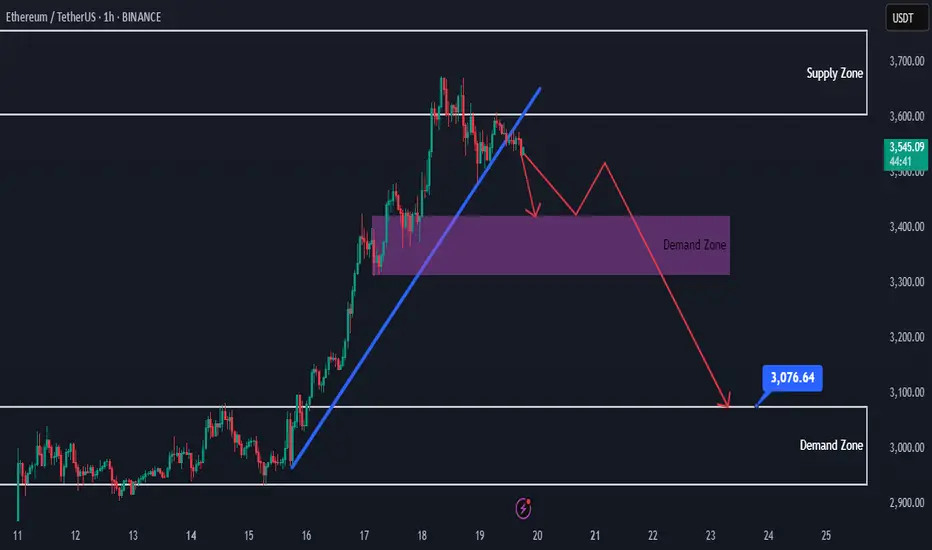
Ethereum Rejected from Supply - Bearish Shift in ProgressHello everybody!
Price has been rejected from a supply area.
The bullish trend has slowed down, and the market structure is slightly shifting bearish.
A polished upward trendline has been broken on the 1H timeframe.
We’re aiming for a target around the first untouched demand zone: 3437.
Manage your risk and trade safe!
ETH Approaching Major Resistance – Expecting Pullback Hello guys!
Ethereum has been rallying strongly within a well-respected ascending channel, pushing past key levels and now approaching a major resistance zone around $3,900–$4,000.
According to the chart structure, it looks like price could soon react from this resistance, leading to a pullback into the $3,000–$3,200 demand zone, which aligns with the midline of the channel.
This would be a healthy correction before potentially continuing the bullish trend and attempting a clean breakout toward new highs.
ETH is still bullish, but it may need to retest support before continuation.
Watch for a bounce from the $3,000–$3,200 zone for a high-probability long opportunity.

ETHUSDT.PIf you look at the chart, you will notice an uptrend that has somewhat lost its strength and we may not be able to hit higher highs like the next strength in the next move.
Support: 3.660 - 3.590 - 3.160
Resistance: 3.900 - 4.260
Entry: 3.700
SL: 3.500
TP: 4.240
Please control risk management.⚠️

ETH is at a critical inflection pointETH 4H – Decision Time 🧠🐂🐻
Ethereum’s dancing on the edge of a blade.
📍 Entry: $3,778 (Short)
🧪 Next Add: Tiny at $3,906 (updated)
🚨 Major Add: Above $4,100 (TBD)
⚠️TP 1: $3,677 (updated)
We’ve broken the downtrend line — bullish on paper — but ETH is stalling right near resistance at $3,875. If bulls don’t show up with volume and conviction, this move fizzles out fast.
Here’s the playbook:
🔸 $3,875 = key battle zone
— Reclaim it clean (4H close + volume) = "short-term" bear bias invalid (◘reread◘)
— Failure = likely drop to $3,677 → $3,588
🔸 $3,720 = swing short confirmation if broken
🧩 If bulls win $3,875, I keep the short but hedge with a long. Because if the herd’s charging uphill, they might lead us to gra$$.
Momentum is king. No follow-through = fakeout top.
Let the chart breathe.
LOW LEVERAGE POR FAVOR!
Stay Sharp. Stay nimble. 🎯
100% not financial advice, for edutainment purposes only!

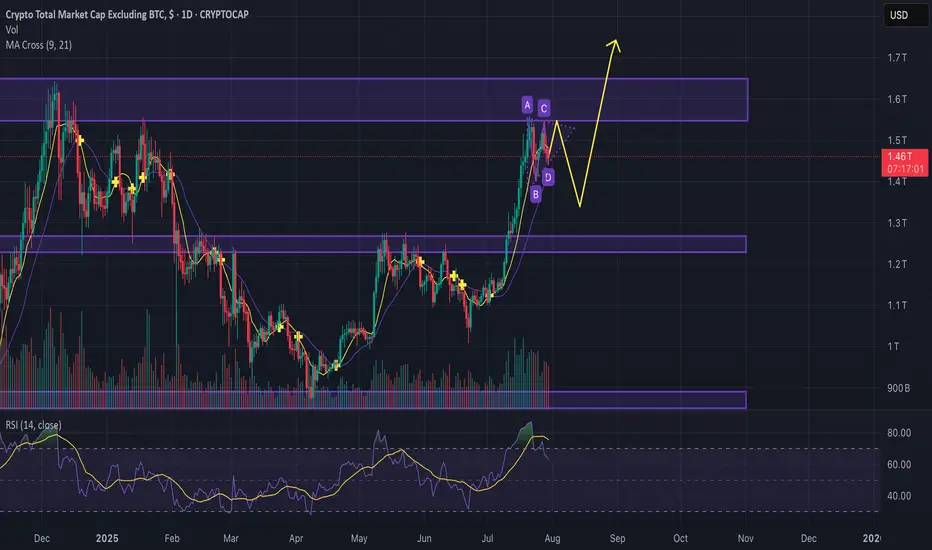
Is altcoin season over before it even started?Guys,
Gonna break down the situation on the chart to see where we can go next with the altcoins.
We see the key resistance levels and now we moving in kinda bullish pennant, but considering descending volumes we can easily test the support line and go back to the 1.25T. (maybe even lower)
After that, seems like we can try to go back and break the 1.64T resistance zone and previous ATH.
Anyway current market is going to be way more different from previous cycles, because huge institutions can feel nice only in hyper volatile, so divide your strategy between short, mid and long term investments to take profits.
Good trades and share your thoughts down to see what others think.
ETH - Bounce Zones - Nears the End for BULLSHello Fello's ☕
I'm watching Ethereum today and I believe it may be very close to the end of it's bullish cycle.
I think what could become likely is an extended altseason, where Bitcoin trades around the same price for some time, and Ethereum increases slightly. Afterwhich smaller altcoins (by marketcap) make random rallies before the beginning of a bearish cycle (which is due, see my previous BTC update).
There's an interesting channel here that previously determined bounce zones... I don't believe the channel itself will hold as much value going down, but this zone may be a likely bounce zone - around $3k.
Key bounce zones to watch include:
I'm not saying it will be this straightforward, but this image demonstrates the power of bounce zones for swing trades:
Next update will be when we've lost the first support zone.
Until then!
#ETH/USDT SETUP ,Bought From $4003#ETH
The price is moving within an ascending channel on the 1-hour frame, adhering well to it, and is on track to break it strongly upwards and retest it.
We have support from the lower boundary of the ascending channel, at 3700.
We have a downtrend on the RSI indicator that is about to break and retest, supporting the upside.
There is a major support area in green at 3711, which represents a strong basis for the upside.
Don't forget a simple thing: ease and capital.
When you reach the first target, save some money and then change your stop-loss order to an entry order.
For inquiries, please leave a comment.
We have a trend to hold above the 100 Moving Average.
Entry price: 3811.
First target: 3867.
Second target: 3936.
Third target: 4003.
Don't forget a simple thing: ease and capital.
When you reach your first target, save some money and then change your stop-loss order to an entry order.
For inquiries, please leave a comment.
Thank you.

#ETH/USDT SETUP ,Bought From $3696#ETH
The price is moving within a descending channel on the 1-hour frame, adhering well to it, and is on its way to breaking strongly upwards and retesting it.
We have support from the lower boundary of the descending channel at 3640.
We have a downtrend on the RSI indicator that is about to be broken and retested, supporting the upside.
There is a major support area in green at 3600, which represents a strong basis for the upside.
Don't forget a simple thing: ease and capital.
When you reach the first target, save some money and then change your stop-loss order to an entry order.
For inquiries, please leave a comment.
We have a trend to hold above the Moving Average 100.
Entry price: 3696.
First target: 3764.
Second target: 3826.
Third target: 3904.
Don't forget a simple thing: ease and capital.
When you reach your first target, save some money and then change your stop-loss order to an entry order.
For inquiries, please leave a comment.
Thank you.

Ethereum at Key Supply — Short-Term Sell OpportunityHello everybody!
Ethereum has reached a strong supply/resistance area in the daily timeframe.
As we see on the chart, lower highs have started to forming.
In addition to that, an upward trendline has been broken.
Keeping in mind that overall trend is bullish, we can look to short time sell positions here.
The first target can be 3300-3400.
If the price breaks below 3300, we can expect it to go lower toward 3100 area.
Manage your risk and trade safe!
ETH to $3700 Before a Major Bounce?Ethereum has been showing signs of exhaustion after its recent rally. I'm watching the $3700 level closely — it's a key support zone that has acted as both resistance and support in the past.
🟦 If ETH pulls back to this area, I expect it to find strong buying interest, potentially leading to a significant bounce and continuation of the bullish trend.
📌 Scenario I'm Watching:
🔻 Pullback to the $3700 support zone
📉 Shakeout or stop hunt below previous lows
💚 Followed by a strong bullish reversal — possible move toward $4000+
Why $3700?
Confluence of previous highs/lows
Psychological round number
Potential liquidity pocket
Not Financial Advice!
This is a scenario I'm tracking, not a guarantee. As always, wait for confirmation (e.g. bullish engulfing, RSI divergence, volume spike) before jumping in.
📉 If $3700 fails decisively, I'll reassess — next support likely around $3550–3600.

ETH-----Sell around 3690, target 3615 areaTechnical analysis of ETH contract on July 25:
Today, the large-cycle daily level closed with a small positive line yesterday, the K-line pattern was single negative and single positive, the price was at a high level, and the attached indicator was golden cross and running with shrinking volume. From the big trend, the current trend is in a weak trend, the price rebound is not strong and has not continued, the trend is prone to fall under pressure and test the low point downward, so the trend has changed; the short-cycle hourly chart yesterday hit a high in the US market and fell under pressure in the Asian morning. The current K-line pattern is continuous negative, the price is at a low level, and the attached indicator is dead cross running. It is highly likely that the decline will continue during the day. Yesterday's low point of 3500 is the position that needs to be paid attention to today. The current hourly chart resistance is near the 3695 area.
Today's ETH short-term contract trading strategy:
Sell in the 3690 area after the rebound, stop loss in the 3720 area, and target the 3615 area;

ETH Just Lost Key Support — Next Stop: $2,879?Ethereum (ETH) appears to be losing steam on the 4-hour chart as it fails to sustain above the critical $3,860 resistance level. After a strong rally, the price structure has started showing signs of exhaustion — the previous bullish momentum has clearly stalled, and ETH is now forming lower highs and lower lows. This breakdown marks a potential shift in trend, especially considering the clean rejection from $3,860 with several upper-wick rejections signaling aggressive selling pressure.
The green ascending trendline, which supported ETH throughout its recent rally, has been breached. Price has broken below the trendline and is now moving in a declining structure highlighted by the recent bearish wave. Sellers have stepped in, and the most recent candles indicate a bearish continuation setup forming just below a failed support-turned-resistance near $3,533.
There’s a visible trade setup taking shape:
• Entry: $3,530–$3,550 (post-retest of broken trend support)
• Stop-loss: $3,650 (above recent local highs)
• Target 1: $3,200 (key support level)
• Target 2: $2,879
• Target 3 (extended): $2,635 if downside pressure intensifies
This short setup offers a solid risk-reward ratio, especially if momentum accelerates below $3,500. The sell signal seen earlier aligns with this potential reversal zone, and unless ETH reclaims $3,650 with volume, the bears look likely to stay in control.
In summary, ETH on the 4H timeframe is now trading below major support, with a bearish structure, trendline breakdown, and rejection at resistance — all aligning for a short-biased move in the coming sessions. Any bullish invalidation would require ETH to push and close above $3,650 convincingly. Until then, the path of least resistance appears downward.

Ethereum Breakout Could Spark the Next Altseason!A Massive Altseason Is Brewing… 🚀
Ethereum just flashed a major monthly breakout after printing a clean Morning Star reversal right at key support.
Now it's pushing against the upper resistance zone, a structure that held it back for over two years.
If CRYPTOCAP:ETH breaks and closes above this level, it won’t just be bullish for Ethereum — it could ignite the biggest altcoin season since 2021.
Why it matters:
📌 ETH is the heart of the altcoin ecosystem.
📌Historical breakouts like this led to 1500%+ moves.
📌The pattern and price action are lining up perfectly again.
Once Ethereum breaks cleanly above $4,000, expect altcoins to explode across the board — Layer 2s, DeFi, AI tokens, and even the meme coins could all start flying.
Keep your eyes on ETH. Its breakout is the spark… the altseason fire is coming.
DYOR | Not Financial Advice

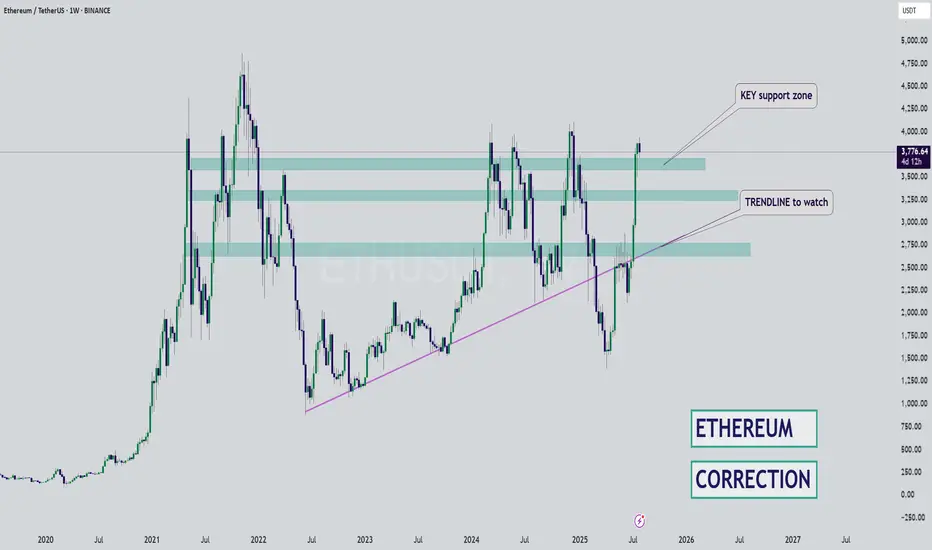
ETH/USDT – Weekly Chart Analysis !! ETH/USDT – Weekly Chart Analysis
ETH is testing a major historical resistance between $3,700 – $4,000 (highlighted green zone).
A clean breakout above this level could push price toward the next key resistance at ~$4,660.
Previous accumulation zone around $2,400 – $2,800 (yellow box) now acts as strong support.
Long-term floor at $1,420 and $1,025, though currently far below.
Bullish Breakout Potential: If ETH sustains above the green resistance, it may retest $4,660+.
A failure to break above $4K could lead to a healthy pullback toward the yellow zone (~$2,800).
Stay updated and manage your risk accordingly.
DYOR | NFA

ETH-----Sell around 3680, target 3650-3630 areaTechnical analysis of ETH contract on July 22:
Today, the large-cycle daily level closed with a small positive line yesterday, the K-line pattern continued to rise, the price was above the moving average, and the attached indicator was running in a golden cross. The overall upward trend was still very obvious, and yesterday's decline can be regarded as a correction based on the current trend. The price just returned to the support of the moving average, and the strong support position was near the 3630 area; the short-cycle hourly chart currently has a continuous negative K-line pattern, the price is below the moving average, and the attached indicator is running in a dead cross, so let's look at the retracement trend during the day, and pay attention to the 3630 area below the support.
Today's ETH short-term contract trading strategy:
The current price is 3680, short, stop loss in the 3745 area, and the target is the 3650-3630 area;
