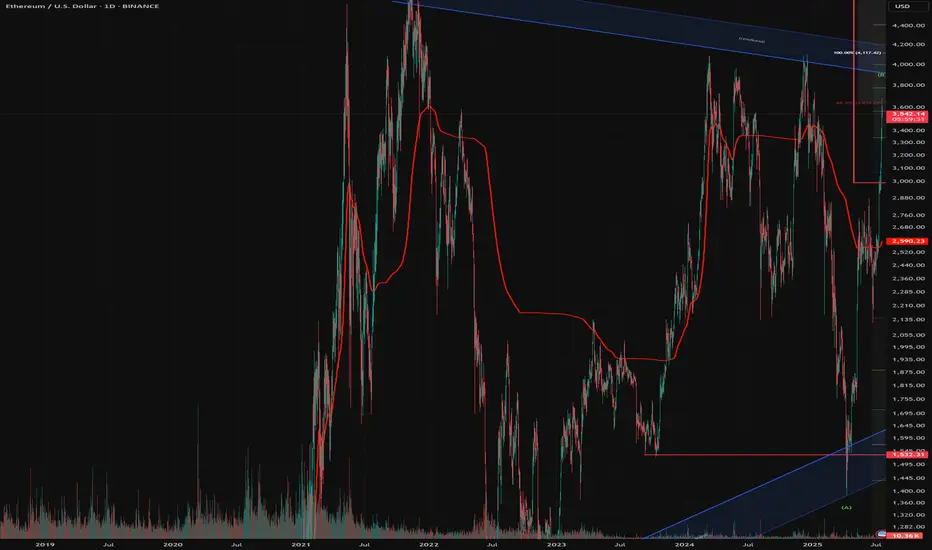
Ethereum is going to 2000 then new ATH
Alright, let's talk about what I see coming for Ethereum. I’ve been deep-diving into these charts, especially that weekly one where I’ve highlighted the past moves and percentages. I'm using these patterns as a guide to try and anticipate where Ethereum is heading next. I'm going to set aside any kind of trading advice, and focus on what I see the market doing next.
Key Observations From Past Cycles
Looking at Ethereum's history, I’m seeing a pretty clear cycle of large price swings:
Massive Rallies: Ethereum has a history of powerful bull runs, where the price can surge by hundreds, or even thousands of percent. I need to be aware of these to understand the potential of the coin.
Substantial Corrections: These rallies are always followed by substantial corrections, which range from about 30%, to upwards of 80%. This is important to see as any retracement can be devastating to a trader.
My Prediction For The Next Move:
Based on those historical patterns, here’s what I see as the most probable outcome for Ethereum's next move:
Anticipated Retracement: I’m expecting a retracement, or a pullback following the recent gains. Ethereum tends to make large retracements after a period of growth, and I am anticipating this will happen again soon. I want to see the price find a solid level of support, as this will be important to the next move up. Based on historical price action, I expect the next support levels to be somewhere around $2000 to $2500.
The Next Upside Move: After that pullback, I anticipate a strong upside move.
The magnitude of this move is unclear, but the data on the chart shows we could be looking at a move upwards of 100%, and maybe even more. I want to be watching that very carefully when it happens.
Ethshort

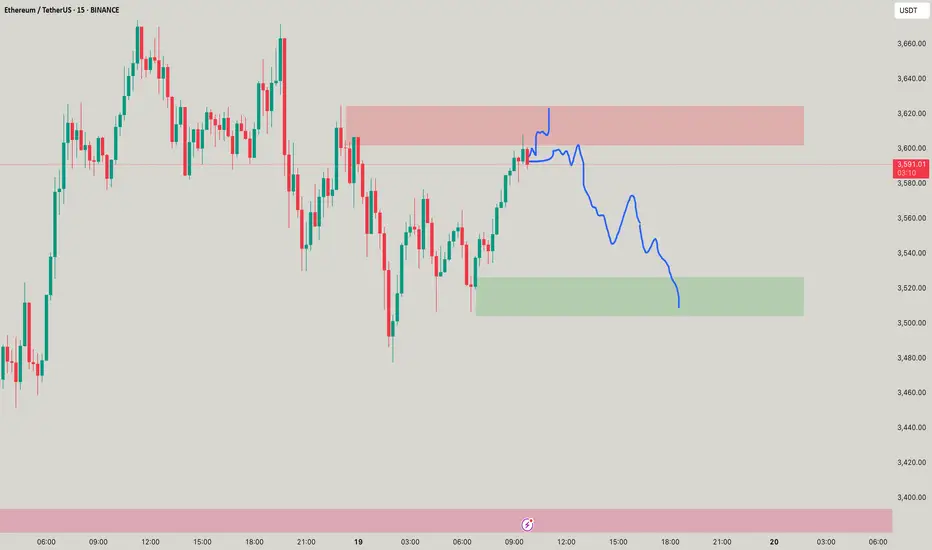
ETHUSDT | Two Opportunities. One Smart Approach.I’ve been closely watching how buyers behave under the green line — and they’re clearly not backing down. But what really catches my eye is the blue box , a clean demand zone I’ve seen act as a launchpad in the past.
You don’t need to jump in blindly.
Depending on your risk appetite, both levels are valid. But if you wait for a 15-minute breakout confirmation on the low timeframe before acting on either, your odds of success increase significantly.
This is how I keep my win rate high, waiting for the market to prove itself first.
“I will not insist on my short idea. If the levels suddenly break upwards and do not give a downward break in the low time frame, I will not evaluate it. If they break upwards with volume and give a retest, I will look long.”
Most traders rush in. You wait smart. That’s the edge.
Choose wisely. Follow closely.
📌I keep my charts clean and simple because I believe clarity leads to better decisions.
📌My approach is built on years of experience and a solid track record. I don’t claim to know it all but I’m confident in my ability to spot high-probability setups.
📌If you would like to learn how to use the heatmap, cumulative volume delta and volume footprint techniques that I use below to determine very accurate demand regions, you can send me a private message. I help anyone who wants it completely free of charge.
🔑I have a long list of my proven technique below:
🎯 ZENUSDT.P: Patience & Profitability | %230 Reaction from the Sniper Entry
🐶 DOGEUSDT.P: Next Move
🎨 RENDERUSDT.P: Opportunity of the Month
💎 ETHUSDT.P: Where to Retrace
🟢 BNBUSDT.P: Potential Surge
📊 BTC Dominance: Reaction Zone
🌊 WAVESUSDT.P: Demand Zone Potential
🟣 UNIUSDT.P: Long-Term Trade
🔵 XRPUSDT.P: Entry Zones
🔗 LINKUSDT.P: Follow The River
📈 BTCUSDT.P: Two Key Demand Zones
🟩 POLUSDT: Bullish Momentum
🌟 PENDLEUSDT.P: Where Opportunity Meets Precision
🔥 BTCUSDT.P: Liquidation of Highly Leveraged Longs
🌊 SOLUSDT.P: SOL's Dip - Your Opportunity
🐸 1000PEPEUSDT.P: Prime Bounce Zone Unlocked
🚀 ETHUSDT.P: Set to Explode - Don't Miss This Game Changer
🤖 IQUSDT: Smart Plan
⚡️ PONDUSDT: A Trade Not Taken Is Better Than a Losing One
💼 STMXUSDT: 2 Buying Areas
🐢 TURBOUSDT: Buy Zones and Buyer Presence
🌍 ICPUSDT.P: Massive Upside Potential | Check the Trade Update For Seeing Results
🟠 IDEXUSDT: Spot Buy Area | %26 Profit if You Trade with MSB
📌 USUALUSDT: Buyers Are Active + %70 Profit in Total
🌟 FORTHUSDT: Sniper Entry +%26 Reaction
🐳 QKCUSDT: Sniper Entry +%57 Reaction
📊 BTC.D: Retest of Key Area Highly Likely
📊 XNOUSDT %80 Reaction with a Simple Blue Box!
📊 BELUSDT Amazing %120 Reaction!
📊 Simple Red Box, Extraordinary Results
I stopped adding to the list because it's kinda tiring to add 5-10 charts in every move but you can check my profile and see that it goes on..

MY VIEW ON ETH - BULLISH & BEARISHMy analysis of Ethereum (ETH): Bullish and bearish scenario
The analysis of Ethereum is currently quite complex. The price structure does not show clear impulses in the form of classic wave movements, but frequently overlapping patterns that indicate ABC correction waves.
I therefore present both my primary and an alternative scenario for a bullish (rising) and a bearish (falling) trend.
Primary bullish scenario:
Wave 2 seems to be completed at the lower end of the blue trend channel and at the 70.70-% FiB. We could currently be in red wave 3. However, the structure of this movement is more reminiscent of an ABC formation, which could indicate a weaker impulse.
Should the price break through the upper edge of the blue trend channel and exceed the 100% Fibonacci level at around USD 4,424, several important Fibonacci zones would converge in the “profit area” marked in red. In this case, a setback as part of the red wave 4 could not be ruled out.
Alternative (bearish) scenario:
It is possible that the blue V-wave could turn into a white ABC structure. In this case, an additional wave 4 would be omitted, which could result in a stronger sell-off.
Secondary scenario - bearish:
If Ethereum fails to play out the primary bullish count scenario, I expect that we will continue to be in an overarching correction phase. This assessment also fits in with the typical market slowdown during the summer months.
In this case, a green ABC correction could form, whereby wave C could theoretically still rise to the 100% Fibonacci level at USD 4,416. However, this would be an overextended wave B.
In addition, we are already in the area of the sales or profit zone, which indicates that only a limited rise is possible.
Subsequently, I expect a stronger downward movement towards the green buy area between the 1.618 Fibonacci level and around USD 1,866.
LEAVE YOUR COMMENTS AND ASSESSMENT
ETHUSDTThis movement downtrend. If breake 2.790 movr to 3.500$ but breke 2.200 move trend to 1.500$.

You need smol Scalps for ETH!ETH SMOL scalps but u know it takes your liquidity on top blowing ur accounf! Keep mindful where the trade goes! good short oppurtunity!
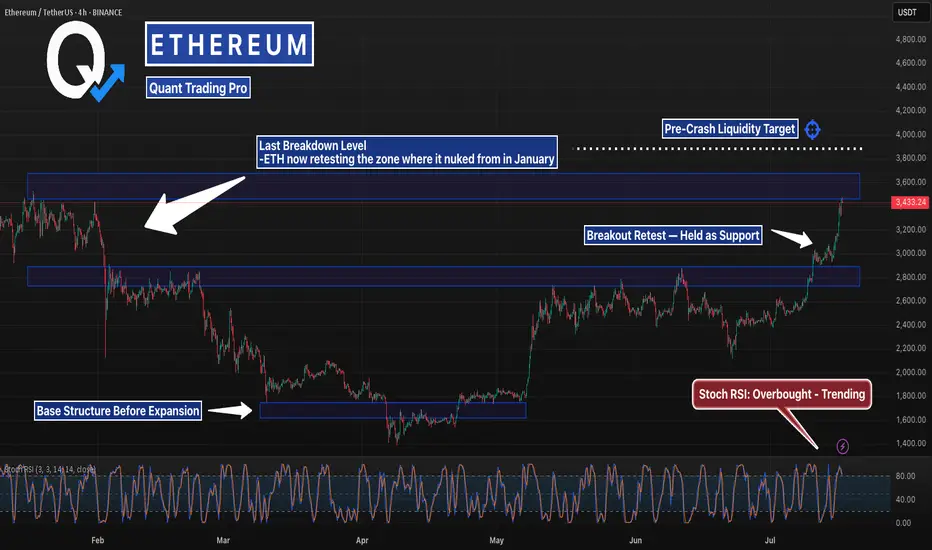
This Level Crashed ETH Last Time… It’s BackETH just blasted back into the same zone it collapsed from in January — but this time the structure underneath is stronger, tighter, and holding.
Stoch RSI is stretched, but bullish momentum remains intact. If it clears $3,870, lights out.
#Ethereum #ETHUSD #CryptoCharts #BreakoutLevels #ChartAnalysis #TradingView #QuantTradingPro #CryptoTraders #BacktestEverything
Don't miss Ethereum todayHello friends
Given the good rise we had, you can see that the price has entered a correction and has provided us with a good opportunity to buy in steps, of course with capital and risk management.
*Trade safely with us*

Ethereum:Daily signalhello guys👋
According to the drop we had, you can see that buyers came in and the price had a good growth, and after that a trading range was made in which the price got stuck.
Now, considering that the price is in the trading range and it seems that the buyers have shown their support, it is possible to step into the specified support areas with risk and capital management and move up to the set goals.
🔥Follow us for more signals🔥
*Trade safely with us*

When does Bolran start?Read carefullyhello friends👋
💰Many of you are asking when Bolran will start or if it will start at all, we decided to explain it to you in a full post.
Well, you can see the Ethereum chart moving in a channel, and with a drop, it created a big fear that a fall is coming, and meanwhile, the buyers returned the price to above 2000 dollars with a strong and unexpected return.
✅️Now the price is stuck in the specified box between 2200 and 2500, and if this range is maintained, the price will easily move up to the range of 3200 in the first wave, and if it fails to maintain this range, the price will fall below 1500 dollars.
🧐Now, in our opinion, due to the rapid return of the price from the channel, this failure is a fake channel and the range will be maintained, and we are likely to see Ethereum rise in the coming weeks.
🤔You know that Ethereum is the leader of altcoins, and if it grows, important altcoins will grow, which is the beginning of Bolran, and there are important altcoins that can be used for good profit.
🌟You can join us if you like.🌟
🔥Follow us for more signals🔥
*Trade safely with us*

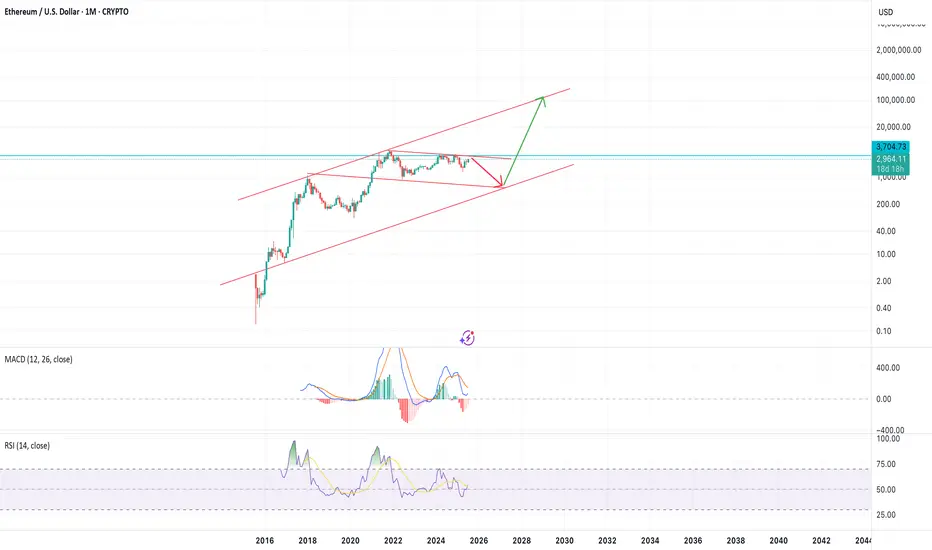
Bear market starts August 2025 and Bottoms January 2027 Ethereum will bottom at $450 then 2027 and 2028 will be the best 2 years in the history of crypto and the world and ethereum will reach above $100,000 by end of 2028
the charts are obvious!
Not a Financial advise
ETHUSDTThis is very easy...
best support level 2300 to 2500 for jump price. but was needed for jump price for get enrgy for movement to high levels by fake breakout.
First level of resistance 2800 to 3000.
⚠️Control Money Management in your capital.

ETH : BUY...Hello friends
Due to the entry of buyers and the breakdown of the trading range, we can buy in the direction of the trend and with capital and risk management within the specified limits and move to the specified targets.
*Trade safely with us*

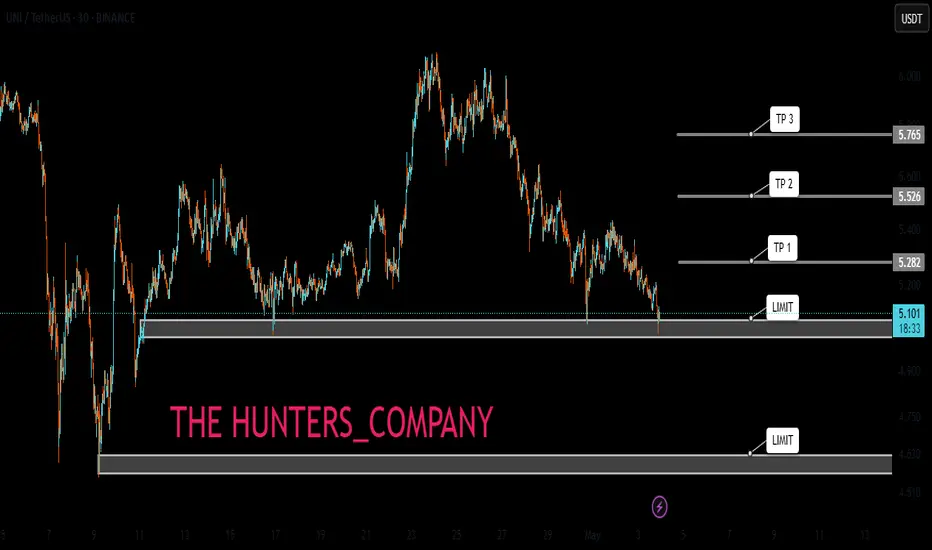
UNI:LIMIT FOR BUY(FREE)Hello friends
Due to the price drop, we can buy on the drop within the specified limits and move with it to the specified targets, of course with capital and risk management.
*Trade safely with us*
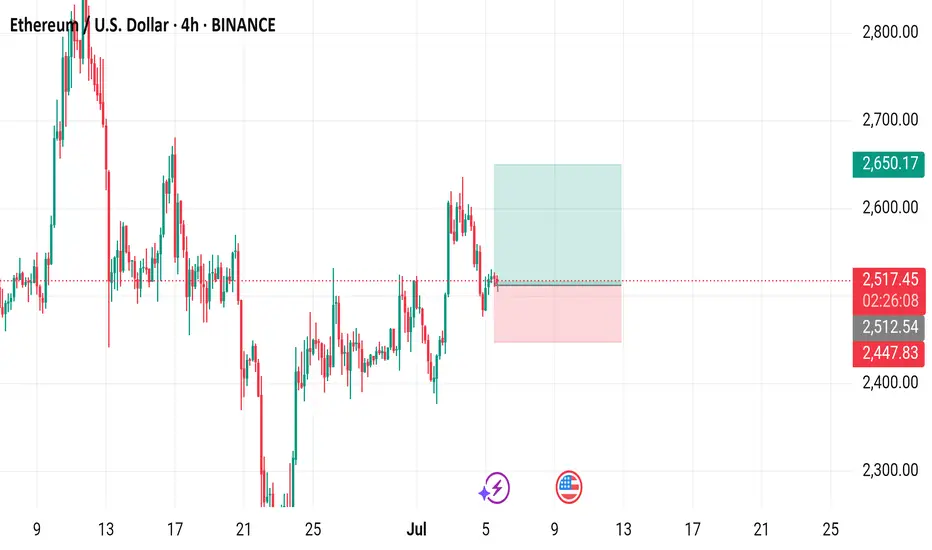
Ethereum / U.S. Dollar 4-Hour Chart4-hour chart from BINANCE displays the price movement of Ethereum (ETH) against the U.S. Dollar (USD) as of July 05, 2025. The current price is $2,520.12, reflecting a 4-hour increase of $10.77 (+0.43%). The chart includes buy and sell signals at $2,520.12, with a highlighted support zone around $2,447.83 and resistance near $2,650.17. A recent price drop is visible, followed by a potential consolidation or reversal zone marked in green and red.
ETH Short setupETH showing some weakness, manual SL if 4hrs candle closes above the mentioned point then must close the trade don't hold and wait for the new setup.

ETHUSDT Swing Trade AnalysisEth still struggling to break weekly bearish fvg, rather it's bullish or bearish, it must revisit the orange line which is daily bearish fvg, if it taps this and drops then a good sign , if it doesn't tap this and drops then it's a bad sign for eth, 3rd scenario is if we get any 4hr closing above the green line then I will not take the short and close short on the entry price, then I will short from the 3k area till 2.8k for scalp, if eth rejects from orange line 2583 then I will hold the trade till tp2. short only from the mention zone, if it doesn't tap the bearish fvg i will share another short trade with extended tps. remember that that yellow zone is important eth must retest it or break it to be bullish, without tapping this and drops then it's not a good sign for eth.

ETH/USDT#ETH
The price is moving within a descending channel on the 1-hour frame and is expected to break and continue upward.
We have a trend to stabilize above the 100 moving average once again.
We have a downtrend on the RSI indicator that supports the upward break.
We have a support area at the lower limit of the channel at 2440, acting as strong support from which the price can rebound.
We have a major support area in green that pushed the price upward at 2440.
Entry price: 2500.
First target: 2545.
Second target: 2539.
Third target: 2641.
To manage risk, don't forget stop loss and capital management.
When you reach the first target, save some profits and then change your stop order to an entry order.
For inquiries, please comment.
Thank you.

ETHUSDT SWING TRADE SetupWait for the entry and must use sl, if sl hits then wait for candle closure, candle managed to close above the SL, still there is lot of supply zone for eth till 2.7k, So fakeout also possible. I will comment the update, SO closely follow me.
Ethereum Breakdown Ahead? Classic Head & Shoulders Pattern Hello Guys!
Ethereum looks like it’s setting up for a potential drop after forming a textbook Head & Shoulders pattern on the 4H chart.
This pattern (marked clearly with a left shoulder, head, and right shoulder) is often seen before a price reversal. Right now, ETH has already broken below the neckline (around $2,480), confirming the bearish pattern, and is currently retesting that level from below.
📉 What’s Next?
If the pattern plays out, we could see ETH drop toward the projected target zone around $2,200–$2,250, which is highlighted in blue on the chart. This zone also lines up with a previous area of interest and sits near a broken trendline, adding confluence to the setup.
✅ What I see:
Resistance: ~$2,500 (neckline retest)
Target: ~$2,200 support zone
Broken trendline adds downside pressure
Unless bulls reclaim the neckline quickly and push above the right shoulder (~$2,650), this looks like a bearish continuation setup.

Inverse Head and Shoulders on Ethereum: Short Opportunity ETH?I'm currently watching Ethereum , and things are starting to look interesting.
We’re seeing early signs of a potential break in structure to the downside, and I’m closely monitoring a bearish inverse head and shoulders pattern. On the 30-minute timeframe, I’m waiting for a clear break of market structure within the current range before considering a short entry.
Stop loss would be placed above the range, with the target outlined in the video.
This is not financial advice—please trade responsibly and always manage your risk.

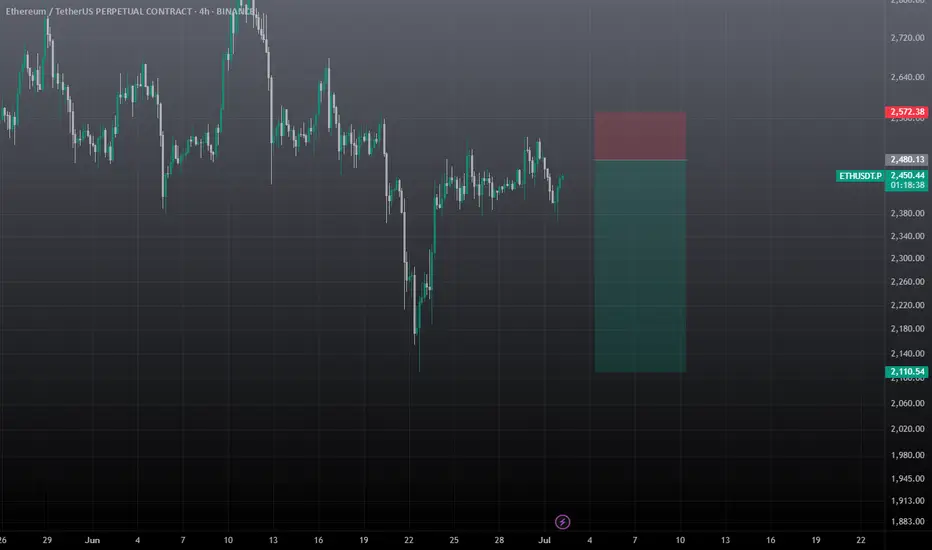
ETH on resistance.Ethereum 2 possible probabilities. 1 shows back demand level around 2100$ the other is a break of 2500$ and retest.

Ethereum is still bullish!#ETH
The price is moving within a descending channel on the 30-minute frame and is expected to break and continue upward.
We have a trend to stabilize above the 100 moving average once again.
We have a downtrend on the RSI indicator that supports the upward move with a breakout.
We have a support area at the lower boundary of the channel at 2450, acting as strong support from which the price can rebound.
We have a major support area in green that pushed the price upward at 2400.
Entry price: 2460.
First target: 2485.
Second target: 2510.
Third target: 2543.
To manage risk, don't forget stop loss and capital management.
When you reach the first target, save some profits and then change your stop order to an entry order.
For inquiries, please comment.
Thank you.

#ETH/USDT#ETH
The price is moving within a descending channel on the 1-hour frame, adhering well to it, and is on its way to breaking it strongly upwards and retesting it.
We are seeing a rebound from the lower boundary of the descending channel, which is support at 2427.
We have a downtrend on the RSI indicator that is about to break and retest, which supports the upward trend.
We are looking for stability above the 100 moving average.
Entry price: 2447
First target: 2476
Second target: 2500
Third target: 2533
