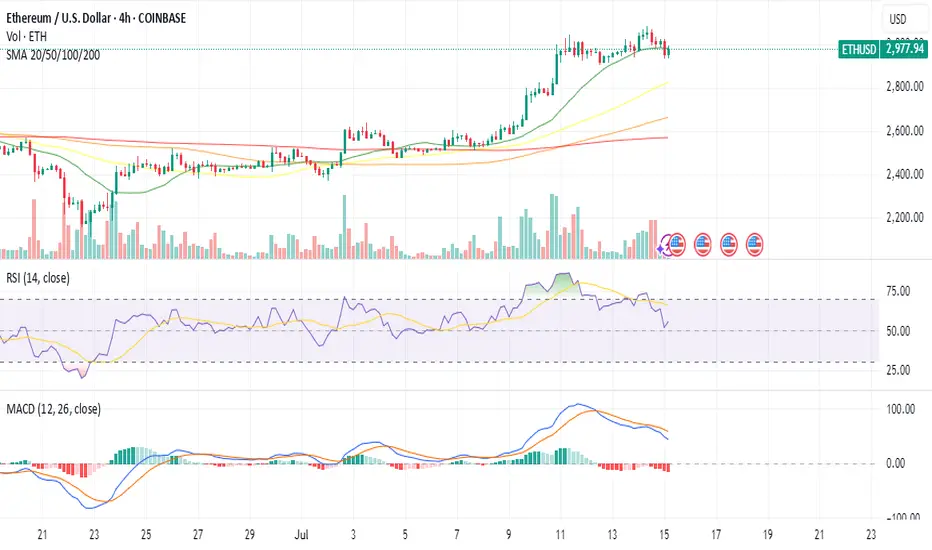
Eth Targetseth short term trade but once the market breals obver 3960 and sustain the longs will work great to 4350 level
Ethsignals

Ethereum Price Eyes $5K as Frenzy Fuels Supply ShockEthereum's Ascent: A Perfect Storm of Institutional Frenzy, Dwindling Supply, and Shifting Market Dominance
A palpable sense of anticipation is building in the cryptocurrency market, and its focal point is increasingly not on the reigning king, Bitcoin, but on its heir apparent, Ethereum. A confluence of powerful forces—ranging from bullish proclamations by Wall Street titans and an unprecedented institutional buying spree to compelling on-chain metrics and a shifting market structure—is painting a picture of a potential paradigm shift. The world's second-largest cryptocurrency is not just rallying; it appears to be on the precipice of a significant breakout, with some analysts eyeing targets that would shatter its previous all-time highs. This is not merely a story of price appreciation but a narrative of a "quiet takeover," where Ethereum's fundamental strengths and evolving role in the digital asset economy are finally being recognized by the world's largest financial players.
The chorus of bullish voices has grown louder in recent months, led by influential figures like billionaire investor and Galaxy Digital CEO, Mike Novogratz. A long-time crypto proponent, Novogratz has become increasingly vocal about his conviction that Ethereum is poised to outperform Bitcoin in the near future. He has repeatedly stated that Ethereum has a "really powerful narrative" and that market conditions are aligning for a significant upward move. Novogratz's thesis is built on a simple yet potent economic principle: a demand shock colliding with an already constrained supply. He predicts that Ethereum could outperform Bitcoin in the next three to six months, a bold statement given Bitcoin's own impressive performance.
The catalyst for this potential outperformance, according to Novogratz, is the flood of institutional capital now targeting Ethereum. This isn't just speculative interest; it's a strategic shift by major companies to hold ETH as a treasury reserve asset. This trend, he argues, is creating a supply crunch that will inevitably drive prices higher. The billionaire has identified the $4,000 mark as a critical psychological and technical level. In his view, a decisive break above this price point would launch Ethereum into a phase of "price discovery," where past resistance levels become irrelevant and the asset's value is determined by the sheer force of market demand. Novogratz believes Ethereum is "destined" to repeatedly challenge this $4,000 ceiling, suggesting that a breakout is a matter of when, not if.
This bullish sentiment from one of crypto's most respected voices is not occurring in a vacuum. It is underpinned by a dramatic and sustained price rally that has seen Ethereum's value surge by an astonishing 75% since late June. This powerful uptrend is not fueled by retail FOMO alone; rather, it is the result of a verifiable and accelerating wave of institutional adoption.
The primary engine behind this rally has been the launch and subsequent success of spot Ethereum Exchange-Traded Funds (ETFs). These regulated financial products have opened the floodgates for institutional investors to gain exposure to ETH without the complexities of direct custody. The inflows have been nothing short of staggering. In one remarkable instance on July 25th, Ethereum ETFs registered a net inflow of $452.8 million in a single day, with BlackRock's ETHA fund accounting for the lion's share at $440.1 million. This figure represents a dramatic escalation from the sub-$100 million daily inflows seen in early July, indicating a multifold jump in institutional buying pressure. In a single week, these ETFs absorbed a massive $2.18 billion, showcasing the voracious appetite of big money for a piece of the Ethereum network.
The impact of these ETF inflows is being magnified by a phenomenon known as a "supply shock." Analysts have noted that in a three-week period, ETFs purchased an amount of ETH equivalent to what the network would issue over 18 months. This aggressive absorption of the available supply from the open market, at a time when supply is already constrained due to staking and other factors, creates a powerful upward pressure on price.
The institutional frenzy is not limited to passive ETF investments. A new and significant trend has emerged: the rise of the "Ethereum treasury company." Mirroring the strategy pioneered by MicroStrategy with Bitcoin, corporations are now beginning to add substantial amounts of ETH to their balance sheets, viewing it as a strategic asset and a yield-bearing investment through staking.
Leading this charge is SharpLink Gaming, an online technology company that has made headlines with its aggressive accumulation of Ether. The company recently purchased an additional 77,210 ETH, worth approximately $295 million, in a single transaction. This purchase alone was more than the total net issuance of new Ether over the preceding 30 days. Following this acquisition, SharpLink's total holdings soared to over 438,000 ETH, valued at more than $1.69 billion. This makes SharpLink one of the largest corporate holders of Ethereum, second only to Bitmine Immersion Tech.
SharpLink's strategy is clear and ambitious. The company has filed to increase its stock sale from $1 billion to $6 billion, with the majority of the proceeds earmarked for further ETH purchases. The appointment of Joseph Chalom, a 20-year veteran of the world's largest asset manager, BlackRock, as its new co-CEO, lends further institutional credibility to its crypto-centric strategy. The company has also been vocal about its belief in the Ethereum network, with a recent social media post declaring, "Banks close on weekends. Ethereum runs 24/7." This sentiment captures the essence of why institutions are drawn to the programmable, always-on nature of the Ethereum blockchain.
Other companies, such as BitMine Immersion Technologies and the upcoming Ether Machine, which plans to list on Nasdaq, are also amassing significant ETH treasuries. BitMine has reported holdings of over 566,000 ETH, worth more than $2 billion. Collectively, these corporate players are creating a significant and sustained source of demand, locking up large portions of the circulating supply. This corporate buying spree is a powerful vote of confidence in Ethereum's long-term value proposition, extending far beyond its utility as a digital currency.
The torrent of institutional capital and corporate accumulation is vividly reflected in Ethereum's on-chain data. The network is buzzing with activity, providing a transparent window into the scale of the current buying pressure. One of the most telling metrics has been the explosion in on-chain volume. Over a recent three-week period, on-chain ETH volume surged by an incredible 288%, reaching a staggering $10.38 billion. This indicates a deep and liquid market with robust participation.
Even more compelling is the activity of large holders, colloquially known as "whales." Analysis of blockchain data reveals a sharp increase in the number of "mega whale" addresses—those holding 10,000 ETH or more. Since early July, over 170 new mega whale addresses have appeared on the network. This trend strongly suggests that the massive inflows from ETFs are not just being held by custodians but are being translated into direct, long-term accumulation by large, well-capitalized entities. These are typically "strong hands" that are less likely to sell in response to short-term market fluctuations, providing a stable base of support for the price.
Furthermore, the weekly volume of large transactions, defined as those exceeding $100,000, has hit its highest level since the peak of the 2021 bull run, totaling more than $100 billion in a single week. This explosion in whale activity, coinciding with Ethereum's price breakout into the high $3,000s, confirms that "smart money" is actively and aggressively positioning itself in the market. This is not the speculative froth of a retail-driven rally but the calculated maneuvering of institutional players.
Adding another layer to Ethereum's bullish case is a significant shift in the broader cryptocurrency market landscape: the steady decline of Bitcoin's dominance. Bitcoin dominance, which measures BTC's market capitalization as a percentage of the total crypto market cap, has been trending downwards. This indicates that capital is beginning to flow out of Bitcoin and into alternative cryptocurrencies, or "altcoins," with Ethereum being the primary beneficiary.
This phenomenon, often referred to as a "quiet takeover," signals growing confidence in Ethereum's relative strength. While Bitcoin has already set new all-time highs in the current cycle, Ethereum has yet to surpass its 2021 peak, suggesting it has more room to run. Analysts note that as Bitcoin's momentum has somewhat stalled, investors seeking higher returns are rotating into Ethereum, which offers a compelling combination of a strong narrative, institutional adoption, and significant upside potential.
The outperformance is stark when looking at recent returns. In the last 30 days, while Bitcoin posted respectable gains of around 11%, Ethereum surged by over 61%. This divergence is a classic sign of a market beginning to favor altcoins, a period often dubbed "altcoin season." Ethereum, as the leader of the altcoin pack, typically paves the way for broader rallies across the ecosystem. A rising Ethereum price and declining Bitcoin dominance create a fertile ground for other altcoins to flourish, with some analysts predicting double-digit returns for many smaller projects if Ethereum can successfully break the $4,000 barrier.
From a technical perspective, Ethereum's price chart is flashing multiple bullish signals, suggesting that the recent rally could be the start of a much larger move. Analysts are closely watching several key formations that have been developing over a long period. One of the most significant is a massive consolidation pattern. After a prolonged period of trading within a range, a breakout from such a pattern often leads to a powerful and sustained trend. Some analysts believe a breakout is imminent, with initial price targets set between $4,800 and $5,000.
Even more compelling is the challenge to a 3.7-year descending trendline. This long-term resistance has capped Ethereum's upward movements for years. A decisive weekly close above this trendline would be a major technical victory for the bulls, invalidating the long-term bearish structure and opening the door for a parabolic advance. Technical analysts often view the breach of such a long-standing trendline as a powerful signal of a major trend reversal and the beginning of a new bull market phase.
Should Ethereum successfully break out of its current consolidation and clear the $4,000 to $4,200 resistance zone, chart analysis suggests there is very little historical resistance until the $4,800 to $5,000 range. Some of the more bullish forecasts, looking at the ETH/BTC trading pair and other long-term models, even project potential targets between $7,300 and $10,000 in this market cycle.
Despite the overwhelmingly bullish picture, the path to new all-time highs is unlikely to be a straight line. The $4,000 level has proven to be a formidable barrier. Recently, Ethereum's price was firmly rejected near this psychological milestone, leading to a period of cooling volatility and raising concerns about a potential short-term selloff. The failure to break through has caused some buying pressure to weaken, and on-chain data has shown a temporary decrease in large whale transactions following the rejection.
This price action highlights the classic tug-of-war between buyers and sellers at a key resistance level. Some traders who have enjoyed the 75% run-up may be tempted to take profits, creating selling pressure. The Relative Strength Index (RSI), a momentum indicator, has also shown signs of being "overheated," suggesting that a period of consolidation or a minor correction could be healthy and necessary before the next leg up.
However, a key positive sign is that despite the rejection, buyers have not given up much ground. The price has continued to consolidate just below the resistance area, indicating that dips are being bought and that underlying demand remains strong. This type of price action, where an asset persistently hovers near a major resistance level without a significant pullback, is often a precursor to an eventual breakout.
Crucially, while retail sentiment and short-term trading metrics might show some hesitation, the institutional tide shows no sign of ebbing. Spot ETF inflows have remained consistently positive, providing a steady stream of buying pressure that counteracts short-term selling. This suggests that while there may be some turbulence in the immediate future, the larger, more powerful trend is being driven by long-term institutional accumulators who are less concerned with short-term price swings.
In conclusion, Ethereum finds itself at a historic crossroads, propelled by a perfect storm of fundamental and technical tailwinds. The narrative is no longer just about its technological promise as a world computer but about its emergence as a mature, institutional-grade asset. The vocal support of financial titans like Mike Novogratz, the verifiable flood of institutional capital through ETFs, and the strategic shift by corporations to hold ETH in their treasuries are creating a demand shock of unprecedented scale.
This is being met with a supply that is increasingly constrained, thanks to staking and the aggressive accumulation by these new, large players. On-chain data confirms this story, with volumes and whale activity reaching levels not seen since the last bull market peak. As Bitcoin's dominance wanes, Ethereum is stepping into the spotlight, ready to lead the next phase of the market cycle.
While the $4,000 resistance remains a key hurdle to overcome, and short-term volatility is to be expected, the underlying forces at play suggest a powerful current pulling Ethereum towards new horizons. The "quiet takeover" is becoming louder by the day. A breakout above $4,000 could unleash a wave of price discovery, potentially pushing Ethereum to $5,000 and beyond, and in the process, reshaping the very landscape of the digital asset ecosystem. The stage is set for Ethereum's ascent, and the world is watching.

ETH-----Buy around 3850, target 3930 areaTechnical analysis of ETH contract on July 28:
Today, the large-cycle daily level closed with a small positive line yesterday, the K-line pattern continued to rise, the price was above the moving average, and the attached indicator was running in a golden cross. The general trend of rising is still very obvious. The current price has deviated from the moving average and returned to the moving average support position near the 3775 area, so you still need to pay attention to the risk trend of retracement in trading. The overall trend of the short-cycle hourly chart is in a volatile upward trend, but the price is relying on the support of the MA5 and MA10 daily moving averages to rise, and the general trend of rising is relatively obvious, so you still need to find obvious signals to enter the market during the day. The current four-hour moving average support position is near the 3850 area, and the hourly chart continues to fall.
Today's ETH short-term contract trading strategy:
Purchase at the 3850 area when retreating, stop loss at the 3820 area, and target the 3930 area;

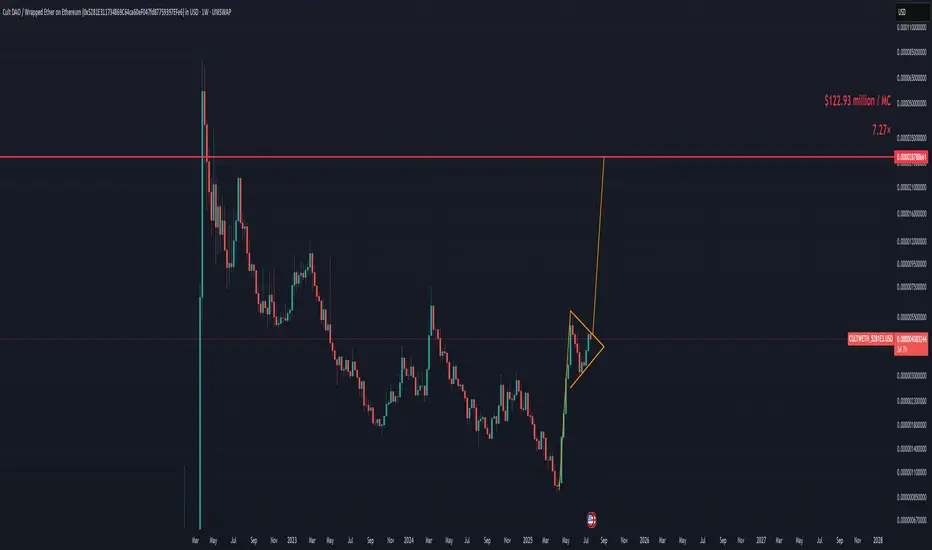
Brace for Impact: CULT DAO’s Bull Flag Points to Violent Upside!If you missed the last 500% wave from CULT DAO, fear not you’re just in time if you’re reading this.
My bottom call was slightly off, but since the lows, it's up 500% and it's just getting warmed up.
We are now forming a giant bull flag that will take CULT DAO straight to $122 million a 7.27x from this price.
I will be publishing CULT DAO TA’s until we hit a one billion dollar market cap, which we should reach sometime in Q4 2025.
Seeing a giant bull flag forming as we enter the final phase of the bull market is beautiful.
Prepare accordingly. Time is limited. We will blast off in under 30 days.
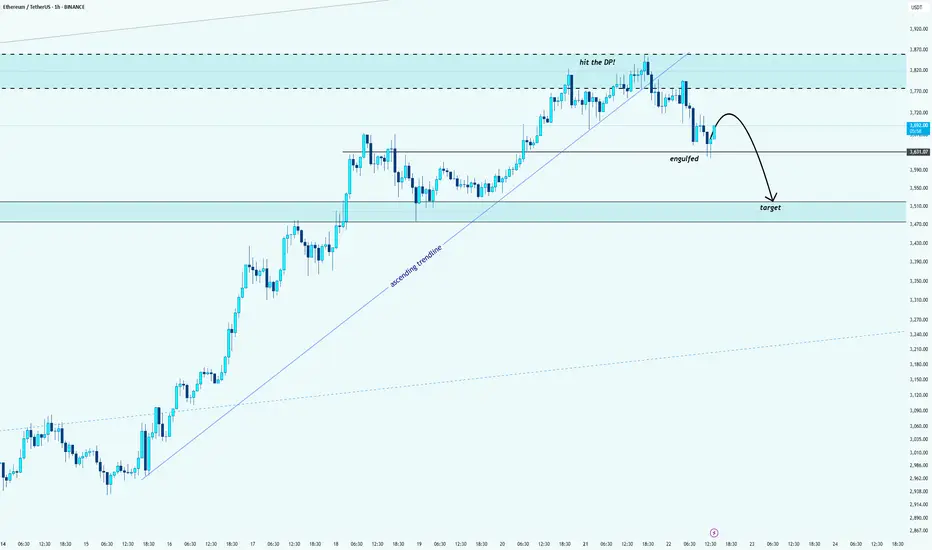
ETH/USDT: Bearish Reversal After Hitting the Decision PointHello guys!
After a strong rally, ETH finally hit the Decision Point (DP) zone marked above. Like what I said:
And we’ve already seen signs of rejection from that level.
🔹 The ascending trendline is broken
🔹 A key support got engulfed
🔹 Price is now forming a bearish structure
The target zone is mapped out around $3,500 – $3,470, where previous demand sits.
We might see a small pullback before continuation, but overall momentum is shifting downward.
Wait for confirmations and protect your capital
ETH-----Sell around 3690, target 3615 areaTechnical analysis of ETH contract on July 25:
Today, the large-cycle daily level closed with a small positive line yesterday, the K-line pattern was single negative and single positive, the price was at a high level, and the attached indicator was golden cross and running with shrinking volume. From the big trend, the current trend is in a weak trend, the price rebound is not strong and has not continued, the trend is prone to fall under pressure and test the low point downward, so the trend has changed; the short-cycle hourly chart yesterday hit a high in the US market and fell under pressure in the Asian morning. The current K-line pattern is continuous negative, the price is at a low level, and the attached indicator is dead cross running. It is highly likely that the decline will continue during the day. Yesterday's low point of 3500 is the position that needs to be paid attention to today. The current hourly chart resistance is near the 3695 area.
Today's ETH short-term contract trading strategy:
Sell in the 3690 area after the rebound, stop loss in the 3720 area, and target the 3615 area;

ETH/USDTHello friends, my analysis for Ethereum is bullish and I think it will continue its recent gains. What do you think?

Ethereum Breakout Could Spark the Next Altseason!A Massive Altseason Is Brewing… 🚀
Ethereum just flashed a major monthly breakout after printing a clean Morning Star reversal right at key support.
Now it's pushing against the upper resistance zone, a structure that held it back for over two years.
If CRYPTOCAP:ETH breaks and closes above this level, it won’t just be bullish for Ethereum — it could ignite the biggest altcoin season since 2021.
Why it matters:
📌 ETH is the heart of the altcoin ecosystem.
📌Historical breakouts like this led to 1500%+ moves.
📌The pattern and price action are lining up perfectly again.
Once Ethereum breaks cleanly above $4,000, expect altcoins to explode across the board — Layer 2s, DeFi, AI tokens, and even the meme coins could all start flying.
Keep your eyes on ETH. Its breakout is the spark… the altseason fire is coming.
DYOR | Not Financial Advice

ETH (5 year of accumulation!)ETH / USDT
📌 Background: i shared an analysis about ETH/BTC chart and i predicted the ultimate bottom, from which ETH/BTC pumped 52% and ETH/USDT pumped 97% in few days !
you can check previous analysis: click here
📌 Today we have different chart against stable coin … Ethereum is being accumulated since 5 years in mega accumulation range with 2 major stop-loss hunt (long and short)
📌 What IF ?
What if ETH made a breakout throughout this accumulation ? i think we can see scenario like that in the green candles in my chart
DO YOU AGREE ?

ETH-----Sell around 3680, target 3650-3630 areaTechnical analysis of ETH contract on July 22:
Today, the large-cycle daily level closed with a small positive line yesterday, the K-line pattern continued to rise, the price was above the moving average, and the attached indicator was running in a golden cross. The overall upward trend was still very obvious, and yesterday's decline can be regarded as a correction based on the current trend. The price just returned to the support of the moving average, and the strong support position was near the 3630 area; the short-cycle hourly chart currently has a continuous negative K-line pattern, the price is below the moving average, and the attached indicator is running in a dead cross, so let's look at the retracement trend during the day, and pay attention to the 3630 area below the support.
Today's ETH short-term contract trading strategy:
The current price is 3680, short, stop loss in the 3745 area, and the target is the 3650-3630 area;

#ETH/USDT SETUP ,Bought From $3696#ETH
The price is moving within a descending channel on the 1-hour frame, adhering well to it, and is on its way to breaking strongly upwards and retesting it.
We have support from the lower boundary of the descending channel at 3640.
We have a downtrend on the RSI indicator that is about to be broken and retested, supporting the upside.
There is a major support area in green at 3600, which represents a strong basis for the upside.
Don't forget a simple thing: ease and capital.
When you reach the first target, save some money and then change your stop-loss order to an entry order.
For inquiries, please leave a comment.
We have a trend to hold above the Moving Average 100.
Entry price: 3696.
First target: 3764.
Second target: 3826.
Third target: 3904.
Don't forget a simple thing: ease and capital.
When you reach your first target, save some money and then change your stop-loss order to an entry order.
For inquiries, please leave a comment.
Thank you.

Ethereum is going to 2000 then new ATH
Alright, let's talk about what I see coming for Ethereum. I’ve been deep-diving into these charts, especially that weekly one where I’ve highlighted the past moves and percentages. I'm using these patterns as a guide to try and anticipate where Ethereum is heading next. I'm going to set aside any kind of trading advice, and focus on what I see the market doing next.
Key Observations From Past Cycles
Looking at Ethereum's history, I’m seeing a pretty clear cycle of large price swings:
Massive Rallies: Ethereum has a history of powerful bull runs, where the price can surge by hundreds, or even thousands of percent. I need to be aware of these to understand the potential of the coin.
Substantial Corrections: These rallies are always followed by substantial corrections, which range from about 30%, to upwards of 80%. This is important to see as any retracement can be devastating to a trader.
My Prediction For The Next Move:
Based on those historical patterns, here’s what I see as the most probable outcome for Ethereum's next move:
Anticipated Retracement: I’m expecting a retracement, or a pullback following the recent gains. Ethereum tends to make large retracements after a period of growth, and I am anticipating this will happen again soon. I want to see the price find a solid level of support, as this will be important to the next move up. Based on historical price action, I expect the next support levels to be somewhere around $2000 to $2500.
The Next Upside Move: After that pullback, I anticipate a strong upside move.
The magnitude of this move is unclear, but the data on the chart shows we could be looking at a move upwards of 100%, and maybe even more. I want to be watching that very carefully when it happens.

ETH Approaching Major Resistance – Expecting Pullback Hello guys!
Ethereum has been rallying strongly within a well-respected ascending channel, pushing past key levels and now approaching a major resistance zone around $3,900–$4,000.
According to the chart structure, it looks like price could soon react from this resistance, leading to a pullback into the $3,000–$3,200 demand zone, which aligns with the midline of the channel.
This would be a healthy correction before potentially continuing the bullish trend and attempting a clean breakout toward new highs.
ETH is still bullish, but it may need to retest support before continuation.
Watch for a bounce from the $3,000–$3,200 zone for a high-probability long opportunity.

ETHUSDT | Two Opportunities. One Smart Approach.I’ve been closely watching how buyers behave under the green line — and they’re clearly not backing down. But what really catches my eye is the blue box , a clean demand zone I’ve seen act as a launchpad in the past.
You don’t need to jump in blindly.
Depending on your risk appetite, both levels are valid. But if you wait for a 15-minute breakout confirmation on the low timeframe before acting on either, your odds of success increase significantly.
This is how I keep my win rate high, waiting for the market to prove itself first.
“I will not insist on my short idea. If the levels suddenly break upwards and do not give a downward break in the low time frame, I will not evaluate it. If they break upwards with volume and give a retest, I will look long.”
Most traders rush in. You wait smart. That’s the edge.
Choose wisely. Follow closely.
📌I keep my charts clean and simple because I believe clarity leads to better decisions.
📌My approach is built on years of experience and a solid track record. I don’t claim to know it all but I’m confident in my ability to spot high-probability setups.
📌If you would like to learn how to use the heatmap, cumulative volume delta and volume footprint techniques that I use below to determine very accurate demand regions, you can send me a private message. I help anyone who wants it completely free of charge.
🔑I have a long list of my proven technique below:
🎯 ZENUSDT.P: Patience & Profitability | %230 Reaction from the Sniper Entry
🐶 DOGEUSDT.P: Next Move
🎨 RENDERUSDT.P: Opportunity of the Month
💎 ETHUSDT.P: Where to Retrace
🟢 BNBUSDT.P: Potential Surge
📊 BTC Dominance: Reaction Zone
🌊 WAVESUSDT.P: Demand Zone Potential
🟣 UNIUSDT.P: Long-Term Trade
🔵 XRPUSDT.P: Entry Zones
🔗 LINKUSDT.P: Follow The River
📈 BTCUSDT.P: Two Key Demand Zones
🟩 POLUSDT: Bullish Momentum
🌟 PENDLEUSDT.P: Where Opportunity Meets Precision
🔥 BTCUSDT.P: Liquidation of Highly Leveraged Longs
🌊 SOLUSDT.P: SOL's Dip - Your Opportunity
🐸 1000PEPEUSDT.P: Prime Bounce Zone Unlocked
🚀 ETHUSDT.P: Set to Explode - Don't Miss This Game Changer
🤖 IQUSDT: Smart Plan
⚡️ PONDUSDT: A Trade Not Taken Is Better Than a Losing One
💼 STMXUSDT: 2 Buying Areas
🐢 TURBOUSDT: Buy Zones and Buyer Presence
🌍 ICPUSDT.P: Massive Upside Potential | Check the Trade Update For Seeing Results
🟠 IDEXUSDT: Spot Buy Area | %26 Profit if You Trade with MSB
📌 USUALUSDT: Buyers Are Active + %70 Profit in Total
🌟 FORTHUSDT: Sniper Entry +%26 Reaction
🐳 QKCUSDT: Sniper Entry +%57 Reaction
📊 BTC.D: Retest of Key Area Highly Likely
📊 XNOUSDT %80 Reaction with a Simple Blue Box!
📊 BELUSDT Amazing %120 Reaction!
📊 Simple Red Box, Extraordinary Results
I stopped adding to the list because it's kinda tiring to add 5-10 charts in every move but you can check my profile and see that it goes on..

ETHUSDTThis movement downtrend. If breake 2.790 movr to 3.500$ but breke 2.200 move trend to 1.500$.

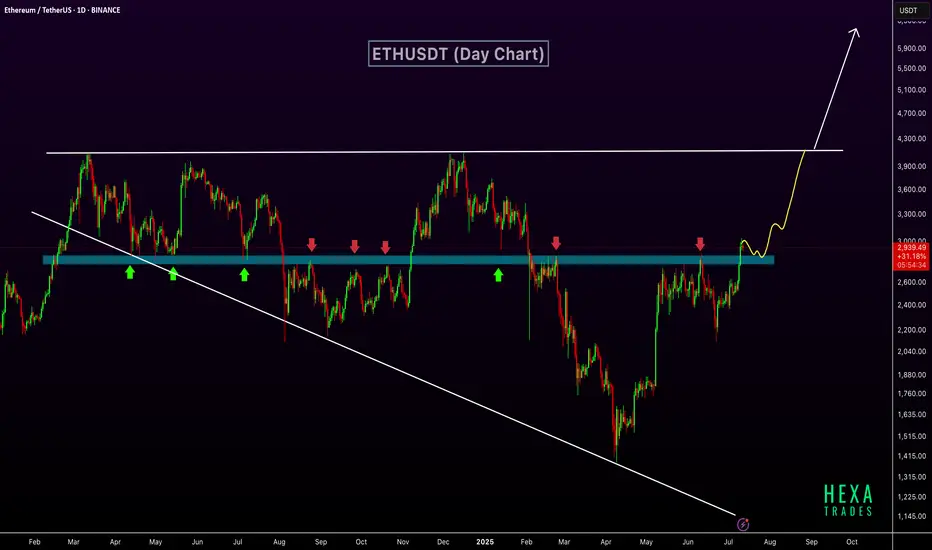
ETH Breaks Key Resistance – $6K Possible if Wedge BreaksETHUSDT has broken out above a key horizontal resistance zone that has historically acted as a strong support and resistance level. This zone, marked in blue, has seen multiple rejections and bounces over the past year, confirming its significance.
The recent breakout above this zone indicates a shift in market structure and suggests growing bullish momentum. The price action shows a clean move above resistance, with potential for a retest before continuing higher. The market is also forming a long-term broadening wedge pattern. The next target lies near the upper resistance of the wedge, around $4,000. If the price breaks above this broadening wedge, it could open the path toward the $6,000 level.
Regards
Hexa
Ethereum – Calm Before the Next Leg Up?Ethereum had a disappointing start in 2025.
After pushing above $4,000 in mid-December 2024 — with headlines full of "$10K ETH coming!" — the new year began around $3,500, and what followed was a slow bleed.
By early April, Ethereum printed a shocking low at $1,380 — a level few believed was even possible.
But the bounce from there? ⚡
It was explosive — nearly +100% in just one month, with price topping around $2,700.
Since then, we’ve been consolidating — and that’s completely normal after such a vertical move.
🔍 So, what’s next?
Technically, ETH is forming a rectangle, a structure that often resolves as a continuation pattern.
The spike down to the $2,300 zone on May 19th was telling — buyers stepped in aggressively and pushed price back above $2,500, which now acts as a comfort zone for bulls.
📌 Conclusion
I’m looking to buy dips, ideally near $2,550, and my target is the $3,500 zone.
No need to reconsider the bullish outlook as long as price holds above $2,300.

ETHUSDT minor trendsEthereum BINANCE:ETHUSDT is downtrend with lower highs from the bottom is nearly finished 📉 . For a stronger rise, it needs to stabilize above $2500 ⚡. Mid-term targets are $3300 (end of second leg) and $3700 (major resistance) 🎯. Key supports are $2500, $2070, $1800, and $1550, the base where the uptrend began 🛡️.
Supports & Resistances:
Supports: \$2500, \$2070, \$1800, \$1550
Resistances: \$2500 (critical level), \$3300, \$3700

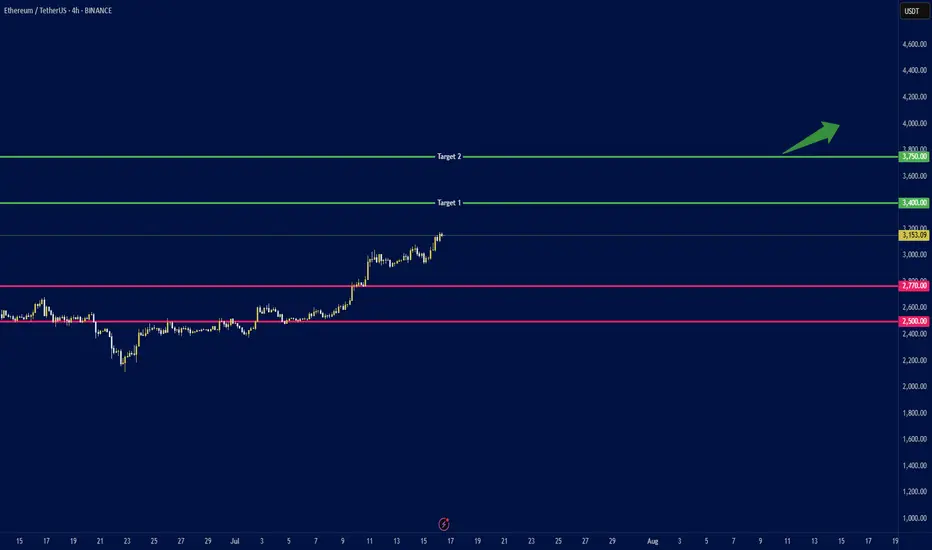
ETH to $4K ? Whales Accumulate as ETFs Break Records🕞 Timeframe: 4H
.
🟢 Bias: Bullish
1. 🧭 Fundamental Overview:
📈 Massive Institutional Inflows:
Ethereum ETFs have recorded over $1.2 billion in net inflows this July, with $908M just in the week ending July 11. This strong demand from institutional players (notably through ETHA and Bitwise) has pushed ETF AUM above $13.5 billion.
🏢 Corporate Accumulation:
Companies such as SharpLink Gaming have begun adding ETH to their balance sheets. SharpLink's 10,000 ETH (~$49M) purchase highlights growing corporate adoption of Ethereum as a store of value and strategic reserve.
🛠️ Ecosystem Resilience:
Ethereum continues to lead in network upgrades (e.g., Dencun), institutional DeFi, and tokenized assets—strengthening the long-term fundamentals of the chain.
2. 🧠 Sentiment & On‑Chain Metrics
🏦 Institutional Sentiment:
Ethereum ETFs have seen 12 straight weeks of inflows, outperforming Bitcoin in institutional allocation growth (ETH: 1.6%, BTC: 0.8%).
🐋 Whale Activity & Exchange Flows:
Declining ETH balances on exchanges suggest accumulation and reduced sell pressure. Whales and smart money are taking positions.
📊 Public Sentiment:
Bullish expectations remain strong amid price consolidation above key levels and positive ETF momentum.
3. 🔼 Key Levels:
Support: $2,770 and $2,500 (major trendline and psychological level).
4.🎯 Price Targets:
Short‑term (2–4 weeks):
If ETH breaks above $3,150: next targets at $3,400 and $3,750.
Medium‑term (by end of Q3 2025):
ETH could reach $3,500 with potential upside to $4,000.
.
.
.
⚠️ Disclaimer: This analysis is for educational purposes and not financial advice. Please do your own research and risk management.
.
✅ If you like this analysis, don't forget to like 👍, follow 🧠, and share your thoughts below 💬!
Don't miss Ethereum todayHello friends
Given the good rise we had, you can see that the price has entered a correction and has provided us with a good opportunity to buy in steps, of course with capital and risk management.
*Trade safely with us*

Ethereum:Daily signalhello guys👋
According to the drop we had, you can see that buyers came in and the price had a good growth, and after that a trading range was made in which the price got stuck.
Now, considering that the price is in the trading range and it seems that the buyers have shown their support, it is possible to step into the specified support areas with risk and capital management and move up to the set goals.
🔥Follow us for more signals🔥
*Trade safely with us*

Ethereum Price Rejects $3K: Is A Deeper Correction Ahead?Ethereum's Precarious Perch: Price Stumbles at $3K as Long-Term Conviction and Quantum Threats Collide
The cryptocurrency community is intently watching Ethereum as the premier smart contract platform engages in a fierce battle around the psychologically crucial $3,000 mark. Following a promising surge that breached this barrier for the first time in several months, the upward momentum has stalled, giving way to a tense period of consolidation. This raises a pivotal question for investors and market observers alike: is a more significant correction on the horizon, or is this merely a strategic pause before the next major advance toward $3,200 and potentially higher valuations?
The recent price action has been a whirlwind for traders. Ethereum climbed with bullish determination, reaching heights near $3,080 before encountering substantial selling pressure that forced a retreat. This downturn has left the price hovering near the $2,940 level, trading precariously near its 100-hourly Simple Moving Average (SMA). Exacerbating the bearish sentiment, the price has broken below a key bullish trend line that had previously offered support at the $2,980 mark, a technical development that often signals the potential for further declines.
This short-term market turbulence, however, unfolds within a much broader and more intricate narrative. While hourly charts may be flashing warning signs, an analysis of long-term on-chain data reveals a story of strengthening fundamentals, underscored by a record amount of Ethereum being locked away by confident, long-term holders. In parallel, the Ethereum developer community, with co-founder Vitalik Buterin at the forefront, is proactively strategizing for a distant yet potentially existential threat: the "Quantum Apocalypse." This unique convergence of immediate bearish technical indicators, profound long-term bullish sentiment, and forward-thinking security planning creates a fascinating and unpredictable landscape for the pioneering blockchain platform.
The Short-Term Tug-of-War: A Correction Towards $2,900 or a Rally to $3,200?
In the immediate term, the market is a battlefield of competing forces. The inability to sustain a position above the $3,000 level has emboldened sellers, and key technical indicators are suggesting a cautious approach. The hourly MACD (Moving Average Convergence Divergence) is indicating a loss of momentum within the bullish zone, while the RSI (Relative Strength Index) has fallen below the 50 mark, suggesting that selling pressure could be gaining the upper hand.
Market analysts are now laser-focused on the $2,900 zone, viewing it as the primary line of defense for the bulls. If this support level can withstand the selling pressure, it could provide the necessary foundation for a fresh increase, enabling Ethereum to reclaim its lost ground and launch another attempt to conquer the $3,000 resistance. Conversely, a decisive break below this critical support could initiate a more substantial correction. In such a scenario, subsequent support targets would likely be found near $2,800, with the potential for further drops to the $2,720 or even $2,650 price points.
A particularly compelling theory circulating among analysts involves the concept of a "liquidity sweep." On-chain data indicates a significant concentration of liquidity—essentially, a large cluster of buy orders and stop-loss orders—residing just below the $2,900 level. Market dynamics frequently see price action gravitate toward these zones to trigger liquidations, effectively shaking out over-leveraged traders before a more sustained move in the opposite direction. Consequently, a brief dip below $2,900 to "grab" this liquidity would not be an unexpected development. Paradoxically, such a move could be the very catalyst required to fuel a durable rally toward the next major target: the $3,200 supply zone. This level is widely regarded as the next significant hurdle, a price ceiling where a large volume of sell orders is anticipated to be waiting.
The volatility surrounding key psychological levels like $3,000 is notoriously difficult to predict, as human emotions of fear and greed often drive exaggerated market reactions. For the time being, the short-term outlook remains uncertain, heavily contingent on whether the crucial $2,900 support can absorb the selling pressure or if a flush-out of liquidity is needed before the bulls can confidently reassert control.
The Bullish Undercurrent: Smart Money's Long Game and a Shrinking Supply
Looking beyond the volatile daily price charts reveals a powerful undercurrent of bullish conviction. A key metric that speaks volumes about long-term investor sentiment is the quantity of Ethereum locked in staking contracts, which has recently soared to a new all-time high.
Recent on-chain data indicates that nearly 30% of Ethereum's total supply is now staked on the network. As of mid-2025, more than 35 million ETH have been committed to validator nodes, a process that helps secure the network while allowing stakers to earn passive income. This trend, which has seen a notable acceleration in recent months, serves as a powerful indicator of long-term confidence. When investors, particularly large holders often referred to as "whales," stake their ETH, they are effectively removing it from the liquid, tradable supply. This reduction in available supply, frequently described as a "supply shock," means that any future increase in demand can have a more pronounced positive effect on the asset's price.
This staking activity is widely interpreted as "smart money" placing a long-term bet on Ethereum's continued growth and success. These are not day traders reacting to minor price swings but rather institutional investors and seasoned crypto participants who are focused on the bigger picture. Their actions signal a deep-seated belief that the intrinsic value of the Ethereum network—as the foundational layer for decentralized finance (DeFi), non-fungible tokens (NFTs), and a vast ecosystem of other applications—will continue to appreciate over time. This accumulation is not limited to staking; the number of wallets with no history of selling has also reached a record high, collectively holding over 22.8 million ETH.
This expanding pool of illiquid supply, driven by a firm belief in Ethereum's fundamental value proposition and its future roadmap, provides a strong counter-narrative to the short-term bearish technicals. It suggests that while the price may experience turbulence in the near term, a substantial and growing cohort of investors is prepared to hold through the volatility, thereby creating a solid foundation for future price appreciation.
The Existential Question: Can Ethereum Outsmart a Quantum Apocalypse?
While traders and short-term investors grapple with hourly charts and staking metrics, Ethereum's core developers are concentrating on a threat that is far more distant but infinitely more profound: the advent of quantum computing. The "Quantum Apocalypse" is a term used to describe the hypothetical future event—often called "Q-Day"—when a quantum computer becomes powerful enough to break the cryptographic algorithms that secure virtually all of our modern digital infrastructure. This includes blockchain networks like Ethereum and Bitcoin.
Such a powerful machine could, in theory, reverse-engineer a user's private key from their public key, which would grant an attacker complete and unfettered control over their digital assets. For a multi-billion dollar ecosystem built on the unwavering promise of cryptographic security, this represents an existential threat of the highest order.
However, the leadership within the Ethereum ecosystem, including co-founder Vitalik Buterin and the Ethereum Foundation, is not idly waiting for this threat to materialize. They are actively and transparently working to make the network quantum-resistant. Buterin has publicly addressed the issue, noting that prediction markets currently forecast the arrival of a cryptographically relevant quantum computer sometime between 2030 and 2035. This timeline provides a crucial window for the network to transition its security protocols to a more robust standard.
The strategy to neutralize this threat is multifaceted and is a core component of Ethereum's long-term development roadmap. Key initiatives include:
• Post-Quantum Cryptography: Researchers are diligently developing and testing new types of signature schemes that are designed to be resistant to attacks from both classical and quantum computers. Two of the most promising approaches are STARKs (Scalable Transparent Arguments of Knowledge) and lattice-based cryptography. STARKs, for instance, would allow users to prove ownership of their assets without ever exposing their private keys.
• The "Lean Ethereum" Roadmap: Buterin and fellow researcher Justin Drake have put forth a vision for a "Lean Ethereum" that aims to simplify the blockchain's base layer. This simplification would not only make the protocol easier to audit and secure but would also facilitate the integration of post-quantum-ready signatures and other advanced defensive measures.
• Emergency Hard Forks: In a worst-case scenario where a quantum threat emerges much sooner than anticipated, Buterin has suggested that an emergency hard fork could be deployed as a final line of defense. This would involve a network-wide upgrade where all users would be required to migrate their funds to new, quantum-resistant "smart" wallets, thereby rendering the old, vulnerable accounts obsolete.
Buterin remains cautiously optimistic about the network's ability to navigate this challenge. The proactive stance, the commitment to public and transparent research, and the multi-layered defense strategy all demonstrate a deep commitment to ensuring Ethereum's security for decades to come. This effort aims to transform a potential apocalypse into a manageable, albeit complex, technological evolution.
Conclusion: A Market at a Crossroads
Ethereum currently stands at a fascinating crossroads, a point where short-term technical uncertainty is juxtaposed with immense long-term fundamental strength and remarkable foresight. The immediate price action is a toss-up, delicately balanced on the crucial $2,900 support level. A sustained dip below this line could send prices into a corrective wave toward $2,800 or lower, possibly to sweep liquidity before a stronger and more convincing rebound. Conversely, if this support holds firm, it could empower the bulls to decisively conquer the $3,000 barrier and set their sights on the formidable $3,200 resistance zone.
When one zooms out from the daily noise, the picture becomes clearer and decidedly more bullish. The record-breaking amount of ETH locked in staking contracts paints a portrait of unwavering long-term conviction from sophisticated investors who are systematically reducing the available supply while simultaneously strengthening the network's security. This patient accumulation provides a powerful buffer against short-term market panic.
Looking even further into the future, Ethereum's leadership is already waging a quiet war against the quantum threat, meticulously laying the groundwork for a post-quantum world. This long-range planning, while not a direct factor in today's price movements, underpins the network's potential for longevity and resilience.
For the investor, the current dilemma—a rally to $3,200 or a pullback first?—is largely a matter of time horizon. The path of least resistance in the coming days and weeks remains ambiguous, clouded by liquidation levels and psychological barriers. But for those with a longer view, the on-chain data and the forward-thinking roadmap strongly suggest that Ethereum is not just building for the next bull run, but for the next generation of the internet. The current price turbulence, while unsettling, may ultimately be remembered as a minor tremor before a much more significant structural shift in value.
(ETH/USD) Bullish Setup: Entry at $2,422 with Target at $2,521 a1. Entry Point: ~2,422.2
This is the suggested buy area based on a recent bounce from the support zone
2. Support Zone (Purple Box):
Bottom boundary: ~2,392.4
Top boundary: ~2,408.4
Price has bounced multiple times here, showing strong buying interest.
3. Resistance Point: ~2,463.9
A clear horizontal resistance line, previously tested.
4. EA Target Point: ~2,522.1
A bullish target if the price breaks above the resistance level.
🔶 Highlighted Patterns / Markers
Orange Circles: Indicate key swing highs and lows — possibly used to identify double tops/bottoms or rejection/wick zones.
Blue Arrows: Illustrate the anticipated move from:
Entry (2,408.1) → Resistance (2,463.9) → Target (2,521.2)
Target gain = +111.7 USD (+4.64%)
🔻 Stop Loss Level
Set just below the support box at ~2,392.4
Protects from false breakouts or deeper pullbacks.
📈 Strategy Outlook
Bullish Bias: The setup expects a breakout from the current price range.
Risk-Reward Ratio: Appears favorable — tight stop and wide target.
Confirmation Needed: A solid breakout and hold above 2,423–2,425 may be the early confirmation signal.
📌 Summary
Element Value
Entry Point ~2,422.2
Stop Loss ~2,392.4
Resistance ~2,463.9
Target (TP) ~2,521.2
R:R Ratio Approx. 3:1
Bias Bullish
