Ethereum Remains Technically Solid Bullish Background ConfirmedOverall Market Sentiment
Looking at TipRanks data, ETH is receiving Strong Buy signals on the daily, weekly and monthly timeframes, with a strong dominance of "Buy" on the moving averages (12 Buy) and moderately positive dynamics on the oscillators
Price indicators (EMA20, EMA50, EMA100, EMA200) are significantly below the current price, which confirms a stable uptrend.
Key support and resistance levels
Support:
around $4,030-4,100, where an important foundation has been built in case of a reverse movement.
Resistance:
The previous zone of $4,300-4,350, where the price has repeatedly encountered difficulties.
A confident breakout is a possible path to $4,576 (the maximum of the 24-hour range) and further up.
Technical indicators and signals
Daily and weekly timeframes — "Strong Buy".
RSI ~55–56 (Buy), MACD — Buy. Other oscillators give a neutral signal.
Trade Plan from Binance (ETH/USDT):
Current price is around $4,336, below EMA7 ($4,398), but above EMA25 ($4,044) — confirms the medium-term bullish trend.
Possible rebound from support $4,278–4,300, targets — $4,398, $4,576 and then $4,781 upon breakout. Risk — fall to $4,043 upon breakout of EMA25.
Ethusdlong

ETHUSD develops new bullish impulseETHUSD develops new bullish impulse
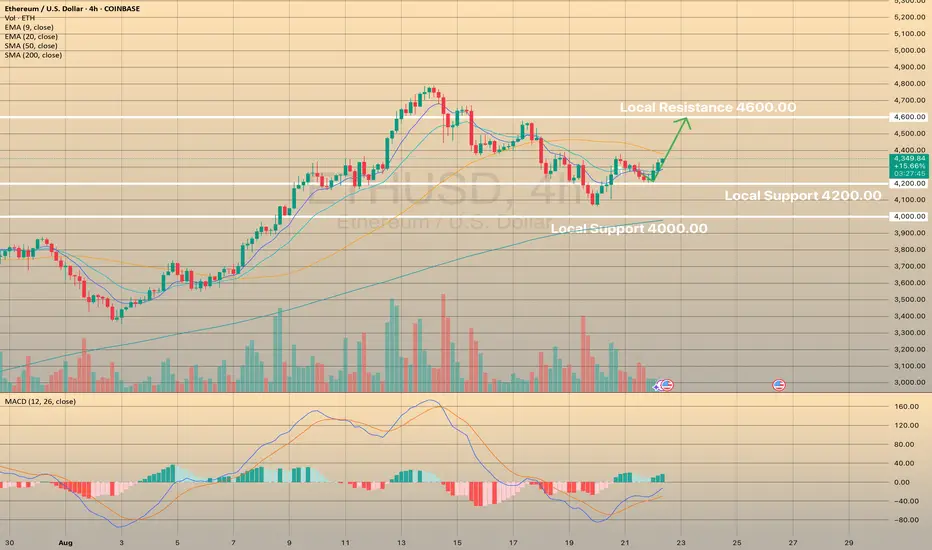
Ethereum is surpassing Bitcoin due to the anticipated approval by the SEC for spot ETFs, the increased adoption by companies, and the positive stance of the SEC regarding liquid staking tokens, which has sparked institutional interest.
Recently the asset managed to hold above the 4,200.00 level. Right now, ethereum is developing a new bullish momentum heading towards 4,600.00 local resistance. MACD has crossed and is in the green zone currently on 4-hour timeframe.
Ethereum - Here comes the final breakout!🚀Ethereum ( CRYPTO:ETHUSD ) breaks the all time high:
🔎Analysis summary:
Finally, after a consolidation of about four years, Ethereum is back at the previous all time high. With the recent rally of more than +200%, bulls are flexing their muscles, preparing the breakout. So far, everything is playing out according to plan with new all time highs soon.
📝Levels to watch:
$5.000
SwingTraderPhil
SwingTrading.Simplified. | Investing.Simplified. | #LONGTERMVISION

ETHUSD tries to develop another bullish impulseETHUSD tries to develop another bullish impulse
Fed Governor on DeFi: At the Wyoming Blockchain Symposium on August 20, Fed Governor Christopher Waller called DeFi and crypto payments "nothing to be afraid of," pushing for payment infrastructure collaboration. His pro-crypto stance, as a potential Fed chair, gains traction. Lummis on Crypto Bill: Senator Cynthia Lummis said the CLARITY Act, House-approved in July, could reach Trump by year-end with Senate tweaks, aiming for 2026 rollout. China’s Yuan-Backed Stablecoins: China may allow yuan-backed stablecoins to boost global use, reversing its 2021 ban. A late August roadmap review targets cross-border trade, with Hong Kong and Shanghai as hubs, to be discussed at the SCO Summit.
Technically, ETHUSD trades above the EMA20, trying to hold above this moving average. The MACD is in the green zone. The price may pullback towards 4,200.00 with a further bullish impulse towards 4,600.00 level.

BitMine's Ethereum Empire Grows Amid Market Swings: ETH Price AnBy adding 373,000 ETH, BitMine Immersion Technologies has increased its holdings of Ethereum (ETH) to around 1.52 million ETH (worth about $6.6 billion), therefore making it the biggest corporate ETH holder with control over around 1.3% of the supply in circulation. Despite a recent 14% drop in its stock price in light of market instability, BitMine's "alchemy of 5%" strategy aims to finally own 5% of all Ethereum. With its role in next-generation finance and artificial intelligence, the business notes increasing institutional interest in Ethereum and intends to use its ETH treasury for passive income in the future; meanwhile, it retains these assets in a highly liquid form.
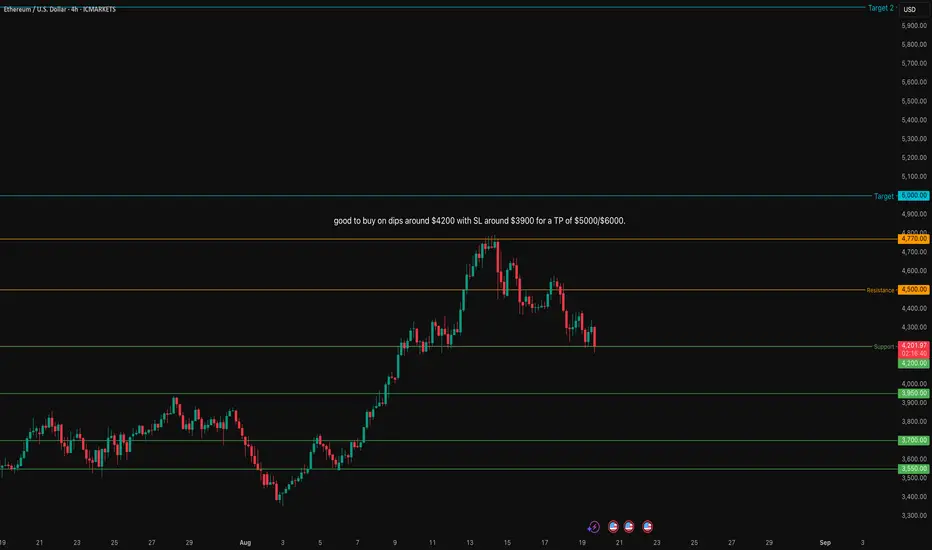
ETHUSD showed a minor pullback after four days of sell-off. It hits an intraday low of $4195 and is currently trading around $4306. Overall trend remains bullish as long as support $3500 remains intact. Watch out for $4500, any break above targets $4770/$5000/$6000. A robust bullish trend will only materialize above $5000.
Immediate support is around $4200. Any violation below will drag the price down to $3950/$3700/$3550/$3500/$3380/$3200/$3000. A breach below $3000 could see Ethereum plummet to $2770/$2500.
It is good to buy on dips around $4200 with SL around $3900 for a TP of $5000/$6000.
ETHUSD formed a bullish wedge, ready to reverseETHUSD formed a bullish wedge, ready to reverse
ETHUSD has been declining since August 14. During the last 2 days the asset started to trade within a narrow declining range, eventually forming a bullish wedge. Price came to an intermediate support level of 4,200.00, showing bullish divergence on the RSI on 30-m chart. Price is expected to rise towards local resistance of 4,400.00 and the upper border of the descending channel (highlighted with red).

Big Crypto Heist: ETH/USD Swing Plan Targeting 5200 Exit!🚨💎ETH/USD “Ethereum vs U.S Dollar” Crypto Heist Plan (Swing Trade)💎🚨
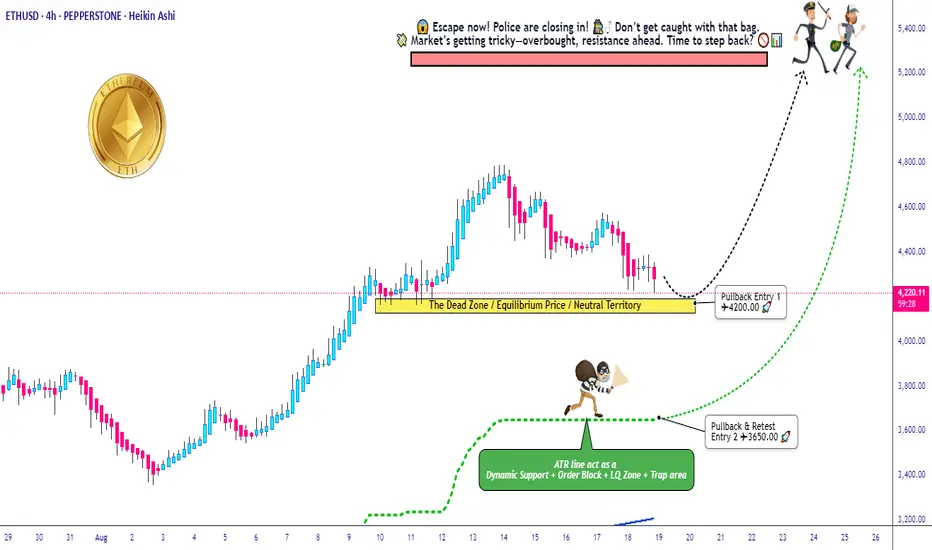
Dear Ladies & Gentlemen… my Thief OG’s 🕶️💰, the vault is open and the police are distracted — time for the Ethereum Heist Plan!
Entry Plan (Pullback Loot Zones)
Pullback Entry 1: 💵 4200.00
Pullback Entry 2: 💵 3650.00
Load your bags in layers (Thief layering strategy – multiple buy limit orders). Patience is the key, we strike when guards are weakest.
🛑 Stop Loss (Escape Route)
Entry 1 SL: 3850.00
Entry 2 SL: 3300.00
👉 Adjust your SL according to your risk appetite & strategy — every thief has their own escape route.
🎯 Target (Cash-Out Point)
Police barricade ahead! 🚔💨 Secure your loot & exit before capture:
Take Profit @ 5200.00 🤑💸
📜 Thief Note:
This ETH/USD setup is a bullish robbery mission 🕵️♂️. Market guards (bears) are getting weaker, giving us the opening. Our layered pullback entries ensure we don’t rush the vault — we strike smart, not desperate.
⚡ Always remember: news releases = alarm triggers 🚨. Stay sharp, use trailing stops, and never get too greedy.
💖 If this plan helps your heist bag grow — Hit the Boost Button 💥 and power up our robbery crew. Together, we raid the markets daily with the Thief Trading Style. 🏆💪💰
🚀 Stay ready, stay sneaky… The next target is always around the corner.
Ethereum - The moment of truth!🔬Ethereum ( CRYPTO:ETHUSD ) trades at a key breakout level:
🔎Analysis summary:
Ethereum - after consolidating for the past four years - is once again retesting the previous all time high. And before we will witness another bearish rejection, Ethereum has the chance to finally break out of the long term triangle pattern. It's time for us to start praying.
📝Levels to watch:
$4.000
SwingTraderPhil
SwingTrading.Simplified. | Investing.Simplified. | #LONGTERMVISION

ETH/USDT Grid Plan » Bullish Loadout » Stealing the Top🚨ETH/USDT Crypto Heist Plan 🔓💰
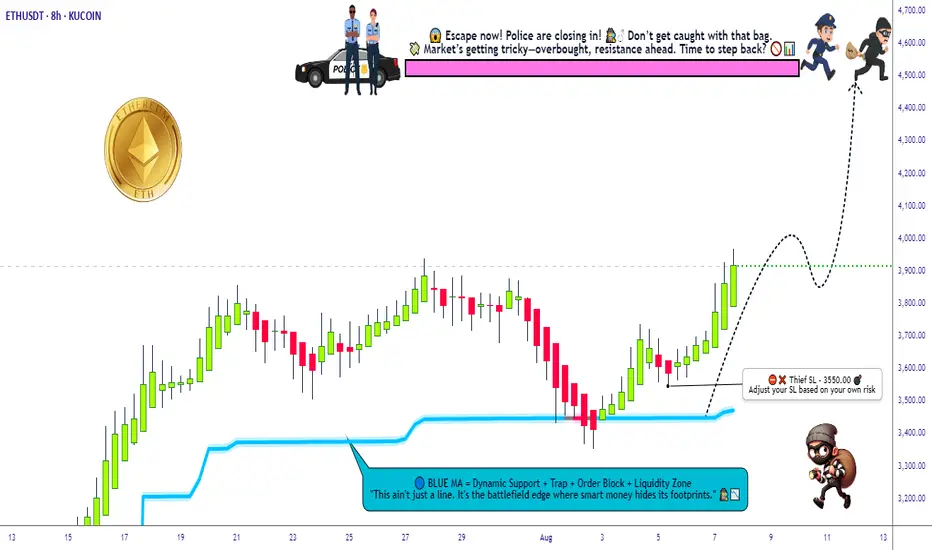
Asset: ETH/USDT "Ethereum vs Tether"
Plan: 🟢 Bullish – Multi-Layered Entry Grid
Strategy: Thief-style limit orders (GRID / DCA stacking)
Entry: Any Dip is a Heist Opportunity 💸
Stop Loss: 🔻 3550.00
Target: 🎯 4500.00
👋 Hey Thieves & Money Makers!
Get your gear ready – it's time to loot the Ethereum Vault 💎🚀
🔥Thief Trader's ETH/USDT Master Robbery Blueprint🔥
This ain’t your average plan — we break in with layered entries, lock in on breakout volatility, and ride the bullish train to the moon 🌕.
💼 Entry Strategy:
No need to overthink. Any dip = loot zone!
Stack multiple limit orders like a pro (15M–1H level).
We're playing the grid game. The more dips, the bigger the stash! 🧱🪙
🚨 Stop Loss:
Set SL at 🔻3550 or under recent swing lows.
Adjust by risk appetite and how many entries you stack.
Thieves don’t chase – they calculate risk.
🎯 Target Zone:
We're eyeing the 4500 mark. But remember – exit before the vault shuts if momentum slows. 🏃♂️💨💰
🔁 Scalpers Alert:
Only long. Only bullish. Only profit. 🧲💥
Stack it, trail it, and let it run with a sniper's precision. 🎯🧠
📊 Market Context:
ETH bulls gaining control post-accumulation.
Strong on-chain metrics, solid macro tailwinds.
Bears trapped in the shadows – we move in daylight. 🐂🆚🐻
📰 Warning – News Bombs Ahead!
💣 Avoid fresh positions during high-impact events.
🎯 Use Trailing SLs to protect your loot.
Smart robbers never get caught unguarded.
💥BOOST This Idea if you're part of the robbery crew 🔐💰
Every boost powers our next move.
Let's rob the crypto market together – one breakout at a time! 🏴☠️📈🤑
Thief Trader™ – Locking Targets. Looting Charts.
💎🕵️♂️📊 #CryptoHeist #ThiefStyle #ETHBreakout #GridGang #BullMode
ETHUSD: Above $4,300 – On the Way to New Heights!Market sentiment and triggers
The bullish momentum is strengthening: ETH has risen by 17% in a week and has broken through the $4,300-4,400 levels. Growing interest from institutional investors and ETFs is creating a solid fundamental basis.
Initiatives and regulatory drivers: Stablecoin legislation and SEC policy ("Project Crypto") make Ethereum attractive, with the prospect of a new high above $4,865.
Corporate purchases are in the works: companies like Bitmine Immersion and Sharplink Gaming are actively increasing their positions in ETH, which is further supporting demand.
Technical models and signals
A "bullish flag" is forming: the pattern looks like a pause before a new wave of growth. A breakout to the upside is the target for the monthly high near $4,900+.
Key support levels: $3,700 remains a solid foundation. A drop below $3,500-3,300 will be a risk for the current wave. Forecast spread: from $2,750 to $4,550 in August.
DailyForex forecast: momentum is aimed at $4,000 with key support/breakout zones at $3,400 (base) and $4,000 (upside barrier).
Long-term target possible up to $8,000: if ETH consolidates above $4,000 and the momentum continues, the $6,000 level and even $8,000 may soon come into view.

$ETH Surprised $4.7k and ATH breakout going to $5K✨ CRYPTOCAP:ETH Surprised $4.11K breakout going to Rocket $5K 🚀
Price will hit $5K on this month confirmed. previous post was price $4K see now. Who is Open long trade price at $4K ? just Hold it for $5K level.
🚦Vitalik Buterin Reclaims 'Onchain Billionaire' Status as CRYPTOCAP:ETH Surges Past $4,433
CRYPTOCAP:ETH co-founder Vitalik Buterin has once again joined the ranks of crypto's 10-figure holders, with his portfolio now valued at approximately $1.04 billion.
This milestone comes just days after ETH surpassed the $4,000 mark for the first time in eight months. Alongside Buterin, other prominent billionaires shaping the crypto and tech landscape include: Fred Ehrsam Co-founder of Coinbase and Paradigm, with an estimated net worth of $2.93 billion.
Volodymyr Nosov Founder and President of WhiteBIT Group, with wealth estimated between $6-$7 billion.
The Winklevoss Twins - Founders of Gemini exchange, each with an estimated personal net Worth of $2.7 billion. For more on notable figures like Larry Ellison, Bill Gates, and Mark Zuckerberg.
#Write2Earn #ETHETFsApproved #BinanceAlphaAlert #ETH4500Next? #SUBROOFFICIAL
Disclaimer: This article is for informational purposes only and does not constitute financial advice. Always conduct your own research before making any investment decisions. Digital asset prices are subject to high market risk and price volatility. The value of your investment may go down or up, and you may not get back the amount invested. You are solely responsible for your investment decisions and Binance is not available for any losses you may incur. Past performance is not a reliable predictor of future performance. You should only invest in products you are familiar with and where you understand the risks. You should carefully consider your investment experience, financial situation, investment objectives and risk tolerance and consult an independent financial adviser prior to making any investment.

ETHUSD - Technical picture The long-term trend remains bullish: Technical picture
The long-term trend remains bullish: The price is confidently holding above the 20-, 50-, 100- and 200-day moving averages, which indicates a stable uptrend.
TipRanks indicators:
Almost all key MAs (5-200 days) are showing a “Buy” signal, with the exception of MA20 (Sell).
The current price of Ethereum (~$4,188) is significantly above all MAs, which confirms growth.
RSI (14) — 58.75 (neutral), MACD — Buy, ADX — neutral, ROC — Buy.
Result — “Strong Buy”.
TipRanks
Price levels
ETH previously relied on EMA50 (support zone), and demonstrates a continuation of the uptrend on short-term timeframes.
Economies.com
Support and resistance levels
Resistance: Near the psychological mark of $4,000 — an important barrier, the breakout of which can trigger another growth round.
Support: The standard of the ongoing bullish trend is the EMA50, as well as the levels of $3,700–$3,800, where ETH demonstrated stability.
Result
The trend remains positive: ETH is confidently above all key MAs, MACD and other signals confirm the strength of the bulls.
The key level is $4,000: breaking it can return ETH to the growth zone.
RSI at 58.8 and MACD in the Buy zone confirm the potential. However, given the overbought conditions, a small correction or consolidation is possible.
Recommendation: long positions on a rebound from support with a target of $4,000+, or entry upon a confident breakout of the resistance level.

ETHUSD Buy !?I expect the price to retrace to approximately 4,190.37, after which the uptrend should resume with an initial price target of 4,265.43. What are your thoughts? Please share them in the comments.

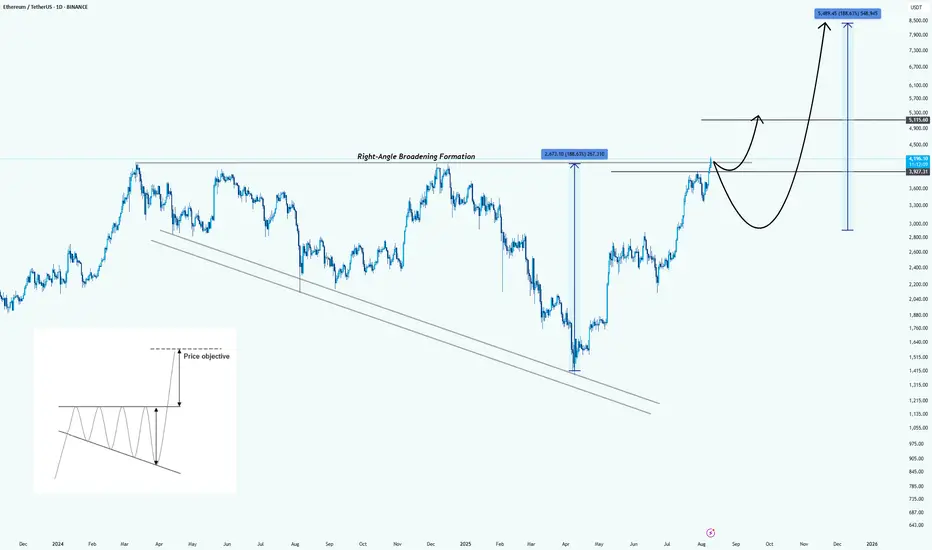
Ethereum: Formed a Right-Angle Broadening FormationHello guys!
Pattern Identified:
This is a Right-Angle Broadening Formation (characterized by a flat resistance level at the top (around $4,200 – $4,300) and a rising lower trendline). It shows increasingly volatile swings upward while repeatedly testing the same ceiling.
Technical Implication:
RABFs are typically bullish continuation patterns. The flat top acts as a breakout trigger, while the rising base indicates consistently higher lows and aggressive buyer support.
Price Objective:
According to the pattern’s measured move principle, the breakout target is projected by the vertical height of the formation, added to the breakout point:
Height : $2,070
Breakout point : $4,300
Target : $6,370 (first objective)
Extended bullish run could reach $8,500 if momentum sustains.
Key Levels:
Resistance: $4,200 – $4,300 (breakout trigger)
Support: $3,700, then $3,200
First measured target: $6,370
Extended target: $8,500
Bullish Scenario:
Strong daily close above $4,300 with volume could kickstart a rapid move toward the first target, possibly with only a brief consolidation at $5,100 before continuation.

ETH/USDT — Resistance Around $4.0k: Breakout or Rejection?Summary
The weekly chart shows Ethereum testing a multi-year horizontal resistance zone around $3.9k–$4.1k, a level repeatedly tested since 2021. The measured move on the chart projects a potential target of $4,868 — about +$868 or ~21–22% upside — if a confirmed breakout occurs on the weekly timeframe.
---
Technical Analysis (based on chart)
Timeframe: Weekly (1W). The current test is highly significant due to the higher timeframe, with medium- to long-term implications.
Key Levels:
Major resistance zone: ≈ $3,950 – $4,100 (yellow line).
Breakout target: $4,868 (≈ +$868 or ~+21–22% from the breakout zone).
First support if rejected: ≈ $3,300 – $3,600. Stronger support at $2,100 – $2,750.
Price Action: Price has made multiple peaks at this zone (multiple tops), signaling strong supply. However, recent higher lows suggest growing bullish momentum — if a breakout occurs.
Pattern: Multi-year horizontal resistance. Possible outcomes:
Rejection: Acts as a triple-top / horizontal supply zone.
Breakout: Transitions into a range breakout setup with measured target.
---
Bullish Scenario (confirmation needed)
1. Confirmation signal: Weekly close above $4.0k zone with strong follow-through in the next week.
2. Entry strategies:
Conservative: Wait for a retest (resistance → support) before entering, with stop below retest (~$3.7k).
Aggressive: Enter on breakout, stop below breakout candle low.
3. Target: First target ~$4,868 (measured move). If momentum persists, higher targets may be reached.
4. Invalidation: Weekly close back below $3.7k–3.8k after breakout.
---
Bearish Scenario (if rejection occurs)
1. Confirmation signal: Bearish rejection candle (pin bar / engulfing) on weekly + no breakout close.
2. Entry strategies: Short or take profit on longs after confirmed rejection; ideally backed by bearish follow-through next week.
3. Target downside: First support $3.3k–3.6k; stronger drop could retest $2.1k–2.8k zone.
4. Invalidation: Weekly close back above $4.1k with strong bullish volume.
---
Risk Management & Notes
Weekly close is key — avoid reacting solely to intraday wicks.
Volume matters: No volume = higher risk of false breakout.
Position sizing: Keep risk controlled (e.g., 1–2% per trade), stops in logical zones.
Multi-timeframe check: Use daily chart for precise entries and watch for orderflow/news catalysts.
---
Pattern Notes
Multiple Tops / Horizontal Supply: Sellers have consistently defended this level.
Ascending pressure: Higher lows into resistance can increase breakout probability.
Measured Move: Distance from breakout zone to target is about $868 — matching the chart’s projection.
---
Hashtags
#ETH #ETHUSDT #Ethereum #Crypto #Breakout #Resistance #WeeklyChart #CryptoAnalysis #TechnicalAnalysis

*Ethereum Cup and Handle Breakout with Bullish TargetsThis chart displays a classic *"Cup and Handle"* formation in Ethereum (ETH/USD) on the 30-minute timeframe. After forming a rounded bottom (cup) and consolidating (handle), price breaks out into an ascending channel, indicating bullish momentum.
Two clear bullish targets are projected:
- *1st Target:* 4,034.97
- *2nd Target:*4,164.52
Support and resistance levels are marked, and the structure suggests potential continuation toward higher highs if volume and momentum sustain. Ideal for short-term swing traders watching breakout patterns.
Pattern Observed:*
*Cup and Handle Formation*
- A bullish reversal pattern that signals a continuation of upward movement.
- The *cup* shows a rounded bottom, indicating market recovery from a downtrend.
- The *handle* (short consolidation) confirms buying pressure after the breakout.
---
*Price Action & Trend:*
- After breaking above the resistance (~3,580), price entered a *rising channel*, showing consistent higher highs and higher lows.
- The breakout is strong, confirming bullish momentum.
- Minor retracement or sideways movement expected before hitting target zones.
—
*Key Levels:*
- *Current Price:*3,910
- *Breakout Point:* ~3,580 (acted as neckline/resistance)
- *1st Target:*4,034.97 (short-term resistance)
- *2nd Target:* $4,164.52 (next major resistance level)
---
*Indicators & Signals:*
- *Trend:* Strong uptrend within channel
- *Volume (not visible but assumed):* Likely increased on breakout, which strengthens pattern confirmation
- *No signs of major reversal yet*, but RSI or volume checks would confirm if it's overbought or sustable

ETHUSD holds 3,550.00 support level and continues to grow.ETHUSD holds 3,550.00 support level and continues to grow.
Since August 1 the asset has been trading below the support level of 3,550.00. On Monday the asset broke through this level from below, establishing the false breakout of this level. A false breakout is when an asset’s price pops past a major support or resistance line but then flips back fast, not sticking with the move. It tricks traders into thinking a big trend’s kicking off, only to burn them when the price slides back to where it was.
On August 6 ETHUSD has successfully rebounded from the 3,550.00 support level and is currently developing short-term bullish momentum. The price is expected to grow towards 3,800.00 and 4,000.00 as a final target.

ETHUSD Market Structure and TrendMarket Structure and Trend
ETH has risen from around $2900 to around $3800 in July, breaking the important $4000 resistance level that has previously failed to be broken three times in 2024
ETH is trading in a tight price range of $3650–$3704, with the price above the EMA(25) ($3460), confirming the medium-term bullish trend
Indicators and Signals
EMA(7): $3739 — price below → short-term weakness signal; but above EMA(25) and EMA(99) (~$2832) → trend remains bullish
Stochastic RSI (6): ~1.6 — oversold level, signaling a possible rebound
RSI (according to TipRanks): around 76.7 — overbought, partially limits growth
ADX (14-day) on Barchart: around 17–23 — weak trend and consolidation
Support and resistance levels
Support:
$3616 — 3650 zone (lower boundary of the range and EMA(25)),
then $3460 (EMA25) and then $3460–$3300 if broken below
Resistance:
$3739 (EMA7),
above $3800,
key level $4000 — psychological and technical barrier,
further — historical maximum around $4800
Possible scenarios
Bulls
If the price holds above $3650 and stochastic RSI bounces up — growth to $3739 → $3780–$3800 is expected.
Breakthrough and holding above $3800 will open the way to $4000–$4100, and potentially higher, up to $4800+ if the market turns in favor of ETH
Bears
Consolidation below $3616 → possible movement to $3460 and lower to $3300+ with increased selling and weak volume
RSI above 70 may foreshadow a correction in the absence of further momentum.

Ethereum - Finally new all time highs!🔬Ethereum ( CRYPTO:ETHUSD ) will break out now:
🔎Analysis summary:
For more than four years, Ethereum has overall been moving sideways. However now Ethereum is once again retesting previous all time highs and preparing a bullish breakout. Multiple retests are generally considered bullish so the breakout is very likely to happen any time soon.
📝Levels to watch:
$4.000
🙏🏻#LONGTERMVISION
SwingTraderPhil

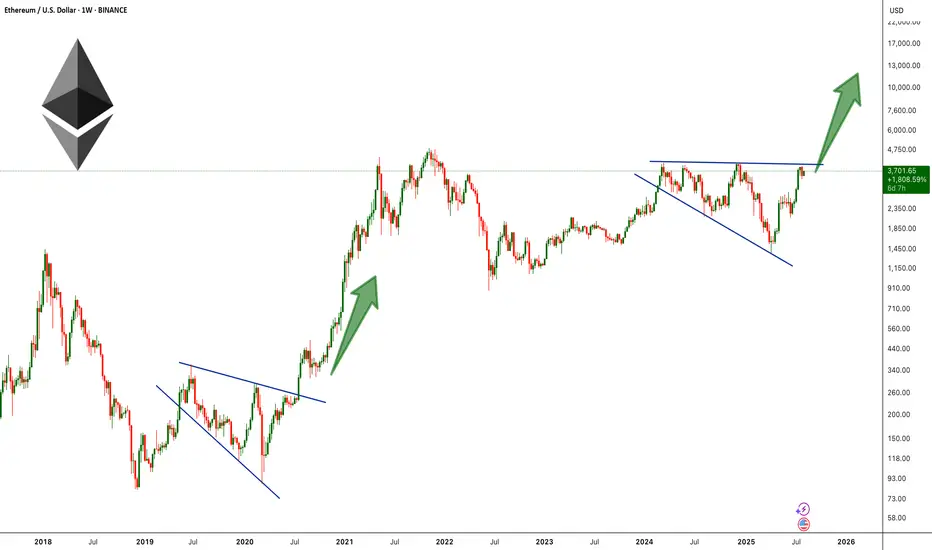
ETH Broadening Wedge Formation !BINANCE:ETHUSDT is forming a broadening wedge pattern on the weekly chart, a structure that often signals high volatility and strong momentum once the price breaks out. This setup is reminiscent of ETH’s 2019–2020 pattern, which also formed as a broadening wedge before breaking to the upside and triggering a historic rally to new all-time highs.
Currently, ETH is pressing against the upper resistance line of the wedge near the $3,900–$4100 zone, a level that has acted as major resistance multiple times in recent months. A decisive breakout above this barrier could ignite strong bullish momentum, opening the path toward the $6,000–$10,000 range.
Cheers
Hexa
Testing $3,500 Support, Rebound Ahead?Instrument: ETHUSD
Timeframe: Daily
Date: August 4, 2025
Analysis:
ETH fell 7.9% to $3,500 from $3,800, testing support after failing to break its high. The hawkish FOMC and rising BTC.D (62%) pressured altcoins. I entered the dip on $3,500, as shared on X and my previous report
Chart Setup:
Support: $3,500
Resistance: $3,600, $3,800

ETHUSDT - FUTURES SIGNAL FUTURES SIGNAL
Coin: ETH
Direction: LONG
🟢Input range: market/3578
✔️ТР: 3726/3902
❌SL: 3501
We work from the order block zone, in which I expect a price reversal.
