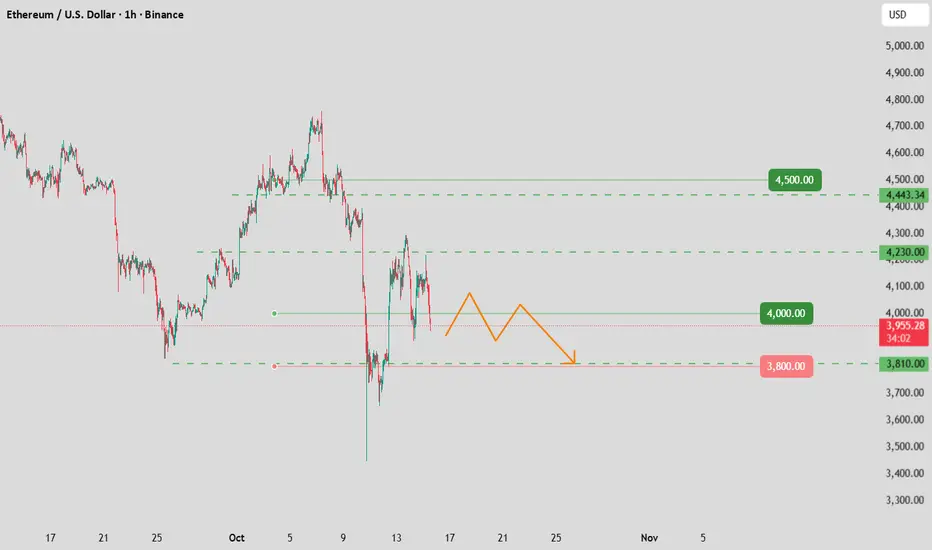
ETH Momentum Fades — Pullback Toward 3245 Expected📉 Ethereum Analysis — Pullback Setup Triggered
Ethereum has completed a sharp breakout above the previous consolidation range, pushing into the 3,350–3,365 resistance zone, but momentum has now slowed. Price is forming a potential M-top rejection, signaling a short-term reversal.
🔍 What the Chart Shows
Breakout from major accumulation range (left box).
Rising wedge / steep channel showing exhaustion at the top.
Current sideways mini-range showing loss of bullish pressure.
Ichimoku cloud below, aligning with the retest zone.
Arrow points toward the 3,245 support, which is the next high-probability retracement level.
📉 Short-Term Bias: Bearish Retracement
If ETH continues rejecting around 3,350–3,360, a clean drop into the 3,245 zone is likely as price fills the imbalance and retests cloud support.
📌 Key Levels
Resistance: 3,350 – 3,365
Immediate Support: 3,300
Main Target: 3,245
Breakout Origin: 3,110 zone
🎯 Overview
Momentum has cooled, buyers are losing strength, and structure hints at a corrective move. Expect ETH to dip before any fresh bullish continuation.
Ethusdshort

ETH USD SELL NOW 3182posting the sell trade based on sell side imbalance and buy side ineffiencicy
ETH USD SELL NOW 3182
Sl and TP are 1:4 RR

ETHUSD — Bearish Retracement Toward Demand ZoneETHUSD is currently trading inside a broader distribution structure, with price repeatedly rejecting the strong supply zone near the 3,230–3,260 area. Multiple seller zones, along with the breakdown from the recent range, indicate weakening bullish momentum.
Price has shifted from an earlier UTA uptrend channel into a more corrective DTA structure, showing clear signs of distribution. After failing to break above supply, the market is forming lower highs and consolidating near 3,120—suggesting bearish pressure is building.
If the current range fails to reclaim upside levels, ETHUSD is likely to continue its downward corrective move toward the marked support around 3,030. A deeper drop could extend to the 2,910–2,950 demand zone, which is the next strong liquidity pocket. This is where buyers previously stepped in aggressively, making it a high-reaction area.
Overall, structure favors downside continuation unless price reclaims the upper seller zone with strong bullish momentum.
If this chart helped you understand the market structure more clearly, show some support! Like the post, drop a comment, and follow the profile to get more consistent updates, smart money concepts, and high-quality trade setups.

Ethereum - Another -30% correction!🥊Ethereum ( CRYPTO:ETHUSD ) continues the bearmarket:
🔎Analysis summary:
Just over the past couple of weeks, Ethereum has already been correcting about -40%. This happened due to another failed all time high breakout sending prices lower. And Ethereum can drop another -30% before it will then retest a major confluence of support.
📝Levels to watch:
$2,500 and $ 2,000
SwingTraderPhil
SwingTrading.Simplified. | Investing.Simplified. | #LONGTERMVISION

ETHUSD | Don’t get fooled...Understand the chartTL;DR: This chart looks like what happened in 2021 in a ridiculous way. A breakout, a rejection, a relief rally, then a painful descent through layered support zones.
I really don’t want to be the guy who says “I told you so” but charts teach with loss as often as profit.
Look at what happened when ETH reached ATH in 2021. A clear breakout and immediate rejection. Price then collapsed with multiple spikes to trick HODLers and bull for life traders.
----------------------------------------------
The lesson the chart here to offer
If our analysis is correct, we’ll see a short-lived manipulation into resistance ($3.6–$4.0k) that will suck in all longs.
What happens next you may ask? Straight down to support zones.
Breaking one support usually leads to the next.
----------------------------------------------
Practical rules to survive this (educational only):
Assume rallies are traps until proven otherwise. Wait for structure (higher lows + higher highs) on higher timeframes before adding long positions.
Manage size. If you trade this, keep position sizing small and protect capital with stops and trailing stops when in a winning trade.
Use multi-timeframe confirmation. Don’t buy solely on daily candles. Micro structure of a daily candle forms on smaller timeframes.
If you want to accumulate, always scale. Don’t all-in. That way you better position yourself, increase your profit and decrease your loss
As always...Stay disciplined.
----------------------------------------------
Good Luck!
P.S: Check the linked idea for a better understanding.

ETHUSD – You have been warnedImagine you are on a high way speeding with a Porche 911 and running kinda low on gas, and you spot a station where you could get gas for free. You would fill 3 tanks right away, right?
That is exactly why market makers love this repeating pattern in a bearish market. Why?! Because its free "gas"...free liquidity.
descending channel → fake breakout → long manipulation → deeper bleed.
---------------------------------------------------
Look at what happened in 2024
Price broke above structure swing high, dragged liquidity, faked strength…
and instantly got rejected back down
That’s not bullish momentum. That’s a liquidity fuel for the market.
Markets do this right before a bigger move down.
---------------------------------------------------
To be honest, ETH chart is full of F U moves all over the place. But, the basic principles kinda remain intact.
In 2024 after the long manipulation, price fully respected the previous swing low.
And that should be the same case now with our swing low.
We are in a bearish trend, don't ego fight the market.
However, if price broke our previous swing low its literally free fall to $800~$1k
---------------------------------------------------
Your chart’s projection is clear:
Sweep the lows, Trap the late shorts, Send ETH flying back to $4k+
But not before the pain.
---------------------------------------------------
Good Luck!

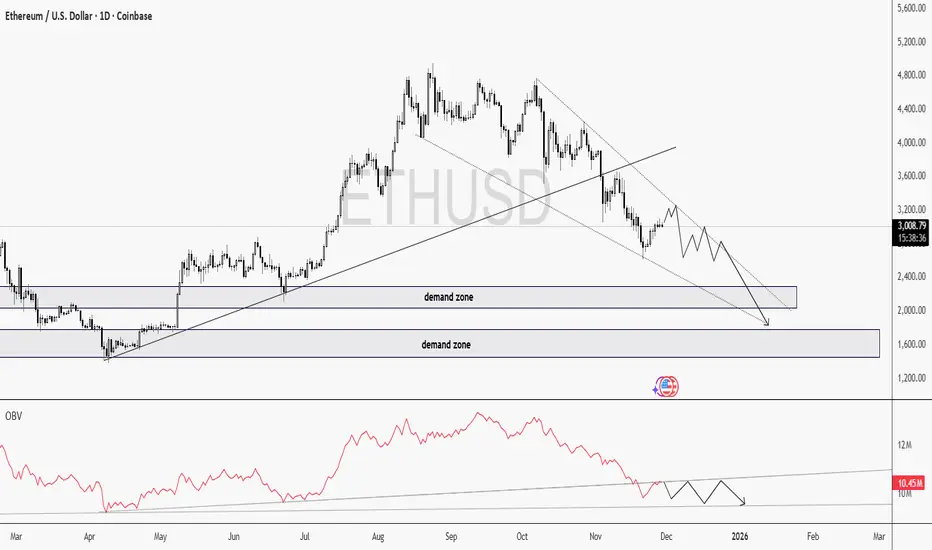
ETH Chart doesn't look prettyI see Ethereum’s chart not looking pretty for long nor hold positions at these prices.
Price Action
ETH continues to make lower highs and lower lows inside a descending wedge.
Price is moving toward two major demand zones, and the momentum is really weak. Just minor price hiccups.
I'm expecting some choppy or even consolidation movements before a possible test of the lower demand blocks.
OBV is such an underrated indicator!
Look at OBV, this is where the things gets interesting..
OBV is breaking its trendline downward, even while price hasn’t fully broken structure yet.
This is a classic sign of volume distribution. Smart money is exiting positions quietly.
When OBV breaks direction before price, it often predicts the next major move.
At the moment, ETHUSD is looking heavily bearish. Given the fact that BTC is also giving early signs of a bearish trend, I don't think buying ETH is a good idea here. I'll wait for a deeper correction.
Good Luck!
ETHUSD H4 | Bearish Reaction Off Key ResistanceMomentum: Bearish
Price is currently within the bearish ichimoku cloud.
Sell entry: 3,200.36
- Overlap resistance
- 50% Fib retracement
- 100% Fib projection
Stop Loss: 3,396.32
- Pullback resistance
Take Profit: 2,974.66
- Overlap support
High Risk Investment Warning
Stratos Markets Limited (tradu.com/uk ), Stratos Europe Ltd (tradu.com/eu ):
CFDs are complex instruments and come with a high risk of losing money rapidly due to leverage. 70% of retail investor accounts lose money when trading CFDs with this provider. You should consider whether you understand how CFDs work and whether you can afford to take the high risk of losing your money.
Stratos Global LLC (tradu.com/en ): Losses can exceed deposits.
Please be advised that the information presented on TradingView is provided to Tradu (‘Company’, ‘we’) by a third-party provider (‘TFA Global Pte Ltd’). Please be reminded that you are solely responsible for the trading decisions on your account. Any information and/or content is intended entirely for research, educational and informational purposes only and does not constitute investment or consultation advice or investment strategy. The information is not tailored to the investment needs of any specific person and therefore does not involve a consideration of any of the investment objectives, financial situation or needs of any viewer that may receive it. Past performance is not a reliable indicator of future results. Actual results may differ materially from those anticipated in forward-looking or past performance statements. We assume no liability as to the accuracy or completeness of any of the information and/or content provided herein and the Company cannot be held responsible for any omission, mistake nor for any loss or damage including without limitation to any loss of profit which may arise from reliance on any information supplied by TFA Global Pte Ltd.

Ethereum - A -40% crash comes first!🪄Ethereum ( CRYPTO:ETHUSD ) will soon reverse:
🔎Analysis summary:
Over the course of the past couple of months, Ethereum failed to create a new all time high. So eventually, we will see a bearish reversal and a major move lower in the future. The bullish triangle remains valid though, so it will be a major buying opportunity then.
📝Levels to watch:
$2,000 and $4,500
SwingTraderPhil
SwingTrading.Simplified. | Investing.Simplified. | #LONGTERMVISION

EthereumETHUSD
- Completed " 12345 " Impulsive Waves
- Consolidation Phase as an corrective pattern in Short Time Frame
- Break of Structure
- RSI - Divergence
- Change of Characteristics

ETHUSD – Bearish Channel Respect, Flag Breakdown SetupHi
The chart illustrates a clean, structured bearish trend where price continues to respect a broad descending channel. Each major reaction level and pattern aligns well with the larger downtrend, indicating that sellers are still in control.
Price recently tapped a key flip area near the upper boundary of the channel, a crucial zone where previous support has turned into resistance. The rejection from this area confirmed a strong supply and initiated a sharp decline, marked on the chart as the flagpole.
Following the impulse drop, the market entered a consolidation range, forming a classic bear flag structure. Price corrected roughly one-third of the flagpole; a typical retracement depth before continuation in a downtrend.
The drawn projection suggests a bearish continuation from the consolidation box, with the price expected to break lower. If momentum follows the channel’s trajectory, ETH could descend toward the first S&D zone, which aligns with the lower boundary of the macro channel. The marked target around 2848 sits near a liquidity and demand cluster, making it a logical tap point before any significant reversal or larger breakout attempt.
Disclaimer: As part of ThinkMarkets’ Influencer Program, I am sponsored to share and publish their charts in my analysis.

ETH Trend: 3000→2820→3400ETH has staged a minor rebound but is set for another sharp pullback.
Focus on the support at 3000 – a break below this level will lead to a further decline to around 2820, where strong support is anticipated.
It will then rebound and break above 3400 to resume the uptrend.
Accurate signals updated daily. They serve as a reliable guide for trading issues – feel free to refer to them. Hope they help!

ETHUSD Hits A Brick Wall!As a macro investor and chartist examining structures, I have not been fond of cryptocurrencies for a while now.
Since 2021, ETH has shown no trend. Just wild, reactive emotional moves all over the place. One thing is for sure, it does not like prices above $4,000
Yet another uptrend broken, being rejected out of $4,000 range again! This chart needs a deep pullback and to start fresh!
Bottom line: Nothing moves lower without a lower low. Keep an eye on it.

ETH-Daily : Bears in Control - Bulls Waiting for Right momentConsidering the liquidity that price may still sweep, Ethereum’s daily structure remains bearish for now, with a possible drop toward 3000 and a potential rebound from the 2700–2900 area.

ETH/USD: Latest Wave Impulse (5) or Extended Correksi Slide?ETH/USD: Latest Wave Impulse (5) or Extended Correksi Slide?
📈 Weekly Scenarios
Bullish scenario: ETH holds the ~$3,800 zone, then breaks through ~$4,500 → wave (5) begins → moves towards ~$5,000+.
Consolidation: The price moves in the ~$3,800–$4,500 range without a clear breakout.
Bearish scenario: Breakout of support at ~$3,800 with volume → corrective wave A-B-C → target ~$3,400–$3,600.
✅ Conclusion
The weekly analysis of ETH/USD shows that the market is at a key point: either a strong rally (wave (5)) is beginning, or a correction is underway.
Holding support at ~$3,800 is critical for the bulls.
A breakout of resistance at ~$4,500 will provide upward momentum.
A breakout below ~$3,800 is a signal for caution and a possible decline.

ETH/USD: Is Ethereum Entering Wave V or Preparing for a ReversalETH/USD: Is Ethereum Entering Wave V or Preparing for a Reversal?
Weekly Scenarios
Bullish scenario: ETH holds the $3,800 level, breaks $4,500 → target near $5,000.
Consolidation: The price fluctuates between $3,800 and $4,500, preparing for the next move.
Bearish scenario: Break of support at $3,800 with volume → possible decline to $3,400–$3,600.
✅ Conclusion
The weekly analysis of ETH/USD shows that the market is at a key point: either the final uptrend is starting, or a correction is forming.
Holding support near $3,800 is the main bullish signal.
Break of resistance at $4,500 is the start of a rally.
A break below $3,800 is a signal for caution and a possible decline.

ETHUSD: Last Wave of Impulse or Start of a Big Correction?Weekly Scenarios
Bullish scenario:
ETH holds above ~$3,800 and breaks resistance at ~$4,500 → wave factor (5) intensifies → possible rise to ~$5,000.
Consolidation:
The price remains between ~$3,800 and ~$4,500, forming a sideways range, accumulating energy for the next move.
Bearish scenario:
Breakdown of support at ~$3,800 with volume confirmation → corrective wave A-B-C begins → test of ~$3,400–3,600.
✅ Conclusion
ETH/USD is at a key point for the coming week: either the bullish upward momentum ends, or a significant correction begins.
Watch for support at ~$3,800 to hold—a breakout could very well change the direction of the movement.
If the resistance at ~$4,500 is broken, the upward momentum will activate.
Primary targets: ~$5,000 if up, ~$3,400–$3,600 if corrected.

ETH: Still be a need for a pullback📈The closing price yesterday failed to hold above 3,950. There will still be a need for a pullback.
♦Market sentiment remains cautious, with long and short sides locked in a stalemate. From a technical pattern perspective, there is a trend of lower highs and lower lows in prices. If the current structure cannot be broken, market risks will persist.
💎
Buy 3855 - 3860 TP 3870 - 3890 - 3910 SL 3845
Sell 3900 - 3910 TP 3890 - 3870 - 3850 SL 3920
Daily-updated accurate signals are at your disposal. If you run into any problems while trading, these signals serve as a reliable reference—don’t hesitate to use them! I truly hope they bring you significant assistance

Ethereum's pullback is not yet over.From a technical standpoint, Ethereum’s previous strong upward structure has been notably disrupted amid this pullback. The 1-hour K-line chart shows that after failing to break through the 4,788 high, ETH closed multiple consecutive long-bodied bearish candles. Its price has sequentially breached the MA5, MA20, and MA60 moving averages, marking a reversal in the short-term trend.
After the MACD indicator formed a "death cross" at a high level, the fast line has crossed below the zero line and entered the bearish zone. The green bearish momentum bars continue to expand, indicating that the short-term adjustment is not yet complete.
Today, Ethereum’s price is struggling to hold above the medium-term moving average. A break below this level could trigger a deeper decline.
Ethereum (ETH/USD) – Bearish Rejection Expected from ResistanceHere’s a detailed technical analysis of your Ethereum (ETH/USD) 4H chart 👇
🔹 Chart Overview
Timeframe: 4H
Current Price: ≈ 3,983
Resistance Zone: 4,314 – 4,583
Target Level: 2,766
Pattern: Downward channel (bearish trend continuation)
🔹 Price Structure
Price is moving within a descending channel, meaning the overall trend remains bearish.
After touching the lower trendline, ETH rebounded and is now testing the upper channel resistance zone between 4,314–4,583.
🔹 Key Levels
Resistance Zone:
This zone is critical; it aligns with both the upper channel boundary and a prior supply zone.
If price gets rejected here → confirms continuation of downtrend.
Support / Target:
The projected target level is around 2,766.75, which aligns with the lower boundary extension of the channel.
🔹 Market Bias
As long as ETH stays below 4,314, the bearish sentiment dominates.
A clean break and close above 4,583 would invalidate the bearish setup and could shift sentiment bullish toward 4,800+.
🔹 Possible Scenarios
1. Bearish Scenario (High Probability):
ETH rejects from resistance zone (4,314–4,583).
Downward move continues toward 3,500 → 3,000 → final target 2,766.
2. Bullish Reversal (Low Probability unless breakout):
Strong breakout above 4,583 with volume.
Next resistance near 4,950–5,000.
🔹 Summary
📉 Trend: Bearish
⚠ Watch Zone: 4,314–4,583 (short opportunity if rejection forms)
🎯 Downside Target: 2,766
🔄 Invalidation: Break and close above 4,583

BTH: Support Above 3800Today, after experiencing a sharp drop at the opening, the price of Ethereum found support above 3,800 and rebounded. Both attempts to test the bottom failed to break through the support at 3,800, which proves that the support here is solid. Then it entered a trend of slight oscillation and rebound. The long-short game is still relatively fierce. The subsequent trend needs to pay attention to the breakthrough of the key level of 4,000 and the effectiveness of the upper and lower support and resistance.
Buy 3930 - 3940 TP 3955 - 3965 - 3975 SL 3925
Sell 4015 - 4020 TP 3990 - 3980 - 3970 SL 4025
Daily-updated accurate signals are at your disposal. If you run into any problems while trading, these signals serve as a reliable reference—don’t hesitate to use them! I truly hope they bring you significant assistance

ETH: high-level consolidationAfter last week's sharp decline, the price began to rebound over the weekend and broke above 4,000. Today, it entered a high-level consolidation phase. This indicates that bullish forces have strengthened recently and are trying to push the price higher. Overall, today's trend shows that the bulls have started to counterattack, but the overall situation is still uncertain. Given the market's uncertainty, it is essential to set strict stop-losses and control positions when trading to guard against risks from sharp price fluctuations.
Buy 4020 - 4030
TP 4040 - 4050 - 4060
SL 4010
Daily-updated accurate signals are at your disposal. If you run into any problems while trading, these signals serve as a reliable reference—don’t hesitate to use them! I truly hope they bring you significant assistance
