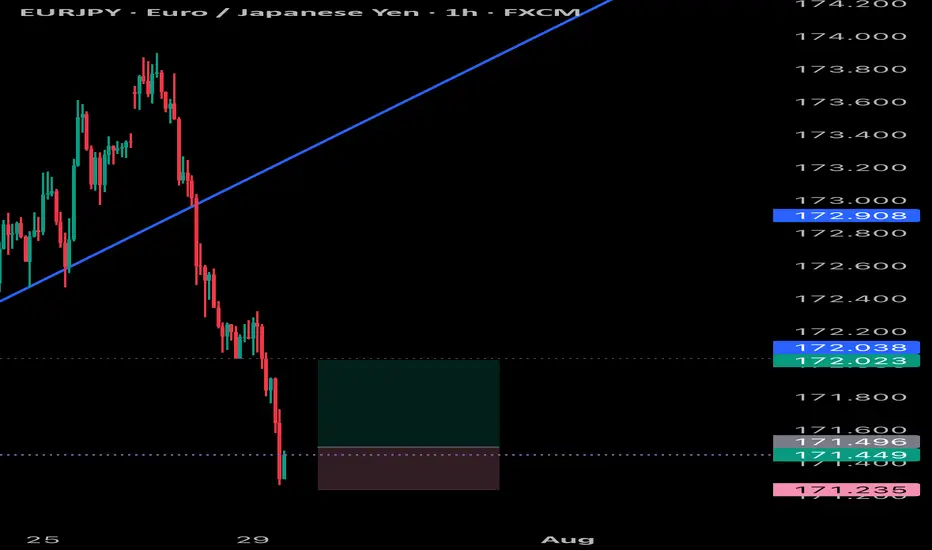
EURJPY LONG After seeing price reject 170.000 monthly area of institutional support we saw a sharp push to the upside on the weekly timeframe from last week and we could see the market push to the upside not that the 4hr broke area of structure resistance
EURJPY

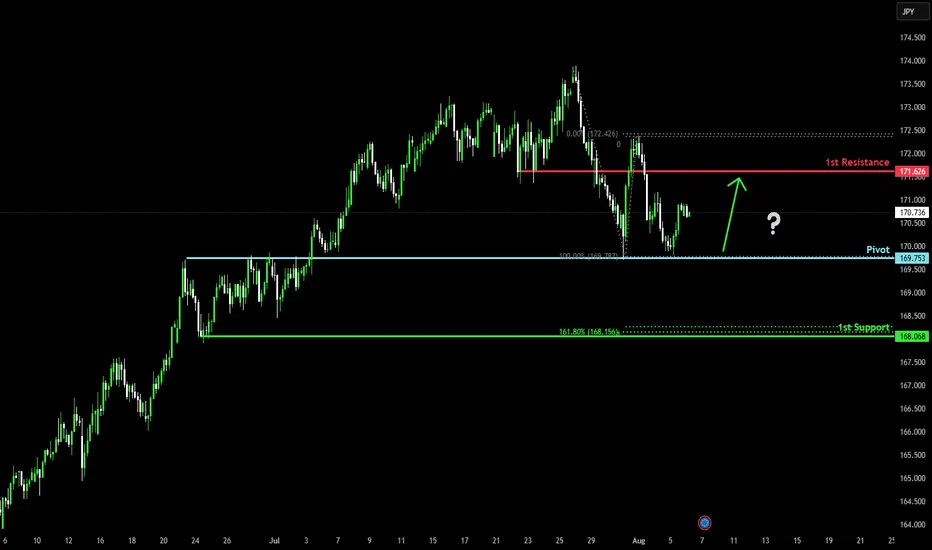
Bullish bounce off?EUR/JPY has bounced off the pivot which has been identified as an overlap support and could rise to the 1st resistance.
Pivot: 169.75
1st Support: 168.06
1st Resistance: 171.62
Risk Warning:
Trading Forex and CFDs carries a high level of risk to your capital and you should only trade with money you can afford to lose. Trading Forex and CFDs may not be suitable for all investors, so please ensure that you fully understand the risks involved and seek independent advice if necessary.
Disclaimer:
The above opinions given constitute general market commentary, and do not constitute the opinion or advice of IC Markets or any form of personal or investment advice.
Any opinions, news, research, analyses, prices, other information, or links to third-party sites contained on this website are provided on an "as-is" basis, are intended only to be informative, is not an advice nor a recommendation, nor research, or a record of our trading prices, or an offer of, or solicitation for a transaction in any financial instrument and thus should not be treated as such. The information provided does not involve any specific investment objectives, financial situation and needs of any specific person who may receive it. Please be aware, that past performance is not a reliable indicator of future performance and/or results. Past Performance or Forward-looking scenarios based upon the reasonable beliefs of the third-party provider are not a guarantee of future performance. Actual results may differ materially from those anticipated in forward-looking or past performance statements. IC Markets makes no representation or warranty and assumes no liability as to the accuracy or completeness of the information provided, nor any loss arising from any investment based on a recommendation, forecast or any information supplied by any third-party.
EUR/JPY Channel Formation (6.08.2025) The EUR/JPY Pair on the M30 timeframe presents a Potential Selling Opportunity due to a recent Formation of a Channel Pattern. This suggests a shift in momentum towards the downside in the coming hours.
Possible Short Trade:
Entry: Consider Entering A Short Position around Trendline Of The Pattern.
Target Levels:
1st Support – 169.74
2nd Support – 169.25
🎁 Please hit the like button and
🎁 Leave a comment to support for My Post !
Your likes and comments are incredibly motivating and will encourage me to share more analysis with you.
Best Regards, KABHI_TA_TRADING
Thank you.
Disclosure: I am part of Trade Nation's Influencer program and receive a monthly fee for using their TradingView charts in my analysis.


EUR_JPY SUPPORT AHEA|LONG|
✅EUR_JPY is going down now
But a strong support level is ahead at 169.757
Thus I am expecting a rebound
And a move up towards the target of 170.400
LONG🚀
✅Like and subscribe to never miss a new idea!✅
Disclosure: I am part of Trade Nation's Influencer program and receive a monthly fee for using their TradingView charts in my analysis.

EURJPY Will Go Down From Resistance! Short!
Please, check our technical outlook for EURJPY.
Time Frame: 12h
Current Trend: Bearish
Sentiment: Overbought (based on 7-period RSI)
Forecast: Bearish
The market is approaching a significant resistance area 170.468.
Due to the fact that we see a positive bearish reaction from the underlined area, I strongly believe that sellers will manage to push the price all the way down to 168.585 level.
P.S
Overbought describes a period of time where there has been a significant and consistent upward move in price over a period of time without much pullback.
Disclosure: I am part of Trade Nation's Influencer program and receive a monthly fee for using their TradingView charts in my analysis.
Like and subscribe and comment my ideas if you enjoy them!

EURJPY 4hour TF - August 3rd,2025🟦 EURJPY 4H Analysis Bearish Idea
📅 August 3, 2025
🔹 Top-Down Trend Bias:
• Monthly – Bullish
• Weekly – Bullish
• Daily – Bullish
• 4H – Bearish
EURJPY has pulled back through the previous support zone around 171.000 and is currently consolidating after a sharp bearish move. Short term trend remains bearish, but higher timeframes suggest this may be a corrective phase.
🔍 Key Zone: 171.00 – 171.70
This zone represents the 38.2% fib retracement and prior structure. A rejection from this area could trigger further downside, while a break above may confirm a higher low.
✅ Scenario A: Bearish Continuation (Blue Path)
1.If price taps into 171.00–171.70 and rejects
2.Look for bearish confirmation (rejection wick, bearish engulfing, BOS)
Target: 169.60 (key support)
This setup follows short term momentum and offers clean R:R into prior liquidity.
⚠️ Scenario B: Bullish Break & Hold (Orange Path)
1.If price breaks and closes above 172.250
2.Watch for continuation toward 173.750, our extended fib target
3.Structure shift + bullish PA would align with HTF bullish trend
This would confirm strength returning to the pair, ideal for HTF trend continuation traders.
🧠 Final Notes
• 171.00–171.70 is the reaction zone to watch
• HTFs remain bullish, but 4H momentum must flip to validate upside
• Let price confirm direction

EUR/USD Reversal or Trap? 4H Clean Breakdown InsidePrice just tapped into a high-probability sell zone after a corrective Wave 2 structure. With sellers already active at 1.16342 and 1.17635, this setup is not just textbook—but a potential goldmine for swing traders.
🔻 Is this Wave 3 continuation about to begin?
🔍 Liquidity swept. Zones respected. Structure still bearish.
⚠️ Many traders will miss the bigger picture here—will you?
👇 Drop your thoughts:
Are we about to break 1.13000?
Do you agree with the Elliott Wave count?
What’s your bias on DXY?
💬 I personally reply to every comment—let’s build this chart together.
🔥 If you caught the entry, show your entry point and reasoning—let’s level up as a team.

Trading the Pullback on EURJPY My Trade PlanThe EURJPY is clearly in a strong bullish trend 📈, as shown by a consistent pattern of higher highs and higher lows on the 1H timeframe ⏱️. In this video, I’m looking to capitalize on a pullback as a potential buy opportunity 🎯.
We dive into my entry strategy, explore how to align with the prevailing trend, and break down key concepts such as price action, market structure, and smart pullback zones 🧠📊.
⚠️ As always, this is for educational purposes only — not financial advice.

How I’m Trading the EURJPY Break of Structure Setup📈 EURJPY Analysis Update 🔍
I'm currently watching EURJPY closely. On the weekly timeframe, the pair is clearly in a strong bullish trend 🚀. Price has recently tapped into a previous daily bullish order block 🧱 — a key zone of interest.
Now, I’m watching for a break of structure (BoS) 📉 followed by a bullish continuation, especially if price pulls back into the fair value gap (FVG) 📊 near the current low.
As always, this setup — along with all key details and trade considerations — is fully broken down in the 🎥 video.
⚠️ This is for educational purposes only and not financial advice.

EURJPY SELLas the main trend line is brake and the lower low is accepted. I think it moves down and good for sell
EURJPY

EUR/JPY BEARISH BIAS RIGHT NOW| SHORT
Hello, Friends!
We are now examining the EUR/JPY pair and we can see that the pair is going up locally while also being in a uptrend on the 1W TF. But there is also a powerful signal from the BB upper band being nearby, indicating that the pair is overbought so we can go short from the resistance line above and a target at 168.581 level.
Disclosure: I am part of Trade Nation's Influencer program and receive a monthly fee for using their TradingView charts in my analysis.
✅LIKE AND COMMENT MY IDEAS✅

EURJPY SWEET BLUESEurjpy has hit all take profits with very little drawdown and huge profits very quickly nice pattern, simply followed

EURJPY: Short Trade Explained
EURJPY
- Classic bearish formation
- Our team expects pullback
SUGGESTED TRADE:
Swing Trade
Short EURJPY
Entry - 171.66
Sl - 172.11
Tp - 170.81
Our Risk - 1%
Start protection of your profits from lower levels
Disclosure: I am part of Trade Nation's Influencer program and receive a monthly fee for using their TradingView charts in my analysis.
❤️ Please, support our work with like & comment! ❤️

EURJPY Bullish Setup : EURJPY Forecast + Demand Zone🧠 Introduction: What's Happening on the Chart?
Today’s analysis on EURJPY is built on the MMC trading framework, which emphasizes the identification of institutional supply and demand zones, reaction points, QFL patterns, and volume bursts to map out high-probability trading paths.
We are currently observing a market in a corrective phase following a significant bearish drop. However, the presence of a major demand zone, along with a positive bullish pattern, suggests potential upside reversal or at least a short-term retracement.
🔍 Technical Breakdown – Zone by Zone
🔻 1. The Drop from 2x Supply Zone
EURJPY experienced a significant decline from the 173.60–174.00 area, which acted as a 2x confirmed supply zone.
Sellers took control with strong bearish candles that broke through previous minor support levels.
This drop was impulsive, showing momentum-driven selling, often linked with institutional activity.
🟩 2. Demand Reaction at Major Zone
Price entered a key demand zone marked in green (170.80–171.00), where historically buyers have stepped in.
A "Volume Burst" is visible here—large volume candles with long wicks to the downside, which typically indicate accumulation.
A positive pattern (possibly engulfing or a pin bar structure) has formed, signaling a potential bullish reversal or relief rally.
🧱 3. QFL Structure (Quantum Flat Line)
The chart highlights a QFL base, where the price consolidates after an initial drop, then continues lower before a sharp bounce.
QFL is often used to identify trap zones where retail traders are shaken out, and smart money enters.
The recent bounce from the QFL base suggests smart money might be accumulating for a reversal move.
📐 Key Levels and Zones
Type Zone/Level Role
🔵 Volume Burst Area ~170.80–171.00 Aggressive buyer entry; accumulation zone
🟢 Major Demand 170.80–171.20 Key structural low supporting bullish bias
🟠 SR Flip Zone 171.80–172.00 Crucial breakout/retest level
🔴 Minor Resistance 172.60–173.00 Short-term pullback zone
🟥 2x Supply 173.60–174.00 Strong reversal point; ideal target
🔁 Scenarios to Watch
📈 Scenario 1: Bullish Breakout and Rally (Blue Box 1)
If price breaks above 172.00, we expect:
A potential retest (bullish confirmation).
Continuation toward minor resistance at 173.00, and possibly the 2x supply zone at 174.00.
This aligns with the positive pattern formed at the base and the idea of a market rotation from bearish to bullish structure.
📉 Scenario 2: Rejection and Retest of Lows (Blue Box 2)
If the price fails to sustain above 172.00, sellers may step in:
Price could revisit the major demand zone again or even break down to 170.50.
This would invalidate the bullish setup in the short term and imply a larger continuation of the bearish trend.
🧠 Strategic Insights (MMC-Based Thinking)
The MMC approach teaches us to mirror the market’s emotion and behavior.
In this case, we see signs of:
Panic selling → smart money accumulation.
Institutional traps (QFL drop) → bullish absorption.
Traders applying MMC would anticipate reactive setups at the SR Flip Zone to determine next directional bias.
💡 Trade Ideas (For Educational Purposes Only)
Strategy Entry SL TP1 TP2
Aggressive Long 171.30–171.50 170.70 172.50 173.50
Breakout Retest Long 172.10 (after breakout) 171.50 173.00 174.00
Sell on Rejection 172.00 (bearish confirmation) 172.60 171.00 170.40
📌 Conclusion & Final Thoughts
EURJPY is showing a potential bullish reversal setup from a well-defined demand zone, supported by volume bursts and positive price action patterns. However, the SR Zone at 172.00 remains the key pivot—how the price reacts here will determine whether we see a deeper pullback or a continuation to test upper resistance levels.
Stay flexible and responsive. Let the market give confirmation before execution. As always, follow proper risk management and trade the reaction, not the prediction.

UP TREND EURJPYEurjpy will be buying and scalping will be moving my SL to BE or swing with it all the way to the top as it cannot sell forever

EURJPY 300+ PIP DROPFrom the beginning of the week i have called out shorts on EJ into 170.000 in the video we can see price hit that support and hitting target for a few positions and entry i called out during the week and also some key points for your personal trading

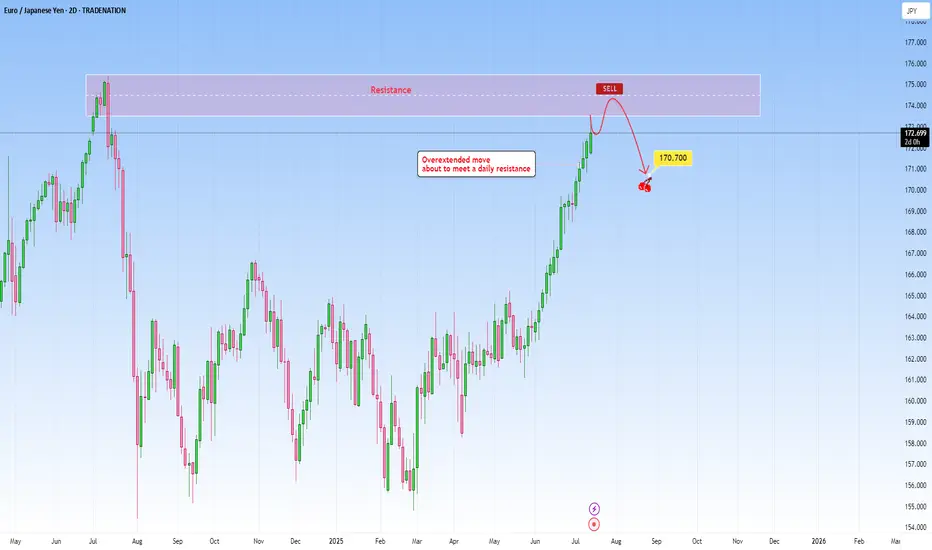
EURJPY: Overextended move to meet daily resistanceThe current market context on EURJPY shows an overextended move that has been pushing higher as price is about to reach a well-established daily resistance. The rally into this resistance lacks healthy retracements, and momentum is likely unsustainable without a deeper correction. The probability of a pause or reversal here under this circumstances increases substantially.
This extension exaggerates this imbalance making it a high probability setup. Volume and price action near this level becomes critical in this case. Signs such as long upper wicks, bearish engulfing patterns will hint that the move may be running out of steam.
I would be targeting a decent pullback towards 170.700.
Just sharing my thoughts for the charts, this isn’t financial advice. Always confirm your setups and manage your risk properly.
Disclosure: I am part of Trade Nation's Influencer program and receive a monthly fee for using their TradingView charts in my analysis.
EUR/JPY Again Below My Res , Short Setup Valid To Get 150 Pips !Here is my opinion on EUR/JPY On 2H T.F , We have a fake breakout and Gap and the price back again below my res area and closed with 4H Candle below it , so i have a confirmation and i`m waiting the price to go back to retest this strong res and give me any bearish price action and then we can enter a sell trade and targeting 100 : 150 pips . if we have a daily closure above my res then this analysis will not be valid anymore .

EURJPY ANALYSISAfter seeing the daily still pushing to the downside and breaking below key support of 171.250 we could be looking out for a retest and continuation to the down side target of 170.000

JPY at Key Zone – EURJPY & GBPJPY Could Drop 1k+ PipsExactly one year ago, the JPY Currency Index broke above the falling trendline of a falling wedge, signaling the end of a bearish cycle that had lasted nearly five years.
As is typical after long-term reversals, the reaction was sharp and fast, and the price quickly reached the first resistance target of the pattern.
Since then, the index entered a lateral phase, with clear support forming around the 730 zone.
________________________________________
🔍 Current Price Action
Recently, the price pulled back to test that same support, and at the time of writing it sits at 737, forming a tight consolidation.
This suggests we’re again at an inflection point.
________________________________________
📊 Trade Outlook
From a medium-term perspective, I believe the index is preparing for another leg higher, potentially toward resistance at 780.
➡️ That would mean a 7% rise on the JPY Index – and this move could translate into more than 1,000 pips of downside for pairs like EURJPY and GBPJPY.
________________________________________
🔄 What’s Next?
In the coming sessions, I’ll focus on these two pairs as they offer the clearest setups and have the strongest volatility.
Stay tuned — follow for the next updates. 🚀

EUROYENEurjpy has shorter pullbacks within an ascending structure ,shall keep following it and expect it to reach a fair mount of highs or levels

EURJPY SCALP Eurjpy quick scalp trade as it can still drop so it would be wise to not target higher than normal take profits , but will scalp it