EURJPY Forming Bullish MomentumEUR/JPY is clearly showing a strong bullish phase, as price has broken above a key resistance area around 174–176 JPY and is now extending higher. That old supply zone has flipped into support, giving the euro a firm base to launch further gains. The chart structure suggests that EUR may have room to rally toward the 182–184 region if momentum continues to favor upside.
Fundamentally, the euro is benefitting from a clear divergence in central bank policy. The European Central Bank is likely staying more accommodative, while the Bank of Japan continues to tread carefully despite having raised rates to 0.5%. This divergence is pushing capital into euro-denominated assets and weakening the yen.Meanwhile, Japan’s import costs are under pressure due to the weak yen, which adds inflationary risk and could constrain BoJ’s flexibility.
On the rate-expectations front, markets are pricing in possible further BoJ tightening, but there remains uncertainty on timing. Some analysts argue that Japan’s real rates remain deeply negative once adjusted for inflation, which could limit how much upside the yen can recover in the near term. ( ) This raises a tension between nominal hikes and real-rate dynamics, making the yen’s path forward less straightforward.
EURJPY

BACK TO BACK PROFITS EURJPY We’ve had back to back trades taken on Eurjpy and we managed to make sure they were all successful, we will keep following what the market shows us and take opportunities when presented to us

Stop!Loss|Market View: EURUSD🙌 Stop!Loss team welcomes you❗️
In this post, we're going to talk about the near-term outlook for the EURUSD currency pair☝️
Potential trade setup:
🔔Entry level: 1.15351
💰TP: 1.14184
⛔️SL: 1.15903
"Market View" - a brief analysis of trading instruments, covering the most important aspects of the FOREX market.
👇 In the comments 👇 you can type the trading instrument you'd like to analyze, and we'll talk about it in our next posts.
💬 Description: The main scenario for selling via a breakout of the 1.15500 - 1.16000 support area remains. The USD is gaining momentum and is likely to continue strengthening in the medium term. Against this backdrop, a shorter-term sell-off is being looked for. The lows from early this week serving as a potential sell entry point. Downside targets are considered as low as 1.14000.
Thanks for your support 🚀
Profits for all ✅

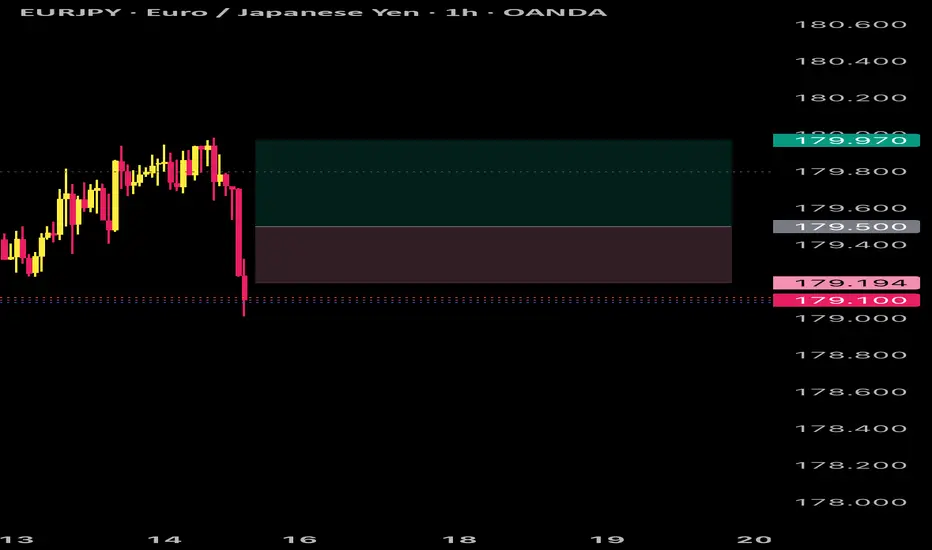
EURJPY⬇️ Sell Entry: 179.750
⏹️ Stop Loss: 180.550
*️⃣ Take Profit-1: 178.850
*️⃣ Take Profit-2: 178.250

HUGE PROFITS EURJPY Eurjpy in huge profits , hitting (TAKE PROFITS) and now will continue to the upside looking to take more trades in future


EURJPY Forms Rare Reversal, Aiming For Price Gap??OANDA:EURJPY has formed a rare Reversal Pattern, the Three Drives Pattern, lets break it down!
The Three Drives Pattern consists of 3 Bullish attempts to continue pushing price higher. The 3rd attempt is a Fibonacci Extension of the DE Leg giving us Point F where Price, encountering Resistance at the 138.2% Extension @ 180.008, should reverse and head lower!
We can see starting the week that OANDA:EURJPY is opening below this level and if Price is unable to move higher, we can expect it to fall from here!
When it does, there is a big Price Gap in the 174.712 - 173.249 Range to fill with the Low or Point A being the next line of support @ 172.260 being the Price Target!
This could generate a great Short Opportunity!

EURJPYEurjpy buy opportunity, using buy stop will wait for the trade to open , always keeping trading simple and straightforward remember to maximise profits and have a safety Stop Loss

EURJPY: Strong Uptrend 🇪🇺🇯🇵
EURJPY set a new higher high higher close on a daily,
breaking through a significant resistance cluster last week.
I think that the pair will likely grow more and reach 180.5 level soon.
I will look for entries after a pullback from a broken structure.
❤️Please, support my work with like, thank you!❤️
I am part of Trade Nation's Influencer program and receive a monthly fee for using their TradingView charts in my analysis.

PROFITABLE EURYENThis trade and the buy stop has triggered and now headed to the upside to cover its highs as it was just correcting for a short period of time

EURJPY Sellers In Panic! BUY!
My dear subscribers,
This is my opinion on the EURJPY next move:
The instrument tests an important psychological level 179.30
Bias - Bullish
Technical Indicators: Supper Trend gives a precise Bullish signal, while Pivot Point HL predicts price changes and potential reversals in the market.
Target - 179.52
My Stop Loss - 179.18
About Used Indicators:
On the subsequent day, trading above the pivot point is thought to indicate ongoing bullish sentiment, while trading below the pivot point indicates bearish sentiment.
Disclosure: I am part of Trade Nation's Influencer program and receive a monthly fee for using their TradingView charts in my analysis.
———————————
WISH YOU ALL LUCK

EURJPY SMASHED TP Blues on Eurjpy as it has performed as expected and will continue to follow it’s structure to give us even more opportunities

EURJPY⬇️ Sell Entry: 179.310
⏹️ Stop Loss: 179.710
*️⃣ Take Profit-1: 178.770
*️⃣ Take Profit-2: 178.560

EUR/JPY Reaches Record HighEUR/JPY Reaches Record High
As the chart shows, the pair climbed to a new all-time high of ¥179.80 per euro today.
The main driver has been the weakening of the Japanese yen, which continues amid fresh statements from government officials. According to Reuters:
→ Japanese Prime Minister Sanae Takaichi said her administration prefers to keep interest rates low and called for close coordination with the Bank of Japan — a factor contributing to yen weakness.
→ Meanwhile, Finance Minister Satsuki Katayama issued a verbal warning about the yen’s weakness, noting “one-sided and rapid moves” in the currency market. In theory, this should have supported the yen, but judging by today’s USD/JPY movements, the impact was limited.
Technical Analysis of EUR/JPY
Price action continues to form an ascending channel (marked in blue). Following the early October news of Sanae Takaichi’s victory, who is viewed as a proponent of economic stimulus, the yen weakened, and EUR/JPY moved into the upper half of the channel.
Since then, the upper boundary has acted as a key resistance level. Today’s record high serves as yet another test of strength for that level. Given that the RSI is in overbought territory, and long-position holders may be tempted to take profits (at least partially), the market appears vulnerable to a pullback.
Therefore, it cannot be ruled out that we may see:
→ a bearish break of the support line that has held since early November;
→ followed by a retracement to retest the former resistance level around 178.70. A deeper correction towards the channel’s median is also possible.
The future direction of the yen will largely depend on market expectations regarding a potential Bank of Japan rate hike — a likely scenario, as a weak yen increases inflationary pressure on food and energy prices.
This article represents the opinion of the Companies operating under the FXOpen brand only. It is not to be construed as an offer, solicitation, or recommendation with respect to products and services provided by the Companies operating under the FXOpen brand, nor is it to be considered financial advice.

Bearish reversal off Fib onfluence?EUR/JPY is rising toward the pivot, which aligns with the 127.2% Fibonacci extension, as well as the 100% and 61.8% Fibonacci projections. A potential reversal could occur from this level toward the 1st support level.
Pivot: 179.74
1st Support: 18.65
1st Resistance: 180.73
Disclaimer:
The opinions given above constitute general market commentary and do not constitute the opinion or advice of IC Markets or any form of personal or investment advice.
Any opinions, news, research, analyses, prices, other information, or links to third-party sites contained on this website are provided on an "as-is" basis, are intended to be informative only, and are not advice, a recommendation, research, a record of our trading prices, an offer of, or solicitation for, a transaction in any financial instrument and thus should not be treated as such. The information provided does not involve any specific investment objectives, financial situation, or needs of any specific person who may receive it. Please be aware that past performance is not a reliable indicator of future performance and/or results. Past performance or forward-looking scenarios based upon the reasonable beliefs of the third-party provider are not a guarantee of future performance. Actual results may differ materially from those anticipated in forward-looking or past performance statements. IC Markets makes no representation or warranty and assumes no liability as to the accuracy or completeness of the information provided, nor any loss arising from any investment based on a recommendation, forecast, or any information supplied by any third party.

EUR/JPY BEARS ARE GAINING STRENGTH|SHORT
EUR/JPY SIGNAL
Trade Direction: short
Entry Level: 179.218
Target Level: 177.695
Stop Loss: 180.236
RISK PROFILE
Risk level: medium
Suggested risk: 1%
Timeframe: 4h
Disclosure: I am part of Trade Nation's Influencer program and receive a monthly fee for using their TradingView charts in my analysis.
✅LIKE AND COMMENT MY IDEAS✅

EURJPY: Is the Drop About to Begin? 500+ PIPSHey TradingView community!
FX:EURJPY is completing its structure and looks ready to drop soon. If we get a confirmed sell setup, we’ll take it but remember, don’t jump in blindly. You need a proper trading system to execute consistently.
Can it still go 1000 pips higher? Absolutely, anything is possible.
Your job as a trader isn’t to predict the exact top or bottom, it’s to maximize profits when you’re right and minimize losses when you’re wrong.
Always remember WTW 4 Golder Rules:
1) Do not jump in
2) Do not over risk/trade
3) Do not trade without Stop Loss
4) Never ever add to a losing position!
Trade with care
We Trade Waves
WTW Team
Disclosure: We are part of Trade Nation's Influencer program and receive a monthly fee for using their TradingView charts in our analysis.

Bullish momentum to extend?EUR/JPY could fall to the pivot, which acts as pullback support, and may bounce to the 1st resistance.
Pivot: 178.54
1st Support: 177.79
1st Resistance: 179.75
Disclaimer:
The opinions given above constitute general market commentary and do not constitute the opinion or advice of IC Markets or any form of personal or investment advice.
Any opinions, news, research, analyses, prices, other information, or links to third-party sites contained on this website are provided on an "as-is" basis, are intended to be informative only, and are not advice, a recommendation, research, a record of our trading prices, an offer of, or solicitation for, a transaction in any financial instrument and thus should not be treated as such. The information provided does not involve any specific investment objectives, financial situation, or needs of any specific person who may receive it. Please be aware that past performance is not a reliable indicator of future performance and/or results. Past performance or forward-looking scenarios based upon the reasonable beliefs of the third-party provider are not a guarantee of future performance. Actual results may differ materially from those anticipated in forward-looking or past performance statements. IC Markets makes no representation or warranty and assumes no liability as to the accuracy or completeness of the information provided, nor any loss arising from any investment based on a recommendation, forecast, or any information supplied by any third party.

EURJPY PROFITS Eurjpy recap trade, it’s hit (TAKE PROFIT) and now can relax and what for what’s to come next but shall keep following the trend

EURJPY FREE SIGNAL|SHORT|
✅EURJPY shows price delivery into a premium area, mitigating a clear supply level while forming bearish order flow. Short-term target sits below the recent internal range low. Time Frame 3H.
—————————
Entry: 178.640
Stop Loss: 178.900
Take Profit: 178.150
—————————
SHORT🔥
✅Like and subscribe to never miss a new idea!✅

SHORT ON EUR/JPYEJ has formed bearish divergence at a major supply area.
I will be selling EJ to the previous swing low looking to make 150-200 pips

EURJPY Massive Short! SELL!
My dear followers,
This is my opinion on the EURJPY next move:
The asset is approaching an important pivot point 178.30
Bias - Bearish
Technical Indicators: Supper Trend generates a clear short signal while Pivot Point HL is currently determining the overall Bearish trend of the market.
Goal - 177.50
About Used Indicators:
For more efficient signals, super-trend is used in combination with other indicators like Pivot Points.
Disclosure: I am part of Trade Nation's Influencer program and receive a monthly fee for using their TradingView charts in my analysis.
———————————
WISH YOU ALL LUCK
