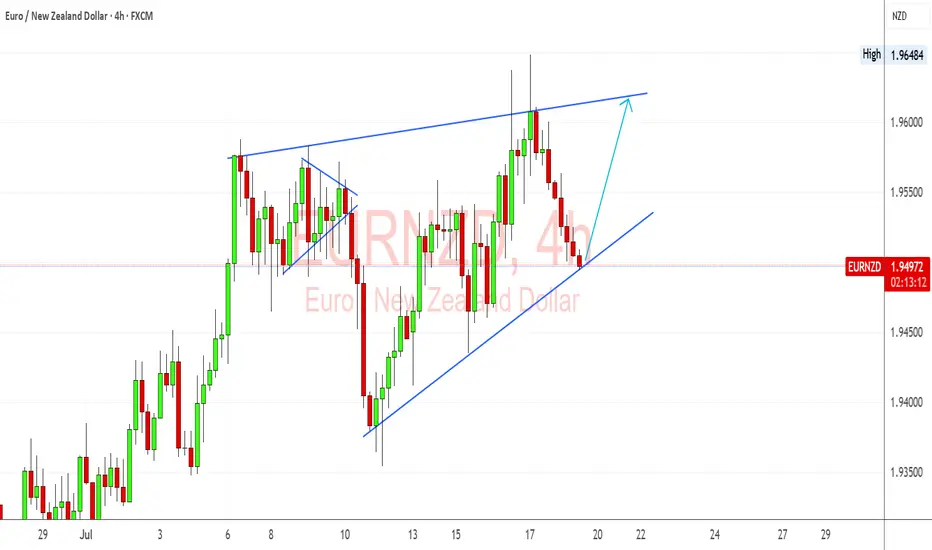
EUR/NZD - Triangle Breakdown In PlayThe EUR/NZD pair has formed a classic Triangle Pattern on the 1H timeframe, indicating a period of consolidation before a potential breakout.
🔎 Key Technical Insights:
Price is compressing within the triangle, showing lower highs and higher lows.
Bearish bias is anticipated as price approaches the apex, suggesting a potential breakout to the downside.
Break below the triangle support opens the door for a move toward the target zone near 1.9425.
Resistance remains firm at 1.9619, capping bullish attempts.
🎯 Target Point: 1.9425
This aligns with previous structure and projected move size from the triangle’s base.
📌 Watch For:
Clear bearish breakout candle below triangle
Volume confirmation or follow-through momentum
This setup offers a solid opportunity for traders watching for continuation patterns and breakout plays.
EURNZD

EUR-NZD Short From Resistance! Sell!
Hello,Traders!
EUR-NZD keeps growing
But the pair is locally overbought
So after the pair hits a horizontal
Resistance of 1.9680 we will
Be expecting a local correction
Sell!
Comment and subscribe to help us grow!
Check out other forecasts below too!
Disclosure: I am part of Trade Nation's Influencer program and receive a monthly fee for using their TradingView charts in my analysis.

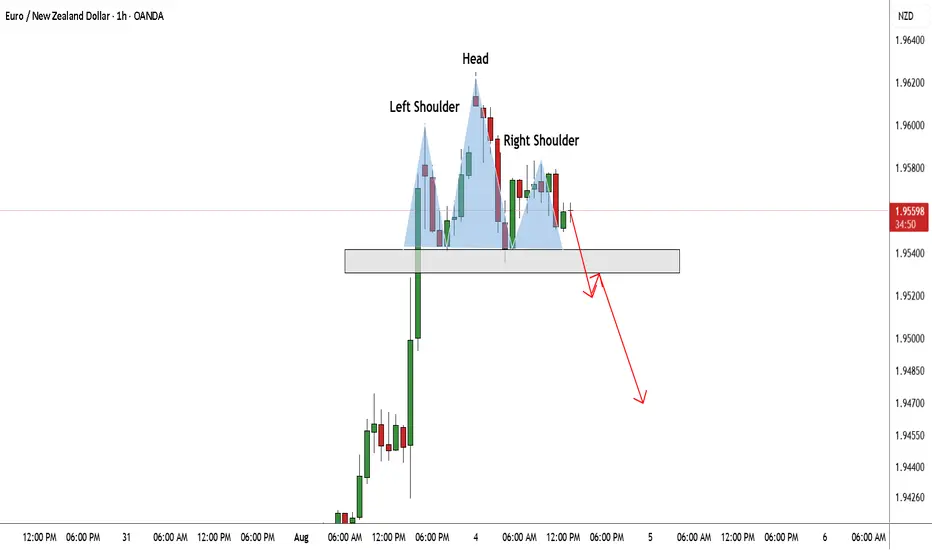
EUR/NZD Made H&S Pattern , Short Setup Valid After Confirmation Here is my 1H Chart On EUR/NZD , The price created a very clear reversal pattern ( head and shoulders pattern ) But the price Still not close below the neckline so the pattern still not confirmed and we can sell after we have a clear closure below our neckline and targeting from 50 : 150 pips , if we have not a closure below the neckline then we can`t sell and this idea will not be valid anymore .
EUR/NZD BEARS WILL DOMINATE THE MARKET|SHORT
Hello, Friends!
EUR/NZD pair is trading in a local uptrend which we know by looking at the previous 1W candle which is green. On the 12H timeframe the pair is going up too. The pair is overbought because the price is close to the upper band of the BB indicator. So we are looking to sell the pair with the upper BB line acting as resistance. The next target is 1.929 area.
Disclosure: I am part of Trade Nation's Influencer program and receive a monthly fee for using their TradingView charts in my analysis.
✅LIKE AND COMMENT MY IDEAS✅

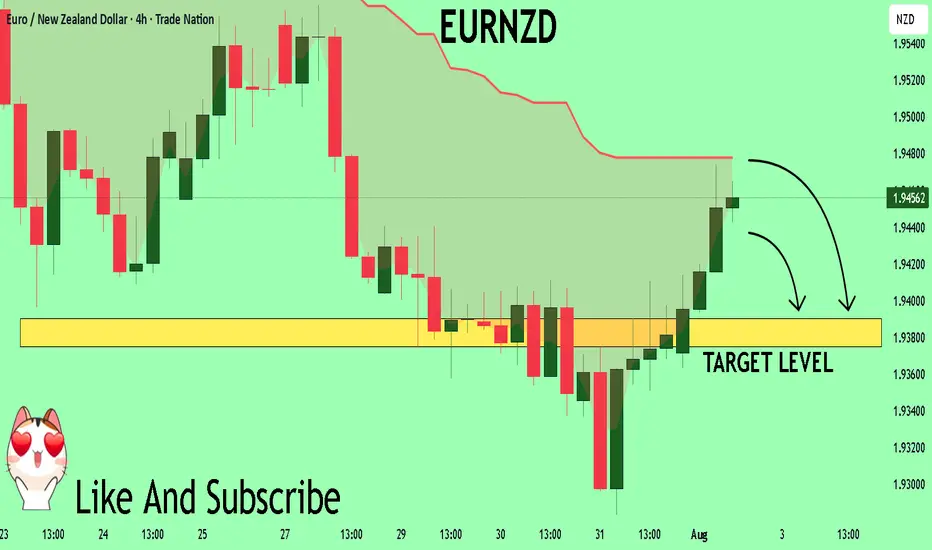
EURNZD Set To Fall! SELL!
My dear subscribers,
This is my opinion on the EURNZD next move:
The instrument tests an important psychological level 1.9459
Bias - Bearish
Technical Indicators: Supper Trend gives a precise Bearish signal, while Pivot Point HL predicts price changes and potential reversals in the market.
Target - 1.9390
About Used Indicators:
On the subsequent day, trading above the pivot point is thought to indicate ongoing bullish sentiment, while trading below the pivot point indicates bearish sentiment.
Disclosure: I am part of Trade Nation's Influencer program and receive a monthly fee for using their TradingView charts in my analysis.
———————————
WISH YOU ALL LUCK
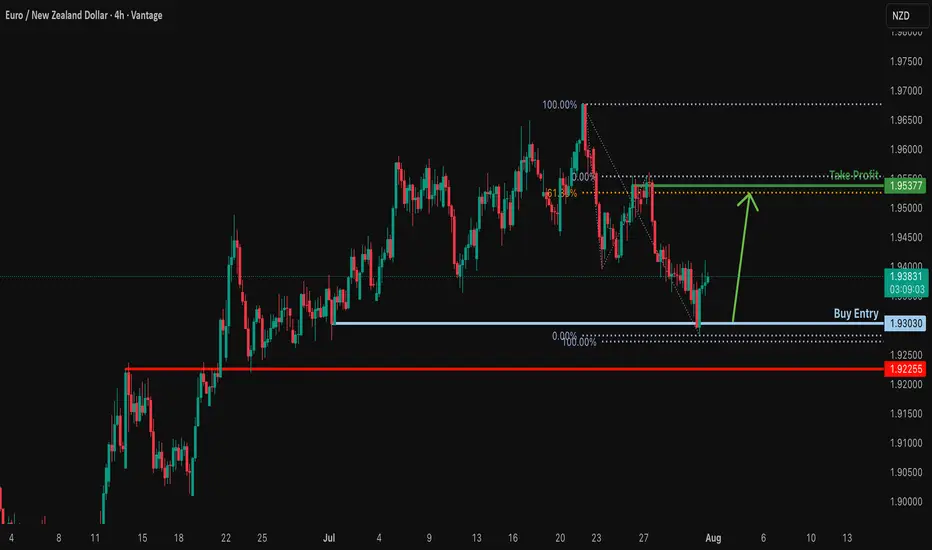
Bullish bounce off pullback support?EUR/NZD has bounced off the support level, which is a pullback support and could rise from this level to our take profit.
Entry: 1.93030
Why we like it:
There is a pullback support.
Stop loss: 1.92255
Why we like it:
There is an overlap support
Take profit: 1.95377
Why we like it:
There is a swing high resistance that lines up with the 61.8% Fibonacci retracement.
Enjoying your TradingView experience? Review us!
Please be advised that the information presented on TradingView is provided to Vantage (‘Vantage Global Limited’, ‘we’) by a third-party provider (‘Everest Fortune Group’). Please be reminded that you are solely responsible for the trading decisions on your account. There is a very high degree of risk involved in trading. Any information and/or content is intended entirely for research, educational and informational purposes only and does not constitute investment or consultation advice or investment strategy. The information is not tailored to the investment needs of any specific person and therefore does not involve a consideration of any of the investment objectives, financial situation or needs of any viewer that may receive it. Kindly also note that past performance is not a reliable indicator of future results. Actual results may differ materially from those anticipated in forward-looking or past performance statements. We assume no liability as to the accuracy or completeness of any of the information and/or content provided herein and the Company cannot be held responsible for any omission, mistake nor for any loss or damage including without limitation to any loss of profit which may arise from reliance on any information supplied by Everest Fortune Group.
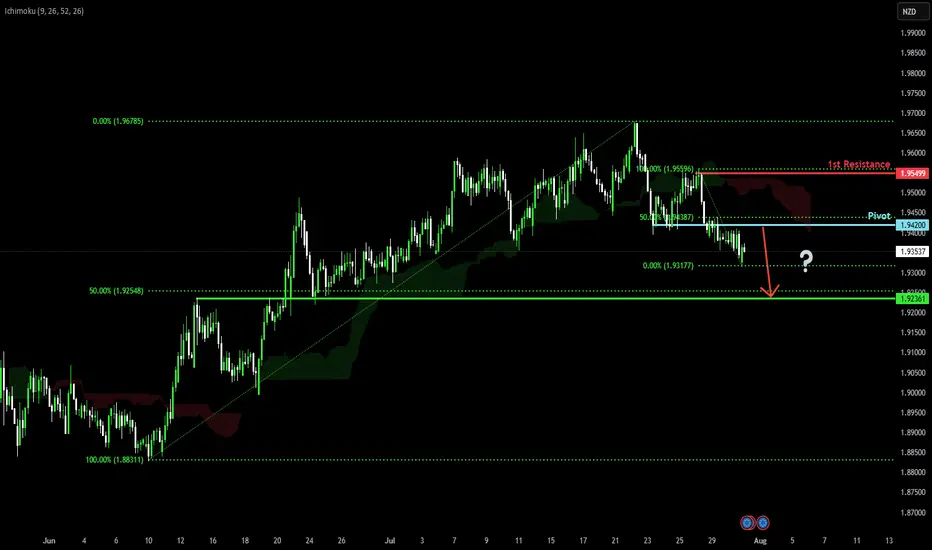
Potential bearish drop?EUR/NZD has rejected off the pivot and could drop to the overlap support.
Pivot: 1.94200
1st Support: 1.92361
1st Resistance: 1.95499
Risk Warning:
Trading Forex and CFDs carries a high level of risk to your capital and you should only trade with money you can afford to lose. Trading Forex and CFDs may not be suitable for all investors, so please ensure that you fully understand the risks involved and seek independent advice if necessary.
Disclaimer:
The above opinions given constitute general market commentary, and do not constitute the opinion or advice of IC Markets or any form of personal or investment advice.
Any opinions, news, research, analyses, prices, other information, or links to third-party sites contained on this website are provided on an "as-is" basis, are intended only to be informative, is not an advice nor a recommendation, nor research, or a record of our trading prices, or an offer of, or solicitation for a transaction in any financial instrument and thus should not be treated as such. The information provided does not involve any specific investment objectives, financial situation and needs of any specific person who may receive it. Please be aware, that past performance is not a reliable indicator of future performance and/or results. Past Performance or Forward-looking scenarios based upon the reasonable beliefs of the third-party provider are not a guarantee of future performance. Actual results may differ materially from those anticipated in forward-looking or past performance statements. IC Markets makes no representation or warranty and assumes no liability as to the accuracy or completeness of the information provided, nor any loss arising from any investment based on a recommendation, forecast or any information supplied by any third-party.
EUR_NZD REBOUND AHEAD|LONG|
✅EUR_NZD fell again to retest the support of 1.9380
But it is a strong key level
So I think that there is a high chance
That we will see a bullish rebound and a move up
LONG🚀
✅Like and subscribe to never miss a new idea!✅
Disclosure: I am part of Trade Nation's Influencer program and receive a monthly fee for using their TradingView charts in my analysis.

EURNZD Update: This short trigger could spark a waterfall dropYo traders, Skeptic from Skeptic Lab! 🩵 EURNZD just broke its daily upward trendline, setting up a sharp drop. Weekly shows a fading uptrend. Daily’s got a strong bearish candle, full body, no buyer fight. 4H trendline broke and... more on this video:)
👀Beware of fakeouts this week—volatility’s high! Trade smart, keep risk tight, and don’t FOMO. Share your thoughts in the comments, boost if it helps <3

EURNZD Will Go Down From Resistance! Short!
Here is our detailed technical review for EURNZD.
Time Frame: 6h
Current Trend: Bearish
Sentiment: Overbought (based on 7-period RSI)
Forecast: Bearish
The market is on a crucial zone of supply 1.941.
The above-mentioned technicals clearly indicate the dominance of sellers on the market. I recommend shorting the instrument, aiming at 1.927 level.
P.S
We determine oversold/overbought condition with RSI indicator.
When it drops below 30 - the market is considered to be oversold.
When it bounces above 70 - the market is considered to be overbought.
Disclosure: I am part of Trade Nation's Influencer program and receive a monthly fee for using their TradingView charts in my analysis.
Like and subscribe and comment my ideas if you enjoy them!

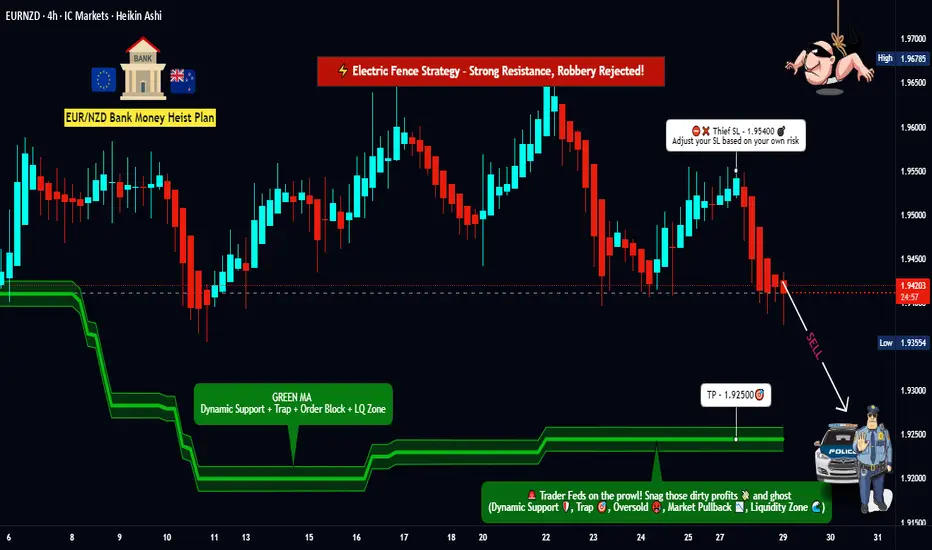
Dynamic Entry Alert – EUR/NZD Bearish Heist Execution!💣 EUR/NZD Robbery Blueprint: The Kiwi Vault Bearish Heist Plan 💰🕵️♂️
🌟Hi! Hola! Ola! Bonjour! Hallo! Marhaba!🌟
Dear Money Makers & Robbers, 🤑💰✈️
This ain't your usual trading tip — it’s a Thief Trading Masterstroke 🎯. We're gearing up for a high-stakes heist on the EUR/NZD forex market. Time to crack open the Kiwi vault and rob those bullish bandits blind! 😼💣
🧠 Strategic Mindset:
🔍 We're targeting the oversold consolidation zone. Bullish traders think they’re safe? Think again. This area is a trap — the perfect bait for our bearish ambush. Expect trend reversal vibes, layered with juicy liquidity grabs.
🕵️♂️ Entry Plan:
🎯 Sell Entry: The vault is wide open! Swipe the Bearish loot at any price - the heist is on!.
💣 Setup:
Sell Limit Orders at nearest swing highs (15m or 30m timeframe)
Use DCA / Layering Method for multiple entries (scalp or swing tactics)
📌 Set your Alert 🚨 — no breakout, no entry. Patience pays.
🛑 Stop Loss Strategy (SL):
No premature moves! Don’t place that SL till we get the confirmed break.
🔥 SL Recommendation:
Just above 1.95400 (4H candle wick swing high)
Adjust based on lot size and number of layers
📍 Remember, the market’s a jungle — stay sharp or get sliced.
🎯 Take Profit (TP):
💵 Target Zone: 1.92500
(But hey, escape early if the vault starts shaking. Protect your gains like a pro.)
📊 Macro Intel – Why This Works:
This isn’t random — it's backed by our 🔥 combo of:
COT Reports
Sentiment Analysis
Quant/Algo Bias
Intermarket Correlation
Fundamental + Technical Confirmation
📌 You can dig deeper — but trust me, this setup’s been scouted like a pro job.
⚠️ Risk Protocols:
Avoid entries during high-impact news
Use Trailing SLs to lock in the loot
Adjust position size to suit your personal bankroll & risk appetite
🔥 Final Word from the Thief:
Smash that 💥Boost Button💥 if you're vibing with the heist plan!
Support the squad, stay profitable, and rob the market — legally, of course.
We don’t trade, we infiltrate.
We don’t predict, we execute.
📡 Stay tuned… More robbery blueprints coming soon!
🤑🐱👤🚨💸💪 #ThiefTrader #ForexHeist #EURNZDShortPlan
EURNZD Bearish Breakout !
HI,Traders !
#EURNZD was trading along
The rising support line but
Now we are seeing a bearish
Breakout so we are bearish
Biased and we will be expecting
A further bearish move down !
Comment and subscribe to help us grow !

EUR-NZD Will Grow! Buy!
Hello,Traders!
EUR-NZD keeps falling
Down and we are bearish
Biased mid-term but there is
A horizontal support level
Below at 1.9370 so after
The retest we might expect
A local bullish correction
Buy!
Comment and subscribe to help us grow!
Check out other forecasts below too!
Disclosure: I am part of Trade Nation's Influencer program and receive a monthly fee for using their TradingView charts in my analysis.

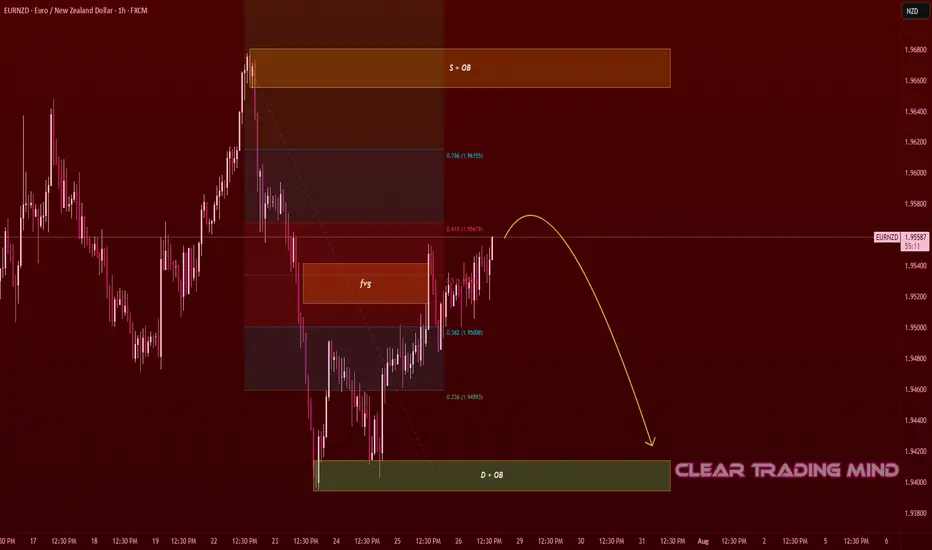
EURNZD Supply Test – Short Setup to DemandOn the 1-hour chart, EURNZD is approaching the 0.618 Fib retracement level and testing a Fair Value Gap (FVG) 🟧 after a strong bearish move.
- Supply + OB zone above 1.96600 is acting as resistance
- Demand + OB zone near 1.94000 is the target area
Plan:
- Expecting a rejection from current levels (1.95500 – 1.95700) or from the upper supply zone
🎯 Target: Demand Zone near 1.94200 – 1.94000 (≈ 150 pips potential move)
🛡 Invalidation: Clean breakout and hold above 1.96600 supply zone
Reasoning:
- Market structure remains bearish after the recent drop
- Supply zone + FVG + Fib retracement creates a strong confluence for rejection
- Looking for confirmation before short entry
(Not financial advice – just a personal market observation)
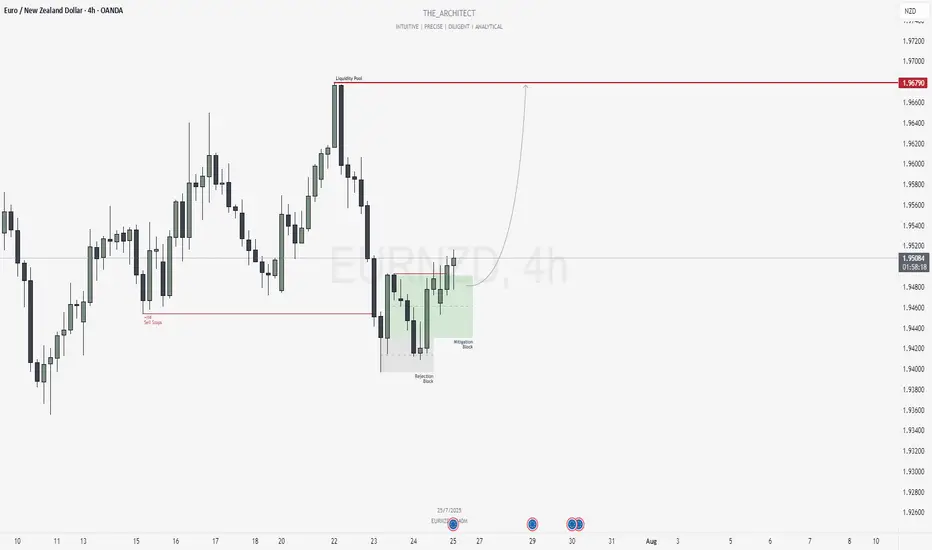
EURNZD: Bullish Shift and Institutional Re-Entry from SupportGreetings Traders,
In today’s analysis of EURNZD, we observe that institutional order flow on the H4 timeframe has recently shifted bullish. This alignment now provides us with a clear bias to seek buying opportunities in line with the predominant higher timeframe trend.
Higher Timeframe Context:
The weekly timeframe is currently delivering bullish order flow. With the recent bullish market structure shift (MSS) on the H4, we now have confluence across both timeframes, which strengthens our confidence in seeking long setups on lower timeframes.
Key Observations on H4:
Sell Stop Raid & Structural Rejection: Price action recently swept sell-side liquidity, a typical behavior indicating institutional order pairing. Following this, price attempted to move lower but failed to break the previous low, instead being supported by a Rejection Block. This led to a bullish market structure shift—our key signal of trend continuation.
Mitigation Block Entry Zone: Price has since retraced into a Mitigation Block—an area where previous institutional selling occurred. The purpose of this pullback is to mitigate earlier positions and initiate fresh buying orders. This now becomes our zone of interest for potential confirmation entries towards the upside.
Trading Plan:
Entry Strategy: Look for lower timeframe confirmation entries within the H4 Mitigation Block.
Target: The objective is to target the H4 liquidity pool residing at premium prices, aligning with the discount-to-premium delivery model.
For a detailed market walkthrough and in-depth execution zones, be sure to watch this week’s Forex Market Breakdown:https://www.tradingview.com/chart/EURNZD/BZC9xW1L-July-21-Forex-Outlook-Don-t-Miss-These-High-Reward-Setups/
As always, remain patient and disciplined. Wait for confirmation before executing, and manage your risk accordingly.
Kind Regards,
The Architect 🏛️📈
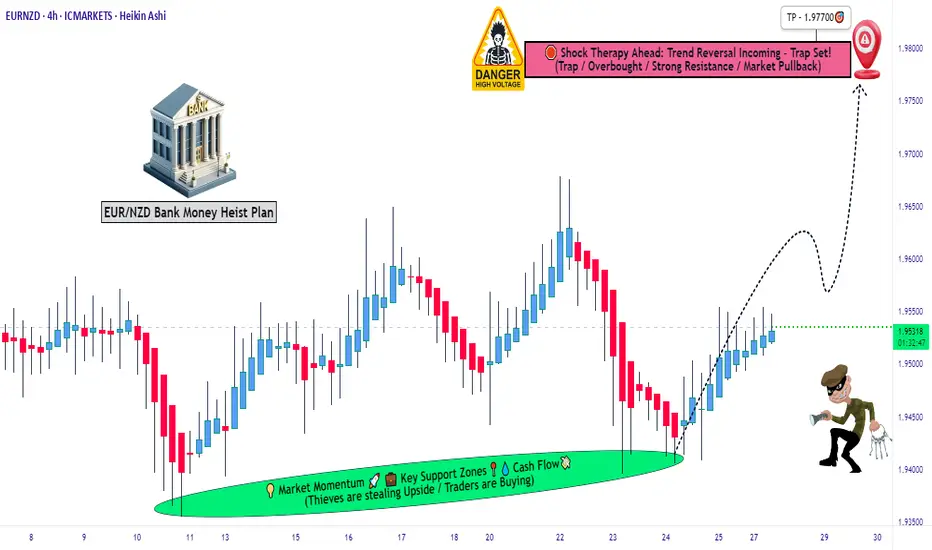
Euro vs Kiwi Bull Raid: High Reward Target Strategy🏴☠️EUR/NZD Heist Plan: "Robbing the Kiwi Vault with Thief Trading Style" 💰🔥
🌍 Hi! Hola! Ola! Bonjour! Hallo! Marhaba! 🌍
Dear Money Makers, Chart Bandits & Market Strategists! 🤑💸✈️
Here’s the EUR/NZD (Euro vs Kiwi) blueprint crafted using the signature 🔥Thief Trading Style🔥 — a blend of bold technicals, insightful fundamentals, and pure tactical precision. We’re setting our sights on a potential bullish breakout — targeting the high-security resistance zone where big money hides.
💡The Robbery Plan (Thief Entry Setup):
🟢 Entry Point:
"The vault is wide open — time to extract the bullish loot!"
⚔️ Entry can be taken at market price, but the smarter thieves use a layered Buy Limit strategy at pullback zones (near swing lows/highs on the 15-30 min TF) to snipe the best entries with reduced exposure.
🔁 Scaling in = DCA-style Thief Method: split entries for efficiency, just like robbing in waves.
🔻 Stop Loss Plan (Escape Route):
🔒 Place SL below the recent swing low using 3H timeframe (1.94000 for scalpers/day traders).
🛡️ Adjust based on risk appetite, lot size, and number of entries in play.
🎯 Take Profit Target:
🏁 Exit the heist near 1.97700, where strong resistance awaits. That’s the Danger Zone — the edge of our mission.
🔍EUR/NZD Outlook Snapshot:
This pair is flashing bullish vibes due to:
🏛️ Macro & Fundamental tailwinds
📊 COT positioning & Sentiment readings
🔗 Intermarket influences
📈 Price structure & liquidity zones
For more depth: dive into external analysis tools, COT reports, and sentiment dashboards to fine-tune your view. The direction is clear — the bulls are assembling.
⚠️ Trading Alerts & Risk Management Reminders:
🚨 News releases = volatility mines.
Before entering, make sure to:
Avoid new positions near red-flag economic events
Protect your open trades with trailing SLs or partial exits
Stay alert — the market shifts fast, adapt faster
💬 Final Word from the Vault Boss:
📢 Smashing likes = boosting the crew. 💥
Support the Thief Trading Style by hitting the BOOST button and keep the robbery crew rolling strong 💪💸
We're here to outsmart the market — one clean chart raid at a time.
Stay tuned for the next master plan. Until then, rob smart, rob safe. 🧠🔐💥
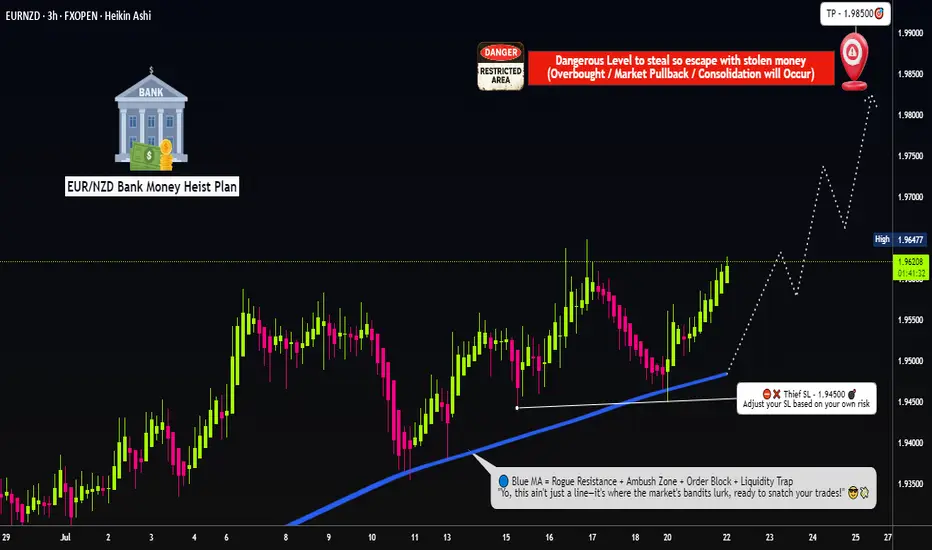
Euro vs Kiwi Bull Raid: High Reward Target Strategy🏴☠️EUR/NZD Heist Plan: "Robbing the Kiwi Vault with Thief Trading Style" 💰🔥
🌍 Hi! Hola! Ola! Bonjour! Hallo! Marhaba! 🌍
Dear Money Makers, Chart Bandits & Market Strategists! 🤑💸✈️
Here’s the EUR/NZD (Euro vs Kiwi) blueprint crafted using the signature 🔥Thief Trading Style🔥 — a blend of bold technicals, insightful fundamentals, and pure tactical precision. We’re setting our sights on a potential bullish breakout — targeting the high-security resistance zone where big money hides.
💡The Robbery Plan (Thief Entry Setup):
🟢 Entry Point:
"The vault is wide open — time to extract the bullish loot!"
⚔️ Entry can be taken at market price, but the smarter thieves use a layered Buy Limit strategy at pullback zones (near swing lows/highs on the 15-30 min TF) to snipe the best entries with reduced exposure.
🔁 Scaling in = DCA-style Thief Method: split entries for efficiency, just like robbing in waves.
🔻 Stop Loss Plan (Escape Route):
🔒 Place SL below the recent swing low using 3H timeframe (1.94500 for scalpers/day traders).
🛡️ Adjust based on risk appetite, lot size, and number of entries in play.
🎯 Take Profit Target:
🏁 Exit the heist near 1.98500, where strong resistance awaits. That’s the Danger Zone — the edge of our mission.
🔍EUR/NZD Outlook Snapshot:
This pair is flashing bullish vibes due to:
🏛️ Macro & Fundamental tailwinds
📊 COT positioning & Sentiment readings
🔗 Intermarket influences
📈 Price structure & liquidity zones
For more depth: dive into external analysis tools, COT reports, and sentiment dashboards to fine-tune your view. The direction is clear — the bulls are assembling.
⚠️ Trading Alerts & Risk Management Reminders:
🚨 News releases = volatility mines.
Before entering, make sure to:
Avoid new positions near red-flag economic events
Protect your open trades with trailing SLs or partial exits
Stay alert — the market shifts fast, adapt faster
💬 Final Word from the Vault Boss:
📢 Smashing likes = boosting the crew. 💥
Support the Thief Trading Style by hitting the BOOST button and keep the robbery crew rolling strong 💪💸
We're here to outsmart the market — one clean chart raid at a time.
Stay tuned for the next master plan. Until then, rob smart, rob safe. 🧠🔐💥
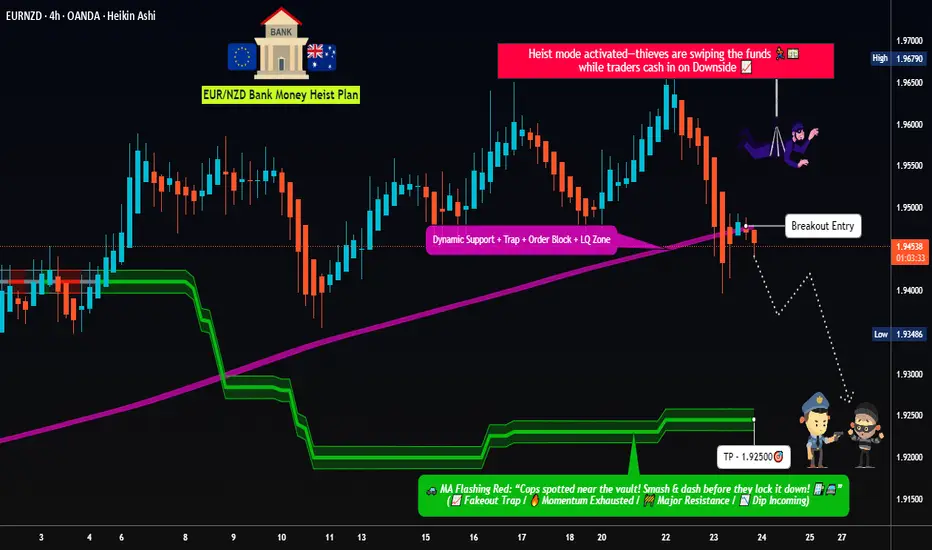
Dynamic Entry Alert – EUR/NZD Bearish Heist Execution!💣 EUR/NZD Robbery Blueprint: The Kiwi Vault Bearish Heist Plan 💰🕵️♂️
🌟Hi! Hola! Ola! Bonjour! Hallo! Marhaba!🌟
Dear Money Makers & Robbers, 🤑💰✈️
This ain't your usual trading tip — it’s a Thief Trading Masterstroke 🎯. We're gearing up for a high-stakes heist on the EUR/NZD forex market. Time to crack open the Kiwi vault and rob those bullish bandits blind! 😼💣
🧠 Strategic Mindset:
🔍 We're targeting the oversold consolidation zone. Bullish traders think they’re safe? Think again. This area is a trap — the perfect bait for our bearish ambush. Expect trend reversal vibes, layered with juicy liquidity grabs.
🕵️♂️ Entry Plan:
🎯 Sell Entry Trigger: Wait for a clean break below 1.94500.
💣 Setup:
Place Sell Stop Orders below the MA Support Breakout
Or... go stealth: Sell Limit Orders at nearest swing highs (15m or 30m timeframe)
Use DCA / Layering Method for multiple entries (scalp or swing tactics)
📌 Set your Alert 🚨 — no breakout, no entry. Patience pays.
🛑 Stop Loss Strategy (SL):
No premature moves! Don’t place that SL till we get the confirmed break.
🔥 SL Recommendation:
Just above 1.95700 (4H candle wick swing high)
Adjust based on lot size and number of layers
📍 Remember, the market’s a jungle — stay sharp or get sliced.
🎯 Take Profit (TP):
💵 Target Zone: 1.92500
(But hey, escape early if the vault starts shaking. Protect your gains like a pro.)
📊 Macro Intel – Why This Works:
This isn’t random — it's backed by our 🔥 combo of:
COT Reports
Sentiment Analysis
Quant/Algo Bias
Intermarket Correlation
Fundamental + Technical Confirmation
📌 You can dig deeper — but trust me, this setup’s been scouted like a pro job.
⚠️ Risk Protocols:
Avoid entries during high-impact news
Use Trailing SLs to lock in the loot
Adjust position size to suit your personal bankroll & risk appetite
🔥 Final Word from the Thief:
Smash that 💥Boost Button💥 if you're vibing with the heist plan!
Support the squad, stay profitable, and rob the market — legally, of course.
We don’t trade, we infiltrate.
We don’t predict, we execute.
📡 Stay tuned… More robbery blueprints coming soon!
🤑🐱👤🚨💸💪 #ThiefTrader #ForexHeist #EURNZDShortPlan
SHORT ON EUR/NZDEZ Has given a nice CHOC to the downside with plenty of sell side liquidity to be collected.
I will be selling EZ to the next level of demand looking to catch 300-500 pips

EURNZD Continuation setup following recent bearish momentumThe market has recently pushed down with momentum.
Price attempted a timid "echo bounce" back into the broken support but was rejected, confirming this area now serves as area for bearish re-entries.
From what I can tell, we're entering the next leg of what I call the “Gravity Spiral Phase”, where sellers take over after taking a clear zone. Each wave down is not just a move, but a continuation of momentum migration into new bearish move.
Target: 1.93500
This level marks the next gravity anchor, a zone where price memory may attempt to stabilize, but only temporarily.

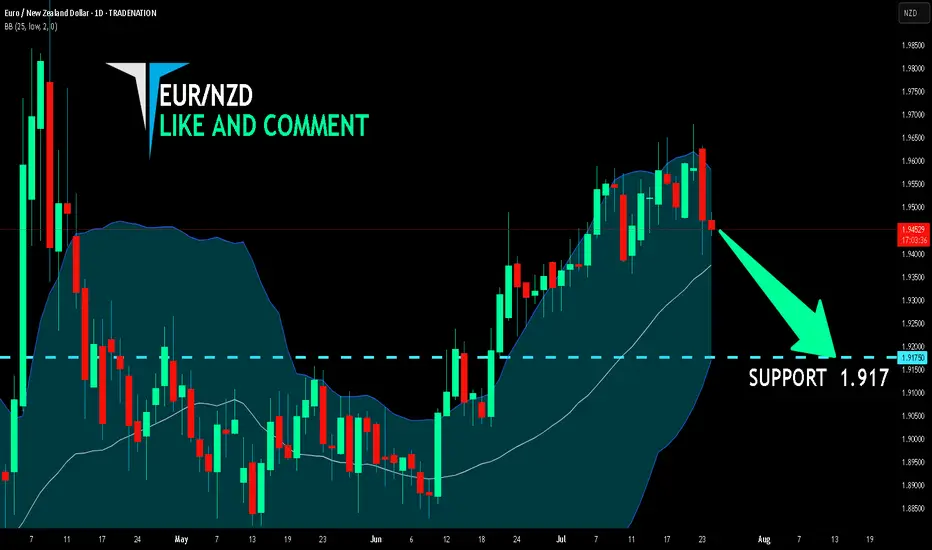
EUR/NZD SENDS CLEAR BEARISH SIGNALS|SHORT
Hello, Friends!
The BB upper band is nearby so EUR-NZD is in the overbought territory. Thus, despite the uptrend on the 1W timeframe I think that we will see a bearish reaction from the resistance line above and a move down towards the target at around 1.917.
Disclosure: I am part of Trade Nation's Influencer program and receive a monthly fee for using their TradingView charts in my analysis.
✅LIKE AND COMMENT MY IDEAS✅
EURNZD Trendline & Hawkish ECB Bias Support Bullish ContinuationEURNZD is holding beautifully above the ascending trendline on the 4H, and I’m watching this level closely for a bounce continuation setup. Fundamentally, the euro remains supported by sticky inflation and hawkish ECB commentary, while the kiwi is showing softness after dovish signals from the RBNZ and mixed jobs data. If this trendline holds, I’ll be targeting a retest of the upper wedge resistance near 1.9640.
🔍 Technical Setup (4H):
Structure: Ascending triangle forming – price is pressing into dynamic support.
Support Zone: Around 1.9480 trendline area – price rejected this level several times in July.
Resistance Target: 1.9640 highs – double top and triangle resistance.
Bullish Confirmation: Rebound with bullish engulfing or strong 4H close above 1.9525 could trigger long setup.
Invalidation: Clean break below trendline and 1.9440 invalidates bullish scenario short-term.
💡 Fundamental Insight:
EUR Drivers:
ECB members remain cautious about declaring victory on inflation.
German and Eurozone CPI data remain above target, supporting higher-for-longer ECB stance.
Speculation that ECB won't cut aggressively compared to RBNZ.
NZD Weakness:
RBNZ minutes show concern over downside inflation risks.
Labor market cooling, and migration pressures remain high.
Commodity and China-linked sentiment weakening NZD.
⚠️ Key Risks:
If Eurozone inflation or PMI data surprises to the downside, EUR may weaken.
RBNZ hawkish pivot or surprise tightening would flip sentiment toward NZD.
Global risk-on could favor NZD as a high-beta currency.
🧭 Summary:
I’m bullish on EURNZD as long as price holds above the trendline near 1.9480. The technical structure shows a clean ascending pattern, and the fundamentals currently favor EUR strength over NZD. My eyes are on a potential move toward 1.9640, especially if upcoming ECB rhetoric stays hawkish. EURNZD tends to lead NZD-crosses like NZDJPY or NZDCHF in risk-off regimes and could signal euro strength if it breaks out. Watching closely for price action confirmation.
EURNZD: Bulls Will Push Higher
Our strategy, polished by years of trial and error has helped us identify what seems to be a great trading opportunity and we are here to share it with you as the time is ripe for us to buy EURNZD.
Disclosure: I am part of Trade Nation's Influencer program and receive a monthly fee for using their TradingView charts in my analysis.
❤️ Please, support our work with like & comment! ❤️
