Watching for a Pullback Entry on EUROFOREXCOM:EURUSD
🇪🇺💶 The euro remains under pressure, with EUR/USD hovering near a two-week low. Investors are cautious ahead of Federal Reserve Chair Jerome Powell’s speech at the Jackson Hole symposium, which is widely expected to provide new insights into the central bank’s policy direction. 📉 Market participants are holding back from major moves until they hear whether Powell will strike a hawkish or dovish tone.
⚖️ Traders are specifically looking for clarity on the future path of U.S. interest rates. Concerns are growing that Powell could push back against expectations for an imminent rate cut, which would reinforce dollar strength and weigh further on the euro. 💵✨ A more hawkish message could extend EUR/USD weakness, while any dovish hints may allow the pair to rebound from current lows.
🇪🇺💶The euro slipped to a two-week low versus the dollar, testing the 50-day EMA after hawkish comments from Fed officials.
Great trading day everyone! What is your opinion about EURO today?
Euro

EURUSD strong daily supply is playing out in August 2025EURUSD strong daily supply is playing out in August 2025
Daily downtrend. Imbalance #1, mentioned in the last updates, is still in control and is playing out well. Short positions should be managed.

EURUSD: Will Sellers Take Control? Moment Of Truth!Welcome back to the Weekly Forex Forecast for the week of Aug 18 - 22nd.
In this video, we will analyze the following FX market: EURUSD
The EURUSD is at a point in the uptrend it has been on since January where there is some
strong resistance.
July was a very bearish month, but August has corrected about 80% of the move, the last line on a fib retracement. It could keep going higher, of course. Or it could do what it has done the last two time the HTF swing highs reached these levels... turn around.
Wait for the market to decide, which should happen early during next week. Then look for valid entries.
Enjoy!
May profits be upon you.
Leave any questions or comments in the comment section.
I appreciate any feedback from my viewers!
Like and/or subscribe if you want more accurate analysis.
Thank you so much!
Disclaimer:
I do not provide personal investment advice and I am not a qualified licensed investment advisor.
All information found here, including any ideas, opinions, views, predictions, forecasts, commentaries, suggestions, expressed or implied herein, are for informational, entertainment or educational purposes only and should not be construed as personal investment advice. While the information provided is believed to be accurate, it may include errors or inaccuracies.
I will not and cannot be held liable for any actions you take as a result of anything you read here.
Conduct your own due diligence, or consult a licensed financial advisor or broker before making any and all investment decisions. Any investments, trades, speculations, or decisions made on the basis of any information found on this channel, expressed or implied herein, are committed at your own risk, financial or otherwise.

SHORT ON EUR/NZDEUR/NZD has taken out a previous swing high and has started to consolidate.
There is plenty of liquidity to be collected to the downside.
I will be selling EUR/NZD to the next demand level looking to catch 300-400 pips.

EURJPY SHORTi see potential for EURJPY to go down to 155 level.
At the moment there are not confirmed down move yet, but the way how price is behaving at the moment i belive we will see down movment i next days/weeks.
Trade according to your strategy!

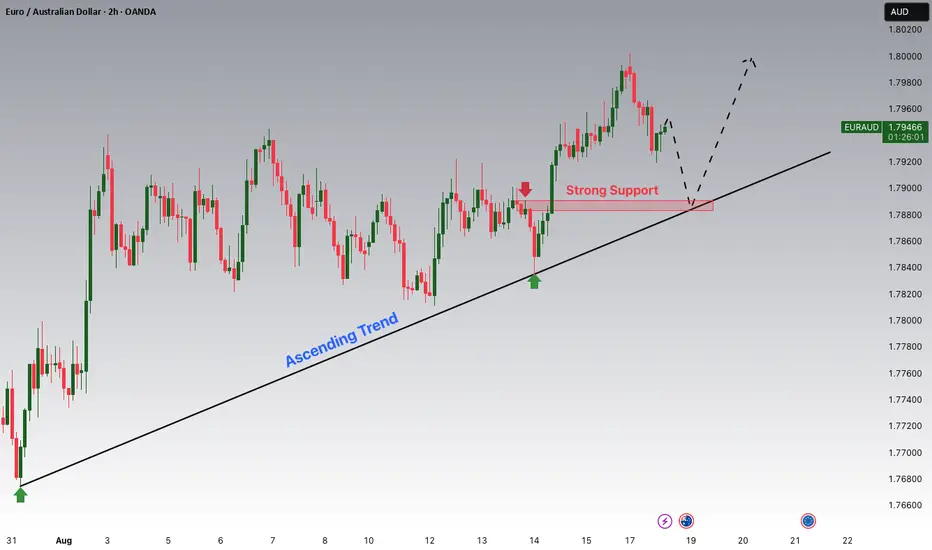
EURAUD is Nearing a Strong Support!!Hey Traders, in today's trading session we are monitoring EURAUD for a buying opportunity around 1.78900 zone, EURAUD is trading in an uptrend and currently is in a correction phase in which it is approaching the trend at 1.78900 support and resistance area.
Trade safe, Joe.
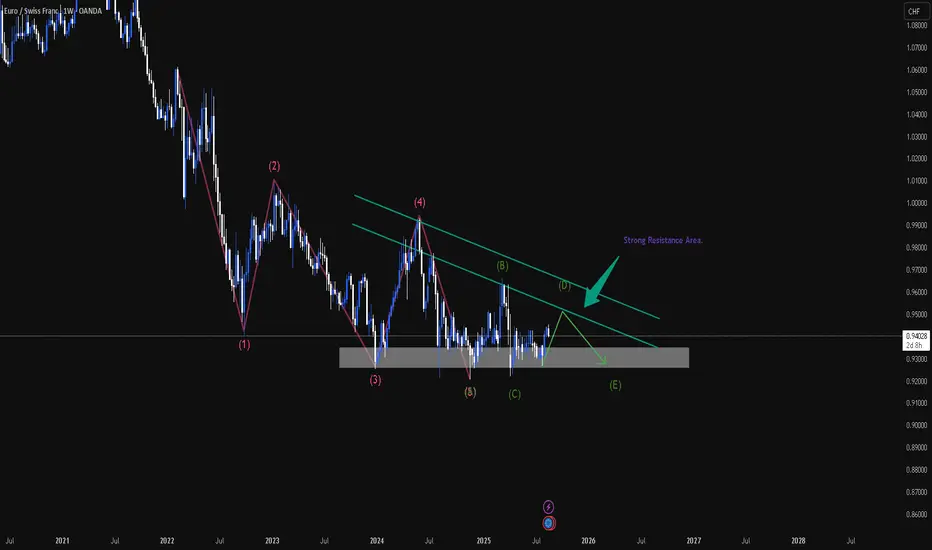
EURCHF - the little up & than down. Forming of Triangle.Right now, on market it is more predictable to be again bear movements!
The Elliot wave analysis shows as the price may go down again.
For them who is looking for entering sell, here we have two places for it.
First, it's when the price will touch resistance diagonal line. (Light-green colored).
The second place is after the price will enter that main resistance area.
Thx,
have a profitable day!
Strong daily supply level in control on EURUSDThere is a strong daily supply level in control on EURUSD the 19th of August 2025. Will the EURUSD drop much further. Hopefully it will.

EURUSD (Daily)EUR/USD Daily Chart shows a clear bullish trend, with demand consistently supporting higher prices. The most probable scenario is a breakout above 1.2000, targeting 1.2202. This aligns perfectly with your DXY analysis, where further USD weakness supports Euro strength.
🔎 Chart Context
• Pair: EUR/USD
• Broker: FXCM
• Timeframe: 1D (Daily)
• Date: 19 August 2025
This chart shows the Euro’s performance against the US Dollar. Since EUR/USD is strongly inversely correlated with the DXY, this analysis complements the DXY bearish outlook.
📊 Key Observations
1. Macro Trend
• EUR/USD bottomed near 1.0200 earlier in 2025.
• Since then, price has established a strong bullish uptrend, breaking through multiple resistance levels.
• Current structure shows higher highs and higher lows, confirming a bullish market bias.
2. Support & Demand Zones
• Key demand zone around 1.1100 – 1.1200, previously a resistance-turned-support.
• A well-defined S/D (supply → demand flip) is visible, showing institutional accumulation.
• Price respected this area on multiple retests, suggesting strong bullish interest.
3. Resistance Zones
• 1.2000: Psychological resistance and liquidity pool.
• 1.2202: Next major projected upside target, marked on the chart.
• Price is consolidating below 1.2000, building energy for a potential breakout.
4. Liquidity Behavior
• Market has absorbed sellers around 1.1600–1.1700, pushing into higher levels.
• Liquidity likely rests above 1.2000, where stop orders are clustered.
• If price clears this, a sweep toward 1.2202 becomes very probable.
5. Projected Path
• Chart projection suggests a bullish continuation:
• Short-term pullback → retest of demand zone (around 1.1600–1.1700).
• Then breakout above 1.2000.
• Final move toward 1.2202 liquidity zone.
📈 Bullish Case (Higher Probability)
• Structure strongly favors bulls.
• Scenario:
• If EUR/USD sustains above 1.1600 demand, breakout above 1.2000 is expected.
• Target 1: 1.2000 (psychological & liquidity).
• Target 2: 1.2202 (projected liquidity sweep).
• This aligns with DXY bearish outlook (as seen in your previous chart).
📉 Bearish Case (Low Probability, Countertrend)
• Only valid if price breaks back below 1.1100 demand zone.
• Downside targets:
• 1.0800 (structural support).
• 1.0500 (deep retracement).
• This would require a sudden USD strength revival, which contradicts current DXY projection.
⚡ Trading Plan
• Long Setup (Preferred):
• Entry: Pullbacks into 1.1600–1.1700 demand zone.
• TP1: 1.2000
• TP2: 1.2202
• Stop-loss: Below 1.1100
• Short Setup (Risky, Countertrend):
• Entry: At 1.2000 liquidity zone if price rejects strongly.
• TP: 1.1600
• Stop: Above 1.2202

EURUSD 4H Golden Cross kickstarting the next bullish phase.The EURUSD pair just formed its first 4H Golden Cross since May 29. Similar to that formation, this is taking place as the new Bullish Leg of the 4-month Channel Up has already started, following a bottom rebound near its 1D MA100 (red trend-line).
In similar fashion as that sequence, we expect it to reach at least the 1.1 Fibonacci extension on the short-term, which sits at 1.18750. If you're looking for an even higher extension, a +5.11% rise at 1.19700 is possible (also based on he previous Bullish Leg).
-------------------------------------------------------------------------------
** Please LIKE 👍, FOLLOW ✅, SHARE 🙌 and COMMENT ✍ if you enjoy this idea! Also share your ideas and charts in the comments section below! This is best way to keep it relevant, support us, keep the content here free and allow the idea to reach as many people as possible. **
-------------------------------------------------------------------------------
Disclosure: I am part of Trade Nation's Influencer program and receive a monthly fee for using their TradingView charts in my analysis.
💸💸💸💸💸💸
👇 👇 👇 👇 👇 👇

EURNZD Bearish Shark Follow-UpFrom my previous post regarding potential Bearish Shark forming on the EURNZD (see Related Publications ->) a shooting star pattern might be forming right around the 1.97500 level. I usually don't trade candlestick patterns, but will look for a handful of certain ones around areas of fib confluence, S/R, S/D, and divergence. The Kiwi is weak relative to all other currencies, but I think the Euro is exhausted. Nevertheless, I would not be surprised if bulls make another exhausted push up towards 1.98500.
Currently short at 1.9755

Bearish Shark EUR/NZDLooking at a potential Bearish Shark forming on the EURNZD. I'm seeing divergence, but anticipate a bullish move up towards 1.975. I've placed a couple short limits at 1.975 and 1.98, but will short the market if I see a signal on the lower timeframes.

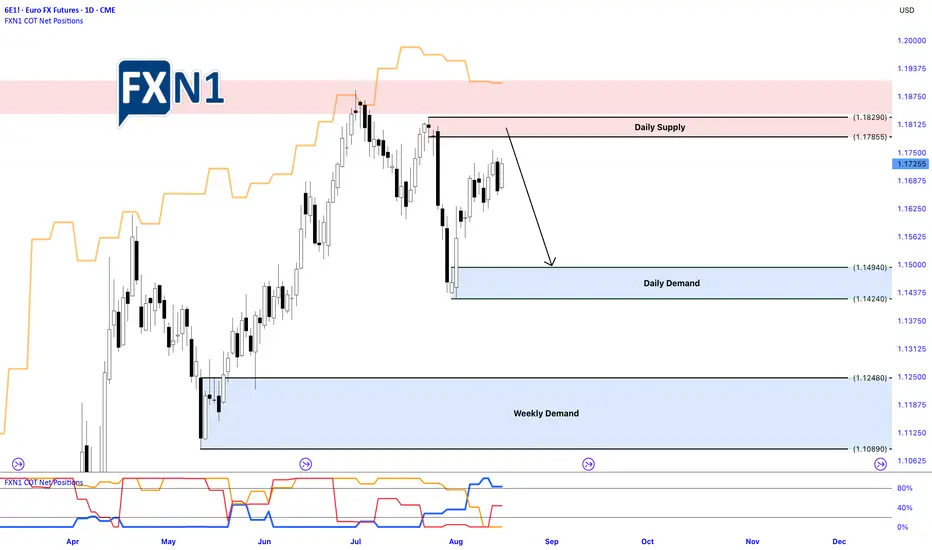
EUR: COT Data Indicates Dollar ResilienceThe EURUSD pair closed the previous week with a bullish weekly candle, positioned within the bounds of a significant two-week-old bearish candle. This pattern suggests a potential pause or consolidation phase after a strong downtrend, but traders should remain cautious as the overall trend still bears the mark of the larger bearish candle.
Recent COT (Commitment of Traders) data provides additional insights into market sentiment. Retail traders have increased their long positions, indicating a more bullish outlook among individual traders. Conversely, both commercial and non-commercial traders are shifting towards bearish positions, signaling a potential underlying strength in the US dollar and a cautious stance among large market participants.
Given these dynamics, there is a high probability that the EURUSD may retest the recent daily supply zone, which has already been touched during the week. If the price moves down from this level, it could signal a continuation of the overall bearish trend, especially considering the COT data's favor towards dollar strength.
What are your thoughts on this setup? Do you see a potential reversal, or will the bullish weekly candle lead to further upside?
✅ Please share your thoughts about 6E1! in the comments section below and HIT LIKE if you appreciate my analysis. Don't forget to FOLLOW ME; you will help us a lot with this small contribution.
EURUSD🔹The price has declined after hitting the important area in the 4-hour time frame
🔸It is now in the important area, which is suitable for high-risk people to sell
🔹In case of consolidation above this area, if the price returns to the demand area (blue area), it will be suitable for entering a sell transaction
🔸If there is no consolidation and confirmation by the candlestick, you can sell for lower targets
#eurusd #euros

Euro may reach seller zone and then start to decline to 1.1600Hello traders, I want share with you my opinion about Euro. The historical price action for the Euro began with a period of contracting volatility, where the market consolidated within a triangle formation. A decisive breakout from this triangle unleashed a strong upward impulse, which marked a shift into the current market environment characterised by expanding volatility. This new phase is captured by a large broadening wedge, which has since been defining the trading range between the major buyer zone around 1.1450 and a significant seller zone near the 1.1740 resistance. After a powerful impulse down from the top of this wedge was absorbed by the buyer zone, the asset has entered a corrective rally back towards the upper boundary. Currently, the price is approaching this critical confluence of resistance. The primary working hypothesis is a short scenario, predicated on the expectation that the seller zone will once again cap the rally. A confirmed rejection from this area would validate the integrity of the broadening pattern and suggest that another major downward rotation is imminent. Therefore, the TP for this anticipated decline is logically placed at the 1.1600 points, representing a key area of prior price interaction and a prudent first objective. Please share this idea with your friends and click Boost 🚀
Disclaimer: As part of ThinkMarkets’ Influencer Program, I am sponsored to share and publish their charts in my analysis.

EURUSD POSSIBLE SELL SETUP **RISK MANAGEMENT **This chart illustrates a **Supply and Demand** setup on the EUR/USD daily timeframe.
-Supply Zone (Red Area)**: Price previously dropped sharply from this zone (around 1.1713–1.1796), showing strong selling pressure.
-BOS (Break of Structure)**: The market broke a key support level, confirming bearish intent.
-Entry**: Price retraced back into the supply zone, offering a short-selling opportunity.
* **Targets**:
-TP1** at \~1.1500 (first liquidity pool / minor demand)
-TP2** at \~1.1400 (major demand zone)

EURUSD: Important Breakout 🇪🇺🇺🇸
EURUSD keeps rising for the last 2 weeks.
Yesterday, the market went up again and violated
a significant falling trend line
It is another strong bullish signal.
I think that the pair will most likely continue rising
and reach 1.1755 soon.
❤️Please, support my work with like, thank you!❤️
I am part of Trade Nation's Influencer program and receive a monthly fee for using their TradingView charts in my analysis.

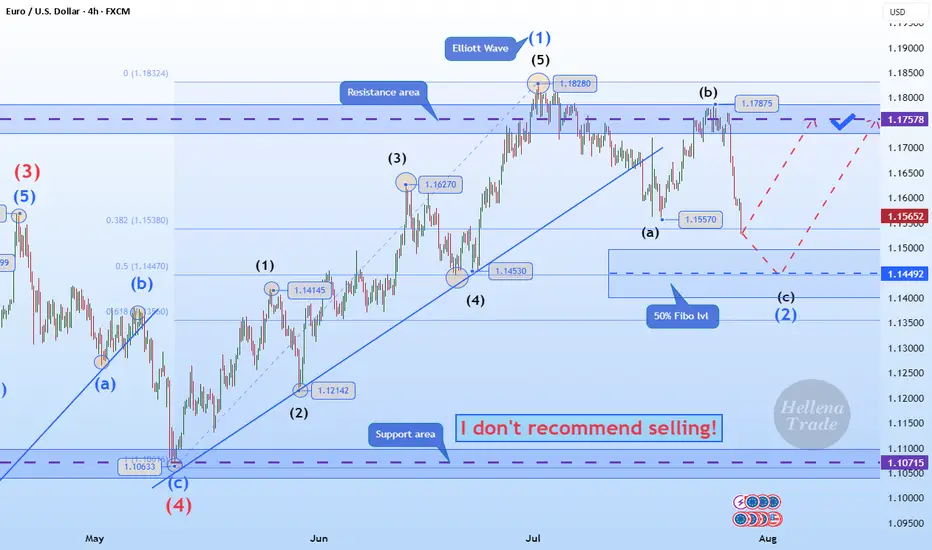
Hellena | EUR/USD (4H): LONG to the resistance area 1.17578.Colleagues, the price has made a strong downward movement, which can only mean one thing: the correction is not complete.
This means that the latest upward movement is wave “1” of medium order.
Therefore, I now expect the correction to end in wave “2” at the 50% Fibonacci level and thean upward movement to continue to at least the resistance level of 1.17578.
It is quite possible that after updating the level of 1.15570, the price will immediately begin an upward movement — this is a more risky option for entering a position.
Manage your capital correctly and competently! Only enter trades based on reliable patterns!
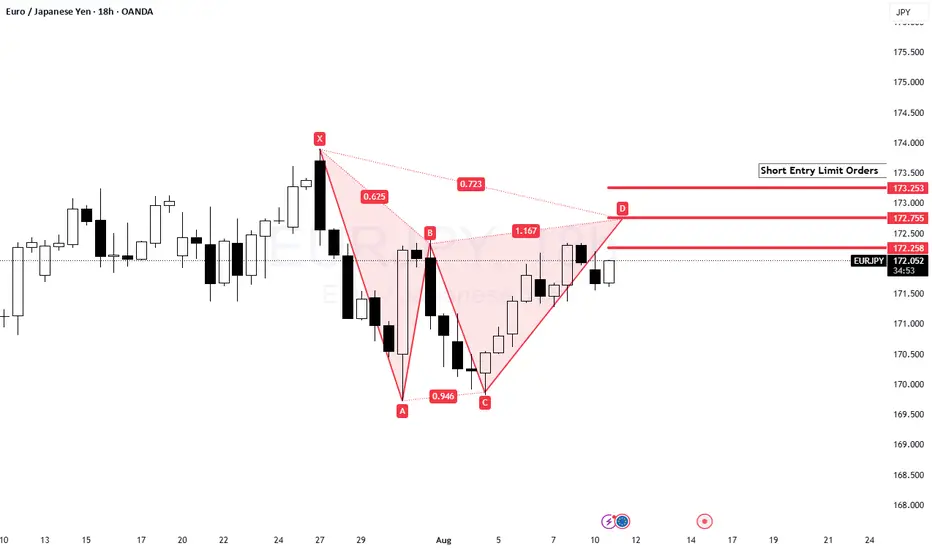
EUR/JPY Bearish BatA Bearish Bat is forming on the EUR/JPY custom timeframe chart (18hr). I'm expecting price to push through 172.00 and possibly through 173.00 before reversing. I've put in a few limit orders. If price sharply reverses I'm just going to short the market.
EURUSD 1D MA100 bounce targets 1.8750 at least.The EURUSD pair has been trading within a 4-month Channel Up and recently priced its latest Higher Low (pattern's bottom).
That happened to take place just above the 1D MA100 (green trend-line), giving a strong medium-term buy signal. As long as it holds, we expect the emerging Bullish Leg to target at least 1.18750 (the 1.1 Fibonacci extension) and in continuation 1.19700 (+5.11% from the bottom), both based on the previous Bullish Leg.
Notice also that the 1D MACD is forming its first Bullish Cross since May 26, a very strong additional buy signal.
-------------------------------------------------------------------------------
** Please LIKE 👍, FOLLOW ✅, SHARE 🙌 and COMMENT ✍ if you enjoy this idea! Also share your ideas and charts in the comments section below! This is best way to keep it relevant, support us, keep the content here free and allow the idea to reach as many people as possible. **
-------------------------------------------------------------------------------
Disclosure: I am part of Trade Nation's Influencer program and receive a monthly fee for using their TradingView charts in my analysis.
💸💸💸💸💸💸
👇 👇 👇 👇 👇 👇

EUR/USD | Holding Above 1.16 Could Unlock More Upside! (READ IT)By analyzing the EURUSD chart on the 4-hour timeframe, we can see that the price reacted beautifully to all the marked zones on the chart. Especially after reaching the 1.14 demand area, it experienced a strong bullish move, rallying over 200 pips to hit 1.16. Currently, EURUSD is trading around 1.16220, and if it holds above the 1.16 level, we can expect further upside. The next bullish targets are 1.16435, 1.16780, 1.17100, and 1.17500.
Please support me with your likes and comments to motivate me to share more analysis with you and share your opinion about the possible trend of this chart with me !
Best Regards , Arman Shaban
Fundamental Market Analysis for August 8, 2025 EURUSDThe EUR/USD exchange rate remains stable after rising during the previous three sessions, trading at around 1.1660 during Asian trading hours on Friday. The pair may regain its positions as the US dollar (USD) may struggle as markets assess the probability of a 25 basis point (bp) rate cut at the September meeting at nearly 93%, compared to 48% a week ago.
Expectations for a Fed rate cut in September have intensified as the number of new applications for unemployment benefits in the US increased after the US nonfarm payrolls (NFP) report for July pointed to a cooling labor market.
Data on initial jobless claims in the US showed that the number of US citizens filing new claims for unemployment benefits rose to 226,000 for the week ending August 2. This figure exceeded the market consensus forecast of 221,000 and was higher than the previous week's figure of 218,000.
The probability that the central bank will leave rates unchanged is approximately 87%. Markets estimate the probability of another ECB rate cut before March 2026 at only 60%.
Trade recommendation: BUY 1.1660, SL 1.1625, TP 1.1710

DAX Resilience To Shine ThroughThe DAX Index continues to hold strength just beneath all-time highs, popping higher above 24,000 after three consecutive sessions of gains.
Bulls are keeping control through strong earnings in tech and auto sectors, combined with supportive macro tailwinds. However, the major resistance and previous ATH remain to be tested.
U.S. Interest Rate Path in Focus
The Federal Reserve held rates steady at its July meeting but left the door open for a possible cut in September, should inflation and labor market data soften.
Markets are pricing in an increasing probability of a cut, which is fueling optimism across global equities.
A dovish Fed supports global risk sentiment and weakens the USD, indirectly benefiting European exporters.
ECB Holds, But Dovish Undertone Grows
The European Central Bank left rates unchanged in its latest decision, but ECB President Christine Lagarde acknowledged that “disinflation is progressing” and that further tightening is unlikely.
Forward guidance was interpreted as dovish, with the market now expecting a cut by December, possibly sooner if economic activity remains sluggish.
A dovish ECB lowers borrowing costs and improves equity risk premiums, especially for cyclical-heavy indices like the DAX.
EU–U.S. Trade Tensions
Recent rhetoric from U.S. officials, including renewed tariff threats on European pharmaceutical and automotive exports, has reignited trade tensions.
The EU has signaled its willingness to respond proportionally, but negotiations are ongoing.
While no measures have been enacted yet, uncertainty over trade policy is capping some upside momentum in European equities.
German automakers and industrial exporters are vulnerable to tariffs. Continued trade uncertainty may limit gains unless diplomacy resolves key friction points.
The DAX remains resilient, buoyed by improving fundamentals, strong earnings, and global rate expectations.
The index is coiled just under a key psychological resistance at 24,000, with bulls eyeing a breakout toward the all-time high near 24,639.
Momentum remains favorable, but traders should watch macro headlines and volume closely around resistance zones.
