EURUSD - Will the parallel channel hold?Introduction
The EURUSD is currently trading within a well-defined bullish parallel channel. While this channel suggests an overall upward trajectory, there is an important imbalance in how price has interacted with its boundaries. The upper side of the channel has relatively few touchpoints compared to the lower side, which has already been tested multiple times. This creates an interesting dynamic where both bullish and bearish scenarios remain in play. The pair is also trading within two significant 4-hour fair value gaps (FVGs), and the critical question now is which side will give way first, determining the next directional move.
The Parallel Channel
Within this parallel channel, price action has been leaning more heavily toward the downside, as shown by the fact that the lower boundary has been tested four times already. The upper boundary, however, has only registered a single touch, making it less validated. This imbalance implies that there is notable pressure on the downside, but at the same time, the presence of a bullish 4-hour fair value gap near the lower boundary cannot be ignored. This gap provides a potential level of support that could initiate a reversal back toward the upper side of the channel.
Potential Bullish Bounce from Support
The alignment of the lower trendline of the channel with the 4-hour bullish fair value gap creates a strong technical confluence. This support zone, located around the 1.166 – 1.165 area, could act as a springboard for buyers. If price respects this level, a bullish bounce could occur, pushing EURUSD back toward the upper region of the channel. In this scenario, the market would likely target the remaining inefficiencies left by the bearish 1-hour and 4-hour fair value gaps above, potentially leading to a liquidity grab in that zone.
Bearish Breakdown Scenario
On the other hand, if EURUSD fails to hold the support at the bullish 4-hour FVG, a bearish breakdown becomes increasingly likely. In that case, both the channel structure and the previously supportive FVG would flip into resistance, reinforcing bearish momentum. Should this play out, the pair could decline toward the next major 4-hour FVG around the 1.156 level in the near future. This would represent a meaningful breakdown of the current bullish structure, opening the door for further downside.
Conclusion
The EURUSD sits at a decisive point within its bullish channel. The key lies in whether the support confluence of the 4-hour bullish FVG and the lower trendline will hold. If it does, the pair has room to climb higher and fill inefficiencies above. If it breaks, however, a move down toward 1.156 seems likely. Traders should closely monitor these zones, as the resolution of this consolidation will determine whether EURUSD extends its bullish momentum or shifts into a deeper retracement.
-------------------------
Disclosure: I am part of Trade Nation's Influencer program and receive a monthly fee for using their TradingView charts in my analysis.
Thanks for your support. If you enjoyed this analysis, make sure to follow me so you don't miss the next one. And if you found it helpful, feel free to drop a like 👍 and leave a comment 💬, I’d love to hear your thoughts!
EURUSD

EURUSD Short Idea! 4H, RR 1:5Daily Trend line broke and being tested back on fibonacci retracement and trend line resistance.
It looks like there is some downward movement coming possible till the key zone. Cheers! Let’s see!

Silver Roadmap: Key Supply at 38.8 or a Breakout to 39.6?Price is consolidating around 38.0, after recovering from July’s breakdown, currently sitting just below the weekly supply/resistance zone at 38.3–38.8, with liquidity resting above 39.2–39.6. The nearest and strongest daily demand lies at 36.6–35.5 (origin of the prior impulse and multi-touch base).
Momentum/RSI on the daily chart is neutral (not overbought), with the latest rally built on shallow pullbacks → a favorable context for potential “stop-hunts” above supply before the market makes a decision.
COT (Aug 12): Non-commercials remain net long but have been trimming positions (longs ↓, shorts ↑), while commercials stay net short → bullish positioning is cooling, often a precursor to range-bound or corrective phases.
Retail sentiment: roughly 52% short / 48% long, not at extremes → no strong contrarian signal.
Seasonality: August tends to be slightly bullish for silver on 10–20 year averages, while September is historically negative → current tailwind may turn into a headwind ahead.
🔎 Bias: Neutral with a bearish tilt at 38.3–38.8, unless a breakout is confirmed; elevated risk of false breaks toward 39.3–39.6 before potential downside rotation.
Key catalysts to watch: DXY and real yields (inverse correlation), gold performance, US macro releases (CPI, ISM, NFP), and Chinese data (PMIs/industrial growth).
A stronger USD or rising yields would favor the bearish case from 38.8, while a weaker USD combined with a gold breakout would increase the odds of a liquidity sweep toward 39.6.

EURUSD My Opinion! SELL!
My dear friends,
Please, find my technical outlook for EURUSD below:
The instrument tests an important psychological level 1.1675
Bias - Bearish
Technical Indicators: Supper Trend gives a precise Bearish signal, while Pivot Point HL predicts price changes and potential reversals in the market.
Target - 1.1658
Recommended Stop Loss - 1.1686
About Used Indicators:
Super-trend indicator is more useful in trending markets where there are clear uptrends and downtrends in price.
Disclosure: I am part of Trade Nation's Influencer program and receive a monthly fee for using their TradingView charts in my analysis.
———————————
WISH YOU ALL LUCK

EUR/USD : Is a bearish wave about to occur?Hello everyone, it's great to see you again.
Today, I will dive into the long-term analysis of FX:EURUSD on the D1 chart. At the time of writing, the price is moving around 1.165 and has shown a slight decrease after the market recently failed to break through the significant resistance around the recent highs, forming a new trendline boundary.
Currently, the price is moving towards the active zone of the 89 EMA, around the 1.140 level, aiming to find new momentum. However, as long as the price remains below the aforementioned resistance zone, the trend remains bearish, and I expect the price to drop to lower targets as outlined in the analysis.
What do you think? Do you share the same view? Leave your thoughts in the comments!

EUR/USD Bullish But... Trendline📊 EUR/USD Technical Analysis – August 19, 2025
The Euro/Dollar pair is currently trading around 1.1657, showing consolidation after recent strong moves.
🔹 Key Fibonacci Levels
Immediate resistance at 1.1687 (38.2%).
Psychological and technical barrier at 1.1775 (50%).
Major resistance at 1.1867 (61.8%).
Upside extension projected towards 1.2159 if the bearish trendline is broken.
🔹 Trend
The descending trendline (in purple) continues to act as a dynamic ceiling. Unless broken decisively, upside potential may remain limited.
🔹 Important Supports
First support at 1.1575 (23.6%).
High-liquidity zone between 1.1450 – 1.1370, crucial to maintain the medium-term bullish structure.
A break below 1.1275 could open the door to a deeper correction.
📌 Conclusion:
The pair is at a decision point. A breakout above the trendline and 1.1687 could trigger fresh bullish momentum. On the other hand, losing the 1.1575 – 1.1450 zone would increase the likelihood of a deeper pullback.

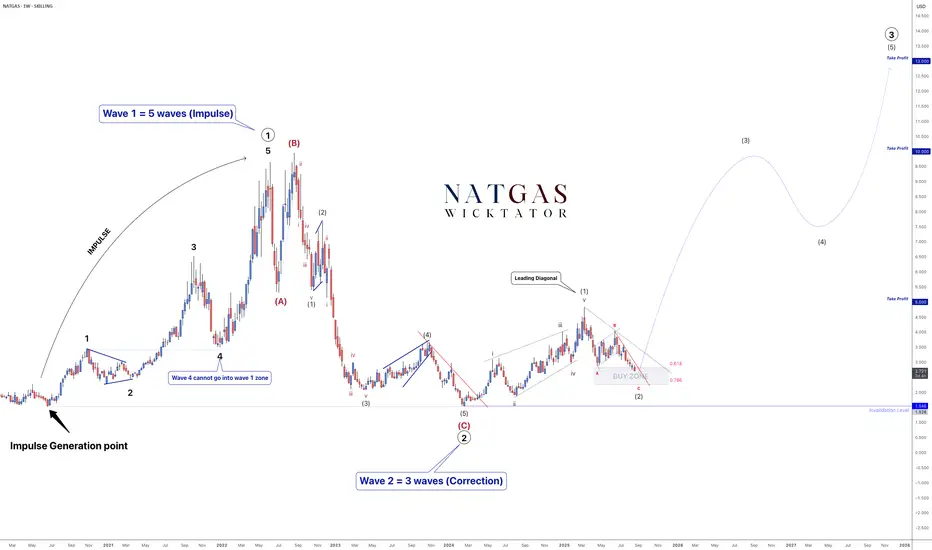
NATGAS - Catch The Impulse!As Wave Traders, our job is to spot corrections and catch the impulse, because that’s where the biggest moves happen.
On NATGAS, we completed Wave 1 with a leading diagonal, and are now finishing Wave 2 (an ABC correction). Once corrections are done, the next phase is Wave 3 - historically the longest and strongest wave in Elliott Wave Theory.
We've almost completed wave 2 and looking for a breakout for wave 3, which is the longest wave.
Trade Idea:
- Watch for break of the red trendline to indicate the start of wave 3
- enter with stops below breakout or below invalidation
- Targets: 5, 10, 13
NATGAS 12H Chart:
We'll be looking to enter on break of the red trendline with stops below breakout.
This setup is a textbook example of how Elliott Wave helps us prepare - not chase - the market.
Goodluck and as always, trade safe!
EURUSD Bullish Structure Break: Watching for Pullback EntryI’m closely monitoring EURUSD 📊, where price action is starting to show a bullish structure break 📈, signaling potential upside 🔝. On the 30-minute chart ⏱️, I’m watching for a pullback into the imbalance zone ⚖️ highlighted in the video 🎥. As long as price holds above the low of that imbalance range ⬇️, I’ll be looking for a potential long opportunity 🚀💡. (Not financial advice).

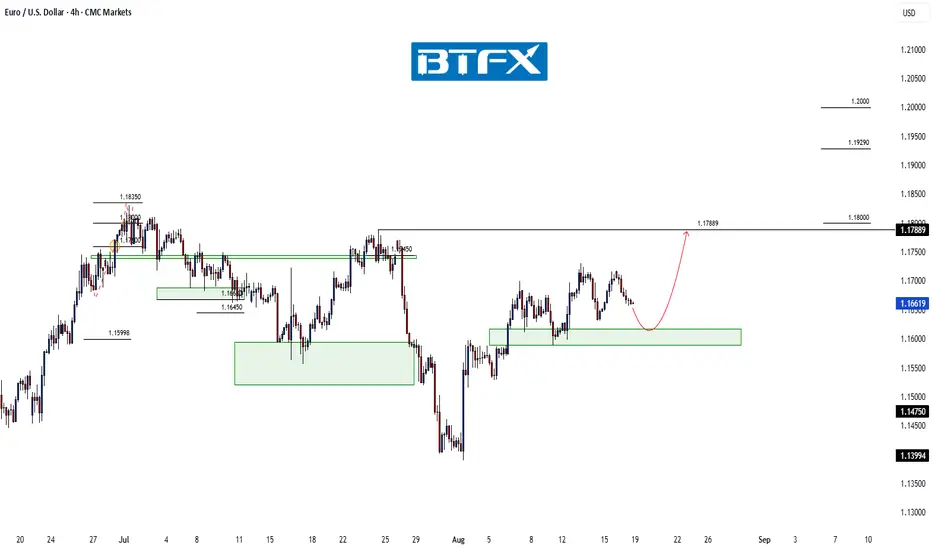
EUR/USD Structure Intact — Path Higher Remains in PlayHi Everyone,
Since the 1st August low, EUR/USD has rallied swiftly back above the 1.16000 level, reclaiming the key 1.16450 zone. If the current consolidation holds above the 1.15888–1.16170 area, this should provide a base for further upside toward 1.17889.
A sustained push into this level in the coming sessions would further confirm renewed buying interest.
Our broader outlook remains unchanged: we continue to expect the pair to build momentum for another leg higher. A decisive break above 1.18350 could open the path toward the 1.19290 area and ultimately the 1.20000 handle.
We’ll be monitoring price action closely to see whether this recovery gains traction and if buyers can maintain momentum through resistance. The longer-term outlook remains bullish, provided price continues to respect the key support zone.
We’ll keep you updated throughout the week as the structure develops and share how we’re managing our active positions.
Thanks again for all the likes, boosts, comments, and follows. We truly appreciate the support!
All the best for the rest of the week.
Trade safe.
BluetonaFX
EURUSD UPDATEAs you can see, EUR/USD has finally reached the upside target — the supply zone around 1.17000, where I identified an opportunity and entered short positions. This analysis was originally shared on August 3rd, and it has played out very well.
Currently, I have set three downside targets (marked with the red lines). At each level, I will closely monitor price action to decide whether to take partial profits. Depending on how the market reacts, I may also look for potential long entries in case of a reversal. If the market continues in my favor, I am satisfied with securing profits from the short trade.

EUR/USD: Short-Term Drop Before Recovery?Currently, EUR/USD is trading below the resistance at 1.16800 and could drop to 1.16000 if there is no recovery. The support at 1.16000 will be crucial in determining the next trend. If this support holds, the likelihood of a recovery to 1.16800 is high.
News Impact
The speech by Fed Chairman Jerome Powell could have a significant impact on monetary policy and affect the USD, increasing the chances of EUR/USD dropping. Meanwhile, peace talks between Russia and Ukraine could boost the euro if the situation improves.
Forecast
EUR/USD may experience a short-term decline, but there is still a chance for recovery if the support at 1.15998 holds.

EURUSD Is Bearish! Short!
Here is our detailed technical review for EURUSD.
Time Frame: 1D
Current Trend: Bearish
Sentiment: Overbought (based on 7-period RSI)
Forecast: Bearish
The market is testing a major horizontal structure 1.168.
Taking into consideration the structure & trend analysis, I believe that the market will reach 1.143 level soon.
P.S
Overbought describes a period of time where there has been a significant and consistent upward move in price over a period of time without much pullback.
Disclosure: I am part of Trade Nation's Influencer program and receive a monthly fee for using their TradingView charts in my analysis.
Like and subscribe and comment my ideas if you enjoy them!

EURUSD prices consolidate, ready to pullbackEURUSD prices consolidate, ready to pullback
On Tuesday, the dollar took a small hike against other major currencies as markets digested some news about a White House meeting with European countries regarding the conflict in Ukraine. This meeting could determine what happens next in the conflict. Tina Teng, an analyst, said that markets are being careful and there's a bit of a risk-avoidant mood. Stock indices hit record highs, which boosted the dollar. If there's an agreement on Ukraine, it could shift the burden to Europe, leading to money leaving the euro and pound and strengthening the dollar even more. Also, people are focusing on the Jackson Hole conference, where Fed Chair Jerome Powell will talk about interest rates.
Technically, EURUSD price has formed a bearish wedge. Bearish divergence on RSI is highlighted. The price is ready to drop towards 1.15000 level as a first target.

Gold Market Update and SWING Trade Plan with SL/TP ________________________________________
📊 Gold Technical Outlook Update – H4 & 2H Chart
📰 Latest Summary Headlines
• 🟡 Gold edges firmer as weaker USD provides short-term lift.
• 📉 Technical compression on charts signals potential sharp move.
• ⚠️ Rising wedge formation hints at possible breakdown risk.
• 🎯 Traders eye a slide toward $3,225 if bearish pattern confirms.
________________________________________
🏆 Market Overview
• 💰 Current gold price hovers near $3,345–3,348 per ounce, consolidating in a tight range.
• 🔄 Price action remains choppy, with no breakout beyond key levels in recent sessions.
• ⛔ Strong resistance sits at $3,410–3,420 USD, keeping rallies capped.
• ⚖️ Major support remains at $3,300–3,310 USD, forming the lower boundary of the range.
• 💱 Market sentiment is driven by softer USD and yields, with gold unable to gain decisive momentum.
• 🌪️ Volatility expected to persist as traders await stronger catalysts.
________________________________________
⭐️ Recommended Trade Strategy
• 🎯 Bearish Setup (2H/H4): Short gold near $3,410–3,420 resistance.
• 🛑 Stop-loss: Above $3,430 recent highs.
• ✅ Take profit: Initial target $3,310 USD, extension to $3,300 USD.
• 📊 Range trading remains the favored play—sell near resistance, buy near support.
• ⚡ Stay nimble for sharp moves if the wedge pattern resolves.
• 🛡️ Risk management is critical: use tight stops and scale positions accordingly.
________________________________________
💡 Gold Market Highlights
• 🛡️ Safe-haven demand underpins gold as investors hedge against uncertainty.
• 🏦 Institutional flows remain strong, though short-term pullbacks are likely.
• 💥 Compression on charts suggests an explosive move once direction is chosen.
• 📈 Current market levels: Gold spot ~$3,345–3,348, ETF (GLD) trades around $307.
________________________________________
📌 Summary
• 📏 Gold remains locked in a multi-week range between $3,300 support and $3,410 resistance.
• 📉 The wedge pattern on short-term charts favors a potential breakdown toward $3,225.
• 🐻 Short-sellers should wait for confirmation, while 🐂 bulls will defend key support zones.
• 🧭 Tactical range trading remains the best approach until a decisive breakout occurs.
________________________________________

EUR-USD Local Long! Buy!
Hello,Traders!
EUR-USD is making a local
Bearish correction following
The general USD strengthening
All across the board today
But the pair will soon
Retest a local horizontal
Support below at 1.1632
From where we will be
Expecting a local
Bullish rebound
Buy!
Comment and subscribe to help us grow!
Check out other forecasts below too!
Disclosure: I am part of Trade Nation's Influencer program and receive a monthly fee for using their TradingView charts in my analysis.

EURUSD at a Crossroads: The Battle at the 78.6% Fib LevelMarkets rarely move in a straight line. After a powerful rally was stopped by monthly supply, EURUSD has arrived at a critical crossroads. The higher timeframe trend is still bullish, but a potential daily downtrend is emerging. This analysis focuses on the single high-probability short setup that could define the next major move.
After the price found support at the 50% Fibonacci retracement level of the weekly structure , which coincided with the daily structure's break level, further decline was prevented by negative NFP news last Friday, which pushed the dollar index down. The long scenario from this level, which I detailed in my previous analysis " EURUSD: The Logic of Institutional Capital Unveiled ", is still active. An entry directly from that level was impossible due to the reversal occurring on highly volatile news, but it's still possible from the manipulation zone in the form of the bullish order block below.
This current analysis is a continuation of that one, but from the perspective of looking for short positions , as the price has shown its intention to first reach a zone of interest above. So, let's try to further unravel the logic and the next step of large capital.
The global uptrend of the pair was halted by a monthly supply zone , from which a correction began and subsequently reversed at the 50% weekly level. One might expect the uptrend to continue and only look for long entries. However, the fact that the price found its pivot point in a monthly supply zone and has since shown the potential genesis of a bearish daily structure allows us to consider counter-trend short trades, with fresh footprints from "smart money" to guide us.
On its continued ascent, the price will face resistance in the form of a bearish order block in conjunction with the 78.6% retracement level of the new, potentially bearish structure. Everything will depend on whether this level and order block hold and show a reversal reaction. The entry condition for a short will be the mitigation of this order block concurrently with reaching the 78.6% level, followed by price finding acceptance below it .
► Invalidation: Invalidation of the short scenario would be a break of the 78.6% level with the price finding acceptance above it.
In the case of a short setup forming and an entry being confirmed, the minimum target for the price will be the bullish daily order block below, which was formed during the liquidity sweep of the daily structure's break level.
A key global context for EURUSD to consider upon the mitigation of the daily bearish order block is the Dollar Index (DXY) . After breaking its bearish daily structure (BOS D) to the upside, it also began a correction after NFP. The target and potential reversal zone for DXY is the same as EURUSD's but a mirror image: the 78.6% Fibonacci retracement level in conjunction with a daily order block . It is highly probable that the potential setup formation on these two instruments will occur synchronously. Given their strong inverse correlation, a potential short setup on the euro pair would receive additional confirmation if a long setup forms on the Dollar Index.
~~~~~~~~~~~~~~~~~~~~~~~~~~~~~~~~~~~~~~~~~~~~~~~~~~~~~~~~~~~~~~~~~
The principles and conditions for forming the manipulation zones I show in this trade idea are detailed in my educational publication, which was chosen by TradingView for the "Editor's Picks" category and received a huge amount of positive feedback from this insightful trading community. To better understand the logic I've used here and the general principles of price movement in most markets from the perspective of institutional capital, I highly recommend checking out this guide if you haven't already. 👇
P.S. This is not a prediction of the exact price direction. It is a description of high-probability setup that become valid only if specific conditions are met when the price reaches the marked POI. If the conditions are not met, the setup are invalid. No setup has a 100% success rate, so if you decide to use this trade idea, always apply a stop-loss and proper risk management. Trade smart.
~~~~~~~~~~~~~~~~~~~~~~~~~~~~~~~~~~~~~~~~~~~~~~~~~~~~~~~~~~~~~~~~~
If you found this analysis helpful, support it with a Boost! 🚀
Have a question or your own view on this idea? Share it in the comments. 💬
► Follow me on TradingView for timely updates on THIS idea (entry, targets & live trade management) and not to miss my next detailed breakdown.
~~~~~~~~~~~~~~~~~~~~~~~~~~~~~~~~~~~~~~~~~~~~~~~~~~~~~~~~~~~~~~~~~

Bullish bounce for the Fiber?The price is falling towards the pivot and could bounce to the 1st resistance which acts as a multi-swing high resistance.
Pivot: 1.1591
1st Support: 1.1532
1st Resistance: 1.1715
Risk Warning:
Trading Forex and CFDs carries a high level of risk to your capital and you should only trade with money you can afford to lose. Trading Forex and CFDs may not be suitable for all investors, so please ensure that you fully understand the risks involved and seek independent advice if necessary.
Disclaimer:
The above opinions given constitute general market commentary, and do not constitute the opinion or advice of IC Markets or any form of personal or investment advice.
Any opinions, news, research, analyses, prices, other information, or links to third-party sites contained on this website are provided on an "as-is" basis, are intended only to be informative, is not an advice nor a recommendation, nor research, or a record of our trading prices, or an offer of, or solicitation for a transaction in any financial instrument and thus should not be treated as such. The information provided does not involve any specific investment objectives, financial situation and needs of any specific person who may receive it. Please be aware, that past performance is not a reliable indicator of future performance and/or results. Past Performance or Forward-looking scenarios based upon the reasonable beliefs of the third-party provider are not a guarantee of future performance. Actual results may differ materially from those anticipated in forward-looking or past performance statements. IC Markets makes no representation or warranty and assumes no liability as to the accuracy or completeness of the information provided, nor any loss arising from any investment based on a recommendation, forecast or any information supplied by any third-party.

EURUSD: Target Is Up! Long!
My dear friends,
Today we will analyse GOLD together☺️
The in-trend continuation seems likely as the current long-term trend appears to be strong, and price is holding above a key level of 1.16690 So a bullish continuation seems plausible, targeting the next high. We should enter on confirmation, and place a stop-loss beyond the recent swing level.
❤️Sending you lots of Love and Hugs❤️

EURUSD - One More Bearish Impulse Soon!Hello TradingView Family / Fellow Traders. This is Richard, also known as theSignalyst.
📈EURUSD has been overall bearish trading within the falling broadening wedge pattern marked in red and it is currently retesting the upper bound of the channel acting as a non-horizontal resistance.
Moreover, the blue zone is a strong supply.
📚 As per my trading style:
As #EURUSD retests the red circle zone, I will be looking for bearish reversal setups (like a double top pattern, trendline break , and so on...)
📚 Always follow your trading plan regarding entry, risk management, and trade management.
Good luck!
All Strategies Are Good; If Managed Properly!
~Rich
Disclosure: I am part of Trade Nation's Influencer program and receive a monthly fee for using their TradingView charts in my analysis.

EURUSD | Major Trend Reversal in Play? Bias: Sell Setup🧠MJTrading:
📸 Viewing Tip:
🛠️ Some layout elements may shift depending on your screen size.
🔗 View the fixed high-resolution chart here:
==================================================
📝 Idea: PEPPERSTONE:EURUSD | Major Trend Reversal in Play?
Bias: Bearish (Sell Setup)
📊 Structure Breakdown
- After the 2022–25 High at 1.18300, price has started forming Lower Highs and a Lower Low, hinting at a potential Major Trend Reversal (MTR).
- The Pressure Gap and Pullback rejection around the descending trendline strengthen the bearish outlook.
- Current Price Action suggests sellers are gradually taking control inside the Rising Wedge inside the Descending Channel:
ZOOM IN:
A 2nd leg is also possible.
📌 Trade Setup
Sell Entry: Around current price (~1.16800–1.17000).
Stop Loss: Above 1.18020 (invalidates the setup).
Targets:
TP1 → 1.15520 (mid-channel support).
TP2 → 1.14300 (major support zone - Channel Bottom line).
TP3 → 1.11800 (extension, strong liquidity pool).
Risk–Reward: Attractive multi-level downside with clear invalidation.
For confirmation wait for valid breakdown from the Rising Wedge...
“If the structure speaks to you, let it echo.”
#EURUSD #Forex #FX #Trading #TechnicalAnalysis #PriceAction #SmartMoney #MTR #MAJORTRENDREVERSAL #MarketStructure #TrendReversal #SwingTrading #DayTrading #ChartDesigner #MJTrading
Psychology Always Matters:

EURUSD Bears Regain Control as Dollar Strength Holds FirmEURUSD is showing fresh signs of exhaustion after its recent bounce, struggling to hold momentum against a resilient U.S. dollar. Price action has rejected trendline resistance and is now threatening to extend lower toward key demand zones. With the ECB battling slowing growth while the Fed remains cautious but firm, EURUSD faces mounting pressure to the downside.
Current Bias
Bearish – rejection at resistance keeps the pair vulnerable to further downside toward 1.1600 and potentially 1.1410.
Key Fundamental Drivers
U.S. dollar demand supported by safe-haven flows and relatively strong U.S. economic data.
ECB’s dovish tilt as growth falters in the Eurozone, limiting scope for additional rate hikes.
Differentials in monetary policy continue to favor the USD over the EUR in the medium term.
Macro Context
Interest rate expectations: The Fed is expected to keep rates higher for longer, maintaining a hawkish edge, while the ECB faces pressure to slow policy tightening given weak Eurozone growth.
Economic growth: U.S. growth remains more resilient than Europe’s, with Eurozone industrial and consumer sectors showing signs of fatigue.
Commodity flows: Lower European energy demand and potential disruptions in global gas/oil trade leave the euro vulnerable.
Geopolitical themes: Trade tariffs, global slowdown risks, and U.S.–EU policy divergence all weigh on the single currency.
Primary Risk to the Trend
A surprise hawkish shift from the ECB or softer-than-expected U.S. data could reignite EUR upside momentum and squeeze shorts.
Most Critical Upcoming News/Event
ECB policy meeting minutes (guidance on growth vs. inflation trade-off)
U.S. PMI & jobless claims (gauging the Fed’s stance on growth resilience)
Leader/Lagger Dynamics
EURUSD is a leader pair in the FX market, often dictating overall USD sentiment.
Movements here influence correlated assets such as DXY, gold, and EUR-crosses like EURJPY and EURNZD.
Key Levels
Support Levels: 1.1606, 1.1410
Resistance Levels: 1.1710, 1.1797
Stop Loss (SL): 1.1800
Take Profit (TP): 1.1606 (first target), 1.1410 (extended target)
Summary: Bias and Watchpoints
EURUSD continues to lean bearish, with rejection from resistance and a weakening Eurozone macro backdrop providing downside pressure. The bias favors further losses toward 1.1606, with extended downside into the 1.1410 region if bearish momentum accelerates. A stop loss above 1.1800 provides protection against a breakout reversal. Traders should closely monitor ECB commentary and U.S. data releases, as any divergence from expectations could quickly shift momentum. Until then, the path of least resistance remains to the downside.

EURUSD 4H Golden Cross kickstarting the next bullish phase.The EURUSD pair just formed its first 4H Golden Cross since May 29. Similar to that formation, this is taking place as the new Bullish Leg of the 4-month Channel Up has already started, following a bottom rebound near its 1D MA100 (red trend-line).
In similar fashion as that sequence, we expect it to reach at least the 1.1 Fibonacci extension on the short-term, which sits at 1.18750. If you're looking for an even higher extension, a +5.11% rise at 1.19700 is possible (also based on he previous Bullish Leg).
-------------------------------------------------------------------------------
** Please LIKE 👍, FOLLOW ✅, SHARE 🙌 and COMMENT ✍ if you enjoy this idea! Also share your ideas and charts in the comments section below! This is best way to keep it relevant, support us, keep the content here free and allow the idea to reach as many people as possible. **
-------------------------------------------------------------------------------
Disclosure: I am part of Trade Nation's Influencer program and receive a monthly fee for using their TradingView charts in my analysis.
💸💸💸💸💸💸
👇 👇 👇 👇 👇 👇

$EURUSD 15m Mark-UpAug 18 - Mark-Up Update
Analysis Note:
The demand zone failed, and price did not move toward the Asian high.
Currently, if price manages to maintain its bullish structure and shift character from this area on the lower timeframe, it may push upward. If not, it will likely head toward the weak low I marked, and we may see a 15-minute swing character shift.
By analyzing price action on the 5-minute timeframe, you can make a more precise decision for either scenario!
Follow us to never miss more analyses.
