EURUSD FRGNT Daily Forecast -Q4 | W46 | D11 | Y25 |📅 Q4 | W46 | D11 | Y25 |
📊 EURUSD FRGNT Daily Forecast
🔍 Analysis Approach:
I’m applying Smart Money Concepts, focusing on:
Identifying Points of Interest on the Higher Time Frames (HTFs) 🕰️
Using those POIs to define a clear trading range 📐
Refining those zones on Lower Time Frames (LTFs) 🔎
Waiting for a Break of Structure (BoS) for confirmation ✅
This method allows me to stay precise, disciplined, and aligned with the market narrative, rather than chasing price.
💡 My Motto:
"Capital management, discipline, and consistency in your trading edge."
A positive risk-to-reward ratio, paired with a high win rate, is the backbone of any solid trading plan 📈🔐
⚠️ Losses?
They’re part of the mathematical game of trading 🎲
They don’t define you — they’re necessary, they happen, and we move forward 📊➡️
🙏 I appreciate you taking the time to review my Daily Forecast.
Stay sharp, stay consistent, and protect your capital
— FRNGT 🚀
OANDA:EURUSD
Eurusdanalysis

EURUSD holding steadyThe U.S. markets are closed today, which suggests lower trading volumes and reduced volatility.
EURUSD is holding around the 1,1550 level as we watch for the next move.
Expect increased fluctuations on Thursday when the government is set to reopen.
The target remains unchanged. Avoid taking aggressive entries today.

EUR/USD Is Indecisive ?EUR/USD is trading with a bearish overall market structure on the 1-hour timeframe, currently below the key 1.1600 level. The pair is consolidating near resistance, with technical signals pointing to potential downside continuation unless new bullish catalysts emerge.
Technical Market Structure
Recent price rallied off the November low, with the current session showing consolidation just below resistance around 1.1565–1.1610.
Key support levels to watch are 1.1538 (recent H1 swing low), 1.1520, and 1.1460. A break below these could accelerate a move towards 1.1405.
The moving averages on the chart show a crossover pattern, suggesting short-term bullish exhaustion and possible transition back to bearish momentum.
Short-term corrective moves are possible up to 1.1590–1.1610, but rejection here could favor another wave down.
Elliott Wave and price envelope analysis forecast consolidation or short-lived correction followed by decline toward 1.1450 or lower.
Fundamental Analysis
Fed rate cut bets are driving market dynamics. The FOMC lowered rates by 25 basis points at the last meeting, and although another cut in December is possible, the decision is split among policymakers, causing uncertainty.
Recent weak U.S. labor data and political gridlock are weighing on the dollar, supporting euro strength in the very short term.
ECB policymakers are signaling steady rates, with limited downside for the euro and potential for euro strength over the coming months if the Fed enters a rate-cutting cycle.
Upbeat Eurozone data (ZEW sentiment, GDP, investor confidence) due this week could boost EUR/USD, but bearish risk remains if Fed rate cut expectations fade or U.S. macro data improves.
Potential Daily Movement
Bias leans bearish for the day unless EUR/USD can break and hold above 1.1590–1.1610, which could open upside to 1.1700.
Downside targets for further weakness include 1.1530, then 1.1460, and potentially 1.1405 if support fails.
In the event of renewed risk-on sentiment from U.S. shutdown resolution or positive Euro data, a push to the next resistance zone (1.1610–1.1690) is possible, but strong sellers remain active at these levels.
Key Levels Table
Zone Level Action
Resistance 1.1590–1.1610 Sell/reject if fails
Resistance 1.1690–1.1770 Strong sellers above
Support 1.1530–1.1460 Watch for breaks down
Support 1.1405 Bearish extension zone
Upside Target 1.1700+ Bullish if breakout
Overall, expect choppy intraday price action with a bearish tilt unless external fundamentals force a decisive bullish breakout above 1.1610 resistance.

TIME TO SELL EURUSD! amazing opportunity..EURUSD has recently broken a powerful channel that it was stuck in-between for several weeks and struggled to break upwards. The price also tried to retrace back to the upside but it struggled and could not break through the 0.618 level (which is acting as resistance). There is also a trendline which the price is struggling to break through towards the upside (resistance number 2). The price is very likely to keep dropping and head to our target zone (next major support level) - SELL !

EUR/USD: A short position may be coming soon.💹 **EUR/USD Update:**
The 1.1580–1.1600 zone remains a **strong resistance area** for EUR/USD. Next week, the pair may attempt to break above this level. However, if it fails to do so, we could see a **pullback toward 1.1400**, and possibly even **1.1300**, which stands as a key **support zone**.
👉 Keep an eye on price action around these levels — a rejection here could signal a potential short opportunity.

EUR/USD: Bearish Setup Confirmed After Head and Shoulders BreaksHi guys!
The chart shows a Three Drives pattern followed by a Head and Shoulders formation, both signaling potential bearish continuation.
The Three Drives Pattern:
The price completed three consecutive bullish drives, each showing signs of exhaustion. This structure often indicates a weakening uptrend and prepares the ground for a larger reversal.
The Head and Shoulders Pattern:
After the third drive, the market formed a clear head and shoulders structure, confirming distribution at the top. The neckline has already been broken, suggesting a shift from bullish to bearish sentiment.
Current Structure and Expectation:
Price is now retesting the neckline area after the breakdown. A rejection from this level would likely trigger a deeper decline toward the highlighted target zone, which aligns with previous demand and the flip area.
Target:
The projected target of the head and shoulders pattern falls near 1.12500, matching the lower pink zone on the chart.
In summary, unless the market decisively reclaims the neckline and trendline support, EUR/USD remains biased to the downside, with the 1.1250 area as the next key level to watch.
Disclaimer: As part of ThinkMarkets’ Influencer Program, I am sponsored to share and publish their charts in my analysis.

Important week ahead for EURUSDA crucial week is coming for the market. The U.S. government is expected to resume operations by the end of the week, which will allow the release of the delayed economic data.
On Thursday, inflation data will be published — the key factor that could determine the next major move.
EURUSD has reached the resistance zone and bounced off it.
Now, the focus is on whether a higher low will form.

EURUSD BUY TRADE As a key level zone trading strategy trader.
Am seeing an opportunity on EURUSD for a buy
Entry: 1.15469
Stop loss: 1.15274
Take profit: 1.6655
You can comment your opinion

Euro Sentiment: What’s Ahead in the Next Few DaysRetail positioning tells a clear story:
70% short / 30% long on EUR/USD
→ That’s a textbook setup for a long .
The crowd is bearish — but structure favors bulls.
From a technical standpoint, we’re seeing a solid corrective move up from 1.15, with even a mini-higher high – higher low pattern forming — yes, like the ones in classic TA textbooks.
It looks not just logical… but inviting.
Now let’s look at the options market:
There’s real bullish momentum building:
1. Naked calls being bought
2. Call spreads actively traded
My focus is on two key structures:
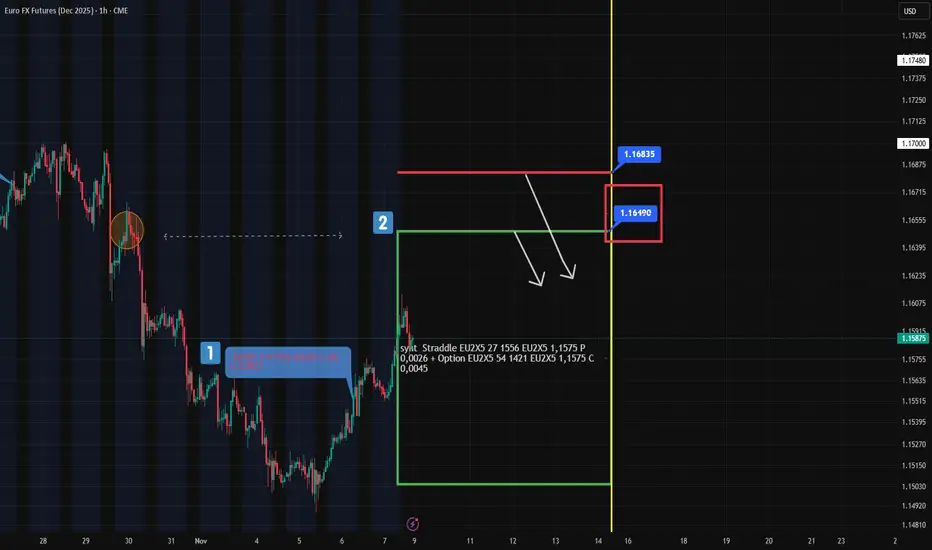
First, the call at 1.165, entered on November 6 — now already in the money (#1 at chart)
Friday’s straddle at 1.1575 — its upper boundary aligns perfectly with the trigger level from October 29 (#2 at chart)
🎯 Confluence? Yes.
🔍 Putting It All Together:
We have fuel for further upside in EUR:
Retail overcrowded short
Technical structure improving
Options flow turning bullish
But resistance looms ahead:
1.1649 and up to 1.1683 (futures prices) are strong zones
These levels could cap the upside move and offer high-probability short setups
👉 In particular, 1.1649 stands out as an ideal zone to consider a short.
On Monday, I’ll calculate the Expected Range (ER) levels — and if it aligns with this resistance, I’ll definitely place a limit order here.
Not using ER levels yet?
Spend one minute learning them — and gain the edge most traders overlook.
EUR/USD Market Outlook – Bullish Projection from 1.14586 Demand The EUR/USD pair is expected to pulled back into a major demand zone around 1.14586, which aligns with a previously respected accumulation area on the chart. This zone has consistently acted as a reaction point, and current price behavior shows buyers stepping back in after a corrective move to the downside.
From this 1.14586 zone, I expect EUR/USD to continue pushing higher toward the major liquidity pool and previous swing high located around 1.1917 – 1.1918. This level represents a key supply zone that price left unmitigated during the last impulse, making it a logical target for bullish continuation.
The red line below price marks your stop loss, positioned beneath the deeper demand block around 1.1391 – 1.1392. This is an appropriate structural invalidation point: if price breaks below that zone, bullish momentum would be negated, and the upward projection would no longer be valid.
Summary of the Setup:
• Entry Bias: Bullish from the 1.14586 demand zone
• Stop Loss: Below 1.1391–1.1392 red line (structural invalidation)
• Primary Target: 1.1917–1.1918 previous high/supply zone
• Outlook: Expecting a continuation toward the high as long as price remains above the demand zone
This structure provides a clear risk-to-reward framework and aligns with the zones highlighted on my FOREXCOM:EURUSD chart.

EUR/USD Bearish Reversal SetupEUR/USD 1-hour chart shows a potential bearish move after a break of structure (BOS). Price is expected to decline from the 1.1529 resistance zone toward the 1.1510 target level.

EURUSD Bullish for 1.1560#eurusd daily chart bearish forming lower low and lower high. broke down strong trendline strong support level 1.1528 which is low of 5th August. suspect price may drop further to test previous demand 1.1420-1393. which is the level of interest for buying short term. stop loss below 1.1375, target: 1.1560

DeGRAM | EURUSD broke the support line📊 Technical Analysis
● EUR/USD remains in a descending structure, respecting the resistance line drawn from previous swing highs. The pair is consolidating near 1.1490 after multiple rejections from 1.1530, suggesting continued bearish momentum.
● A breakdown below 1.1450 support would confirm further downside potential toward 1.1420, aligning with channel projection targets.
💡 Fundamental Analysis
● The euro stays pressured as the ECB signals extended dovish policy while the dollar strengthens on robust U.S. labor data.
✨ Summary
● Short bias toward 1.1450–1.1420; resistance at 1.1530 limits recovery potential.
-------------------
Share your opinion in the comments and support the idea with a like. Thanks for your support!

DeGRAM | EURUSD is under the support line📊 Technical Analysis
● EUR/USD continues to trade within a descending channel, respecting the resistance line drawn from the October highs. A breakdown below 1.1510 could extend losses toward 1.1490–1.1450, confirming short-term bearish momentum.
● The price action shows consistent lower highs and failed breakouts above the resistance zones, signaling continued seller dominance.
💡 Fundamental Analysis
● The euro remains pressured by weak Eurozone manufacturing data and hawkish Fed tone, favoring further dollar strength.
✨ Summary
● Short bias below 1.1530; target 1.1490–1.1450. Bearish channel structure aligns with dollar-positive fundamentals.
-------------------
Share your opinion in the comments and support the idea with a like. Thanks for your support!

EUR/USD Outlook: Buyers Regain ControlThe EUR/USD market is beginning to show early signs of recovery momentum as sentiment gradually turns constructive. After an extended period of controlled weakness, the pair is attracting renewed interest from institutional participants positioning for a potential upward rotation in the coming sessions.
Market tone has shifted from defensive to cautiously optimistic. Liquidity distribution across recent sessions indicates accumulation behavior at lower price zones, often a precursor to a bullish transition. Traders appear to be building exposure in anticipation of improved Euro-area sentiment and potential easing of dollar strength, both of which may provide the foundation for a broader corrective advance.
Price action suggests that selling pressure is losing effectiveness as downside extensions are quickly absorbed. The slowdown in bearish momentum combined with increased buying participation signals a developing phase of re-accumulation, where stronger hands begin to dominate short-term flows.
Confidence is gradually improving, supported by expectations that market equilibrium is tilting back toward Euro favor. While volatility remains moderate, structural patterns imply that the market may be preparing for a sentiment-driven expansion to the upside. The tone of order flow has shifted toward buy-side liquidity, pointing to a constructive environment for continuation of the upward phase once momentum fully confirms.
In summary, EUR/USD appears to be entering the early stage of a bullish rotation characterized by accumulation, strengthening sentiment, and declining downside conviction. The pair is poised for potential medium-term appreciation as market positioning aligns with renewed optimism toward the Euro’s relative outlook.

Possible long on EURUSD Monday swept through Liquidity and gave us a good CHoCH today so we can can possibly see some buys coming in
Risk wisely

EUR/USD Bullish Breakout Toward 1.15700 TargetEUR/USD is showing bullish momentum from the support zone near 1.1500. Price is forming higher lows, suggesting a potential move toward the resistance targets at 1.1540 and 1.1570, with the main target set at 1.15700.

EURUSD and GBPUSD Analysis todayHello traders, this is a complete multiple timeframe analysis of this pair. We see could find significant trading opportunities as per analysis upon price action confirmation we may take this trade. Smash the like button if you find value in this analysis and drop a comment if you have any questions or let me know which pair to cover in my next analysis.

EUR/USD WEEKLY ANNALISE 03-07 NOV 2025 🕓 5️⃣ ENTRY STRATEGY (LOWER TIMEFRAME CONFIRMATION)
The chart note says:
“Take sells on LTF confirmation — 5M TF would be best.”
Meaning:
Don’t just sell blindly at OB/FVG.
Wait for confirmation on the 5-minute chart, such as:
Liquidity sweep (taking out short-term highs)
CHoCH / BOS (Change of Character)
FVG entry / OB retest in the 5M TF
This ensures precision entries with smaller stop loss and higher R:R.
🎯 6️⃣ TARGET ZONES (TAKE PROFIT AREAS)
There are three major downside zones:
Target Zone Price Area Description
Daily BPR ~1.1460 First key liquidity target; expected strong reaction here
Daily Imbalance (below) ~1.1420–1.1430 Second target; continuation zone
Monthly Next BISI/BPR (Next DOL) ~1.1370–1.1400 Final target zone — likely where a deeper reversal or pullback starts
Essentially, the analyst expects:
Retracement up → Tap into OB / FVG → Strong sell-off → Reach 1.1460 → Possibly extend to 1.1370 zone.
📉 7️⃣ EXPECTED PRICE MOVEMENT SUMMARY
Step-by-step projection:
Retrace Upward
Toward 1.1580–1.1620 (fill FVG + retest H4 OB)
Trigger Institutional Selling
After filling those imbalances, expect bearish rejection.
Drop Toward 1.1460
Hit Daily BPR (liquidity pool target)
Deeper Extension
Potential move to 1.1370–1.1400 range — the monthly rebalancing zone (next DOL).
⚙️ 8️⃣ OVERALL OUTLOOK
🔸 Bias: Bearish
🔸 Short-term: Retracement up to OB/FVG zone (sell zone)
🔸 Medium-term: Drop toward 1.1460
🔸 Long-term: Possibly extend to 1.1370–1.1400
🔸 Best entry confirmation: Wait for 5M liquidity sweep + CHoCH at sell zone
💬 9️⃣ Key Takeaway (Trader’s View)
This chart tells a story of smart money behavior:
Institutions engineered liquidity at the highs (London sweep),
Are now retracing up to rebalance price (fill FVGs / OBs),
Then planning to drive price lower toward unfilled inefficiencies and liquidity below.
So the goal for the trader:
Sell from premium zones (OB/FVG) → Target liquidity below → Manage risk with 5M confirmation.

EUR/USD Shorts towards 1.1440My analysis for this week is for EU to continue moving lower, in line with the current bearish trend. I’m watching for a potential pullback into the 5hr supply zone that recently caused a break of structure to the downside.
Once price taps into this area, I’ll wait for signs of distribution and confirmation entries to take shorts targeting the 16hr demand zone around 1.1440.
Confluences:
- Strong bearish structure with consistent breaks to the downside
- Multiple new supply zones, including the refined 5hr one near current price
- Significant liquidity resting below that still needs to be taken
- DXY remains bullish, supporting this bearish idea
- A clean pro-trend setup with no major news interference expected
P.S. If price breaches the 5hr supply, it’ll likely be due to it not being in a premium area. In that case, I’ll wait for price to reach higher premium levels before looking for another short setup — all depending on how price approaches the zone.

EUR/USD – Bullish Reversal Potential from Demand Zone EUR/USD – Bullish Reversal Potential from Demand Zone (Smart Money Outlook)
🧭 Market Structure Overview
The EUR/USD pair has been trading within a larger bearish framework, as evidenced by the prior Market Structure Break (MSB) and Bearish Change of Character (CHOCH) that confirmed bearish intent after price rejected from the Bearish Order Block (BE-OB) near the 1.17787 level.
However, recent price action indicates potential accumulation near the Demand Zone Area (1.15507 – 1.15005). This zone aligns with prior Break of Structure (BOS) support and a clear volume imbalance fill, signaling possible Smart Money interest in building long positions.
🔍 Key Structural Highlights
Liquidity Sweep (LQDT) above previous highs marked the start of the bearish leg, confirming liquidity engineering before mitigation of the BE-OB.
The MSB confirmed bearish control, followed by a Bearish CHOCH, maintaining a lower-high and lower-low sequence.
Price eventually tapped into the Demand Zone Area, causing a Bullish CHOCH, which indicates potential reversal or at least a short-term bullish retracement phase.
The IDMT (Internal Daily Manipulation Target) zone shows internal liquidity being swept, further validating Smart Money activity.
🟩 Demand Zone Analysis
The Demand Zone Area (1.15507 – 1.15005) has been highlighted as a key accumulation region.
This zone sits below prior equal lows, making it a high-probability liquidity grab region.
Strong reaction wicks and volume buildup in this area suggest that institutional players may be filling long orders.
A potential bullish CHOCH from this zone could confirm the start of a new short-term bullish leg targeting premium levels.
🟥 Premium Supply Zones (Sell Areas)
1.16179 – Minor intraday supply level, potential first rejection area for pullbacks.
1.17256 – Intermediate liquidity target and imbalance fill zone.
1.17787 – Major Bearish Order Block (BE-OB), serving as a high-probability reversal area if bullish retracement extends.
🔄 Projected Price Path (Outlook)
Price is expected to follow a reaccumulation pattern inside the demand zone:
A final liquidity sweep below 1.15507 may occur to trigger late shorts.
A bullish displacement from the demand zone could signal a short-term BOS to the upside.
Price may then target 1.16179 → 1.17256 → 1.17787, where further liquidity rests above internal highs.
If buyers fail to defend the 1.15005 level, bearish continuation toward deeper discount levels would be confirmed.
📈 Trading Plan (Educational Purpose Only)
Buy Scenario: Wait for a confirmed bullish CHOCH and displacement from the Demand Zone Area, then look for mitigation of a bullish order block.
Sell Scenario: Watch for bearish rejections or liquidity sweeps around 1.17256 – 1.17787 (premium region).
🎯 Target Levels
🎯 Bullish Targets
TP1: 1.16179 → First structural target (previous minor supply zone).
TP2: 1.17256 → Key liquidity pool & imbalance fill zone.
TP3: 1.17787 → Major BE-OB (final upside mitigation before potential sell-off).

EUR/USD BEARISH CONTINUATION SETUP BELOW SUPPLY ZONE🔍 Key Observations:
1. Market Structure:
The chart shows a clear break of structure (BOS) to the downside, confirming bearish control.
Multiple CHoCH points show the transition from a bullish correction to renewed bearish pressure.
2. Supply Zone Rejection:
Price retraced into a supply zone (around 1.1535–1.1565) and got rejected.
This zone aligns with a premium entry area, ideal for short positions.
3. Entry & Risk Management:
Entry: Around 1.1533–1.1535
Stop Loss: Above 1.1565 (previous minor high / invalidation level)
First Target (TP1): 1.1501 – short-term liquidity pool
Second Target (TP2): 1.1461 – next demand zone / deeper liquidity area
4. Smart Money Flow:
The sequence shows liquidity sweep of minor highs followed by a strong displacement candle downward.
Suggests institutional selling resuming after retracement.
5. Momentum Outlook:
Unless the price breaks above 1.1565, the bearish trend remains intact.
Any pullback toward 1.1540–1.1550 can provide another sell opportunity.
📉 Bearish Trade Plan Summary:
Bias: Bearish
Entry Zone: 1.1533 – 1.1535
Stop Loss: 1.1565
Target 1: 1.1501
Target 2: 1.1461

EUR/USD: Bearish Pullback to 1.155?FX:EURUSD is flashing bearish signals on the 4-hour chart , where price is respecting a downward trendline with successive lower highs, indicating ongoing weakness and potential for further downside as sellers maintain control near the resistance zone. This setup points to a classic continuation pattern if the trendline holds as resistance.
Entry zone between 1.168-1.170 for a short position. Target at 1.155 near the support zone, offering a risk-reward ratio greater than 1:2.5 . Set a stop loss on a close above 1.1745 to protect against an upside break. Look for confirmation on a breakdown below the entry with rising volume, amid persistent USD strength over the EUR.
Fundamentally , this week features key GDP releases from the Eurozone (Q3 flash on October 29) and the US (Q3 advanced on October 30). Additionally, the upcoming meeting between Trump and Xi could lead to a US-China trade agreement or lack thereof, significantly impacting markets. 💡
📝 Trade Plan:
🎯 Entry Zone: 1.168 – 1.170 (short setup near resistance)
❌ Stop Loss: Close above 1.1745
✅ Target: 1.155 (support zone)
💎 Risk-to-Reward: Greater than 1:2.5, offering a high-quality short opportunity within the prevailing bearish trend.
What's your outlook on this setup? Drop your thoughts
