EUR/USD: Bearish Pullback to 1.156?FX:EURUSD is flashing bearish signals on the 4-hour chart , where price is testing a downward trendline with successive lower highs, signaling continued weakness in the pair. The good entry point aligns near the EMA 200 (acting as dynamic resistance) and a key resistance zone, setting up for a potential downside continuation if sellers step in. 🎯
Entry zone between 1.167-1.169 for a short position. Target at 1.156 near the support zone for solid risk-reward. 📊 Set a stop loss on a close above 1.1725 to protect against upside breaks. 🌟 Look for confirmation on a break below the entry with increasing volume, amid ongoing USD strength against the EUR.
On the fundamental front , today—Wednesday, October 15, 2025,today's Eurozone Industrial Production data stands out as a key event for EUR, while speeches from several Federal Reserve members could influence USD movements. 💡
📝 Trade Plan:
✅ Entry Zone: 1.167 – 1.169 (short setup near resistance & EMA 200)
❌ Stop Loss: Close above 1.1725
🎯 Target: 1.156 (major support & take-profit zone)
What's your outlook on this setup? Drop your thoughts below! 👇
Eurusdbuy

EURUSD – Triple Top Zone Formed | Correction Expected Before FX:EURUSD
📊 📉
Market Overview
EURUSD continues to respect its ascending structure but is currently struggling to break above the top resistance, forming equal highs — a liquidity trap area.
A clean rejection here could drive price toward the 1.1620–1.1610 demand base before the next bullish impulse.
Buyers are expected to re-enter at this region to continue the broader bullish leg.
Key Scenarios
✅ Bullish Case 🚀 → After correction to 1.1620–1.1610, expect move toward 🎯 1.1650 | 🎯 1.1680
❌ Bearish Case 📉 → Break below 1.1600 may shift structure toward 1.1560 zone
Current Levels to Watch
Resistance 🔴 1.1645 – 1.1650
Support 🟢 1.1620 – 1.1600
⚠️ Disclaimer: This analysis is for educational purposes only. Not financial advice

EURUSD (30M) – Breakout Setup Loading FX:EURUSD
🚀
Structure | Trend | Key Reaction Zones
Price held firmly at the yellow demand zone, showing strong accumulation before reversal.
Now forming a symmetrical triangle, indicating compression before breakout.
Once the upper trendline breaks, we could see a sharp move toward the top blue resistance zone.
Market Overview
After multiple rejections from lower levels, EURUSD is coiling within a tight structure — a clear sign of energy build-up. The market is respecting higher lows and pushing for liquidity above 1.1610–1.1630. A clean breakout could send price toward 1.1648+ highs. Watch for confirmation candle closure above 1.1615 to trigger bullish momentum.
Key Scenarios
✅ Bullish Case 🚀 → 🎯 Target 1: 1.1630 → 🎯 Target 2: 1.1648 (Liquidity zone)
❌ Bearish Case 📉 → Invalidation below 1.1575
Current Levels to Watch
Resistance 🔴: 1.1630 – 1.1650
Support 🟢: 1.1575 – 1.1550
⚠️ Disclaimer: This analysis is for educational purposes only. Not financial advice.

eurusdIn scenario 1, if the support formed above holds, there is a possibility of an increase to the daily timeframe resistance. However, if the support formed is lost, there is a possibility of scenario 2 and a correction to the 4-hour timeframe trend line.

EURUSD BullishGoing for Long Trade with Limit Order in Discount Zone with Proper Risk Management, let's see what Price do next.

EUR/USD Technical Analysis: Potential Long EntryPrior Trend: The price action from September 16th to around September 22nd shows a period of upward movement followed by a sharp drop.
Channel/Pattern: A downward-sloping channel (sometimes called a parallel channel or a descending channel) has been drawn, indicating that the price has been consolidating and moving lower within a defined range since the major drop around September 22nd. This suggests a short-term bearish (downward) trend or a correction within a larger trend.
The Proposed Trade Setup (Long Position)
The rectangular box and lines drawn on the right represent a specific trade plan, likely a long (buy) entry based on a technical reversal or a break of the channel.
Element Price Level (Approx.) Interpretation
Entry (Yellow Box) 1.16257 to 1.16489 This is the proposed buy zone. It suggests entering a long trade if the price either pulls back into this area or stabilizes here.
Stop Loss (Red Line/Box) 1.16259 (or just below 1.16257) This is the maximum loss limit. If the price falls to this level, the trade would be closed to prevent further losses. This stop loss is placed very close to the entry, indicating a high-risk/high-reward or aggressive setup.
Take Profit (Upper Black/Yellow Line) 1.18553 to 1.18560 This is the target price. The goal is for the price to reach this level, which would be a significant move back toward the highs seen mid-September.
Export to Sheets
Technical Interpretation of the Setup
Potential Reversal Signal: The price has recently broken the upper boundary of the descending channel (seen with the small red and green candles on the 26th and 27th). The dashed white line inside the channel may represent the channel's midpoint, and the price is now moving above the lower half.
Trade Idea: The small red/purple lines drawn near the current price suggest a possible short-term pullback back into the buy zone (1.16257−1.16489) before a major move upward (the large red line). This is a common strategy: wait for a retest of a broken resistance (the channel top, which now acts as support) before entering.
Risk/Reward Ratio: The distance to the stop loss is very small compared to the distance to the take profit.
Risk: ≈23 pips (1.16489−1.16259).
Reward: ≈206 pips (1.18553−1.16489).
This gives a very attractive Risk/Reward Ratio of over 8:1 (Reward / Risk), which is excellent if the trade works out.
Key Considerations
Aggressive Stop Loss: The stop loss is extremely tight. A small fluctuation or "noise" in the market could trigger the stop loss, leading to a loss even if the price eventually moves up toward the target.
Target: The Take Profit target at ∼1.18560 is quite ambitious and represents a complete retracement of the recent sell-off. For this target to be reached, a significant shift in market sentiment or a major fundamental driver (like a news announcement) would likely be required.
Trend Confirmation: For this trade to be successful, the price needs to confirm that the downward channel is definitively broken and that a new upward trend is beginning.
In summary, the chart outlines a high-conviction, high-risk/high-reward long trade based on a potential breakout and reversal from a short-term descending channel.

EUR/USD Breakout: Riding the Bull After the Channel Collapse• The price action has been moving within a descending channel, marked by two parallel trend lines sloping downward.
• This pattern typically reflects bearish consolidation, but also sets up for a potential bullish reversal if the price breaks above the upper boundary.
🔓 Breakout Signal
• The chart shows a clear breakout above the upper trend line, suggesting a shift in momentum from bearish to bullish.
• Breakouts from descending channels often lead to strong upward moves, especially when confirmed by volume or momentum indicators (not shown here).
📈 Trade Setup Details
• Risk-to-Reward Ratio:
• Approximately 1:11, which is extremely favorable.
• This setup offers a tight stop with a large upside potential—ideal for swing traders.
🧠 Strategic Insights
• Momentum Shift: The breakout suggests buyers are gaining control, potentially reversing the prior downtrend.
• Entry Timing: The trade is designed to catch early bullish momentum post-breakout.
• Stop Placement: Smartly positioned to avoid market noise while minimizing risk.
• Target Zone: Ambitious but realistic if supported by broader market sentiment or macroeconomic factors.
🔍 What to Watch Next
• Retest of Breakout Level: A pullback to the breakout zone (around 1.07440) could offer a second entry opportunity.
• Fundamental Alignment: Consider checking economic indicators (e.g., ECB or Fed policy updates) to support the technical setup.
• Trailing Stop Strategy: As price moves toward the target, trailing the stop can help lock in profits

Buy 1.1720 - 1.1740 There’s a pullback today ↘️—we can go long directly now 🐂 and wait for a rebound 📈
Buy 1.1720 - 1.1740
TP 1.1760 - 1.1780 - 1.1800
Accurate signals are updated every day 📈 If you encounter any problems during trading, these signals can serve as your reliable guide 🧭 Feel free to refer to them! I sincerely hope they'll be of great help to you 🌟 👇

EURUSD to return bullish as it gets closer to 1.17000EURUSD is revising the bullish trendline level and is expected to continue its bullish move from there onwards.
DXY also remain bearish despite the heavy correction.
Please watch the video and let me know your thoughts.

EUR/USD Bullish Reversal Setup from Downtrend Channel (30m)”Chart Pattern
The price has been moving in a downward channel (red shaded area).
Recently, it touched the support level around 1.1766 – 1.1733 and is showing signs of slowing bearish momentum.
The setup suggests a potential bullish reversal if the support holds.
2. Key Levels
Support Zone: 1.1766 – 1.1733
Entry Point: Around 1.1766 (marked on chart)
Stop Loss: Below 1.1733
Target Point: 1.1919
3. Risk/Reward
Risk: ~33 pips (from 1.1766 down to 1.1733)
Reward: ~153 pips (from 1.1766 up to 1.1919)
Risk-Reward Ratio: ≈ 1:4.6 (very favorable)
4. Trade Idea
Buy Setup: If price confirms a bounce from the support zone (1.1766 area), a long trade could be valid.
Stop Loss: Keep it just below 1.1733 (to avoid false breakdowns).
Take Profit: 1.1919.
5. Notes
Watch for a confirmation candle (bullish engulfing, pin bar, or strong rejection) before entry.
If the price breaks below 1.1733, the bullish setup is invalid, and further downside may occur.
👉 In short: This chart is showing a potential bullish reversal setup after a downtrend channel, with a very good risk-to-reward ratio if the support holds.

EUR/USD: Bullish Surge to 1.183?FX:EURUSD is setting up for a bullish move on the 4-hour chart , with an entry zone between 1.16335-1.16650 near a key support and trendline.
The target range of 1.1808-1.183 aligns with the next resistance, offering strong upside potential. Set a stop loss on a close below 1.15740 to manage risk effectively. 🌟
A break above 1.1675 with solid volume could trigger this surge, driven by EUR strength and U.S. data shifts. Watch economic releases! 💡 Ready for this push? Drop your take below! 👇
📝 Trade Plan:
✅ Entry Zone: 1.16335 – 1.16650 (support + trendline area)
❌ Stop Loss: Daily close below 1.15740 to manage risk
🎯 Target Zone: 1.1808 – 1.1830 (next resistance)
Ready for this push? Drop your take below! 👇

EURUSD and Continuation of the upward trendWell, as you can see, it grew exactly based on the previous analysis I provided and continued along the same path... @mrshirafkan If it can stabilize at the specified level this week, it can continue its growth trend in the same direction again.

Let me tell you where the important support and resistance are.Hello friends
Given the positive price trend last week, we see that the closer the trend approaches its important resistances, the weaker it becomes, and the more likely the price will correct from these resistances.
If the price corrects from the specified resistances, the price can move to the specified targets, and we also have a good support area below that we expect buyers to support.
*Trade safely with us*

EURUSD target for w/c 15 SepEUR has a confluence of events that indicate where the action is headed. This zone may not be broken, but will likely be tested
1. Two short term Fib extentions to the long
2. a line of resistance from 9 September high

Fundamental Market Analysis for September 11, 2025 EURUSDThe euro is getting support as the market has a calmer view on the Fed: investors expect gentler moves later this year, so the dollar doesn’t look as strong as it did in mid-summer. At the same time, the ECB avoids sharp statements: the regulator is acting cautiously and making sure eurozone inflation doesn’t re-accelerate. In this environment, the euro feels more confident and can slowly climb toward 1.18000.
The US remains the key risk: if inflation or jobs data comes in much stronger than usual, the dollar will rise quickly and the euro may pull back. For now, the backdrop is neutral-to-positive for the euro: fewer market fears, stable rate expectations, and no “hawkish” surprises from Frankfurt. That makes buying moderately justified with controlled risk.
Overall: absent a major upside surprise in US data and without tough signals from the ECB, the pair has a chance to edge higher from current levels. The 1.18000 target looks realistic in the near term, and the stop level helps keep the position under control.
Trade idea: BUY 1.17000, SL 1.16850, TP 1.18000

EUR/USD breakout buy alert EUR/USD Buy Opportunity
Current Price: 1.17500
📈 Buy Entry Active — Targeting higher levels
✨ Euro showing bullish momentum against USD.
✨ Buyers are holding strong support at 1.17500.
✨ Upside pressure is building for a breakout.
✨ Trend indicates further gains ahead toward key resistance.
✨ Market sentiment favors the Euro as strength continues.
⚡ Stay with the buyers — momentum is on your side!
---
Do you want me to add specific target levels (like TP1, TP2, SL) to make it look more like a professional signal?

EURUSD Ahead of NFPEURUSD is holding its upward trend and staying above 1,1600.
Today, the U.S. jobs data will be released.
The news comes out at 1:30 PM London time and usually has a strong impact on the market.
It’s advisable to reduce risk on all open positions and avoid rushing into new trades.
Watch how the price reacts at key levels and whether it has the momentum to continue the trend.

EUR/USD Buy Setup from Support Zone towards 1.1743 TargetEUR/USD 2H Chart Analysis
The chart shows EUR/USD trading within a rising channel, with the price currently retesting the support zone (1.1600–1.1620).
Trend & Structure: Price has been respecting channel support and resistance. Currently, it bounced off the lower boundary of the channel, signaling a potential bullish reversal.
Support & Resistance: Strong support at 1.1600 zone, resistance/target at 1.1743.
Moving Averages: EMA 70 (1.1655) and EMA 200 (1.1648) are near, acting as dynamic resistance. A bullish break above them confirms upside continuation.
Candlestick & Momentum: Long wicks near support indicate buyer interest, suggesting accumulation before reversal.
Risk Management: Stop loss should be placed just below 1.1580 (last swing low).
✅ BUY Setup: From 1.1600–1.1620 support zone, targeting 1.1743 with stop loss below 1.1580.
📊 Strategies Used: Trendline channel, EMA confirmation, support/resistance, candlestick patterns, and risk-reward setup.

Previous EUR/USD Long I am now in the EUR/USD trade. I seen nice price rejection on the 15 minute time frame. TP & SL set.

EUR/USD Possible LongEUR/USD tested a key Fibonacci retracement level and is now retesting the trendline, where it has paused. The next move will depend on whether it can break through with volume and momentum, potentially targeting the key Fibonacci extension levels.

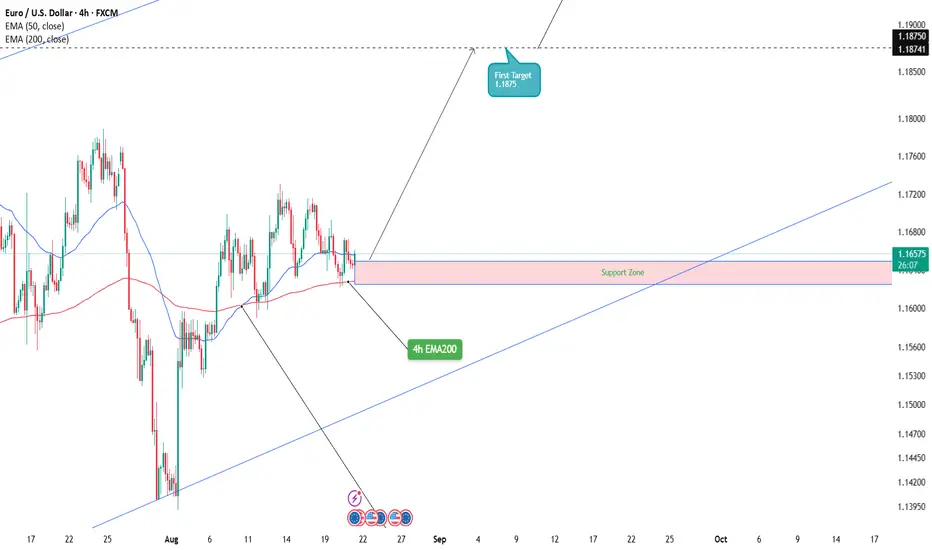
EUR/USD: Euro Rally to 1.197 on the Horizon? FX:EURUSD is poised for a bullish move on the 4-hour chart , with an entry zone at 1.165 near a solid support zone .
First target at 1.1875 marks initial resistance, while the second target at 1.197 aligns with a key psychological level. Set a stop loss on a 4-hours close below the 200 EMA to manage risk effectively.
A break above 1.17 with strong volume could spark this rally, driven by Eurozone data and USD softening. Keep an eye on ECB statements and U.S. economic releases as potential catalysts.
Ready to catch this wave? Share your thoughts below!
#EURUSD #ForexTrading #TechnicalAnalysis #TradingView #CurrencyPairs #DayTrading #MarketSignals
Descending Channel Exhaustion Bullish Reversal on the HorizonEURUSD Descending Channel Exhaustion Bullish Reversal on the Horizon
EURUSD continues to trade inside a clear descending channel, but price action is showing signs of exhaustion as it approaches a key liquidity zone. The structure suggests that buyers may soon take control, pushing price toward higher targets.
📊 MMFLOW Technical Outlook
Liquidity sweep near 1.16126 BUY ZONE signals strong potential for accumulation.
A breakout above the channel trendline will be the trigger for the bullish leg.
Key levels to the upside: 1.16694 – 1.16835 – 1.17064 – 1.17192.
💡 MMFLOW Trading Plan
Primary bias: Bullish – Buy dips near liquidity zones.
Entry ideas: Wait for confirmation at 1.16126 or a clean breakout + retest of 1.16694.
Short-term pullbacks can be scalped, but the main strategy favors swing longs.
📌 Key Levels to Watch:
Supports: 1.16126 – 1.1638
Resistances: 1.16694 – 1.16835 – 1.17064 – 1.17192
🚨 Risk Note:
Failure to hold above 1.16126 could extend the bearish channel lower. Always stick to TP/SL discipline.
✨ MMFLOW Reminder:
👉 Patience at KeyLevels = Profits
👉 Trade with the trend, not against it.

EUR/USD Bullish But... Trendline📊 EUR/USD Technical Analysis – August 19, 2025
The Euro/Dollar pair is currently trading around 1.1657, showing consolidation after recent strong moves.
🔹 Key Fibonacci Levels
Immediate resistance at 1.1687 (38.2%).
Psychological and technical barrier at 1.1775 (50%).
Major resistance at 1.1867 (61.8%).
Upside extension projected towards 1.2159 if the bearish trendline is broken.
🔹 Trend
The descending trendline (in purple) continues to act as a dynamic ceiling. Unless broken decisively, upside potential may remain limited.
🔹 Important Supports
First support at 1.1575 (23.6%).
High-liquidity zone between 1.1450 – 1.1370, crucial to maintain the medium-term bullish structure.
A break below 1.1275 could open the door to a deeper correction.
📌 Conclusion:
The pair is at a decision point. A breakout above the trendline and 1.1687 could trigger fresh bullish momentum. On the other hand, losing the 1.1575 – 1.1450 zone would increase the likelihood of a deeper pullback.
