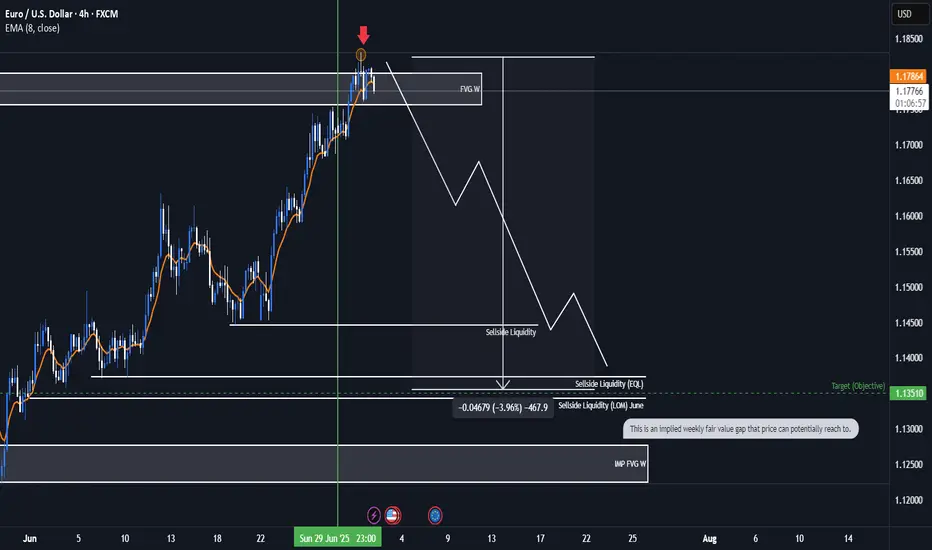
EURUSD Bearish ideaWe are in a weekly fair value gap that we have balance and potentially collected orders to prepare for a potential drop in price. We are anticipating a quarterly shift for the month of July were we could be targeting downside liquidity that is in open float.
* Fundamentals:
-Interest rate differentials shows us that USD interest rate of 4.5 is higher than the interest rate EUR 2.15 which lead to the longer fundamental frame work of price correcting to the higher dollar rate to the euro.
-The COT report also indicates to us that there is huge buying of Dollar by the commercials and a huge amount of selling of the EUR by commercials which can lead us to assume potential weaker dollar.
*Targeting:
-We are looking for the low of last month (June) to be taken out as well as even potentially reaching to the implied weekly fair value gap.
Eurusdoutlook
EUR/USD Analysis: Rally May Be Under ThreatEUR/USD Analysis: Rally May Be Under Threat
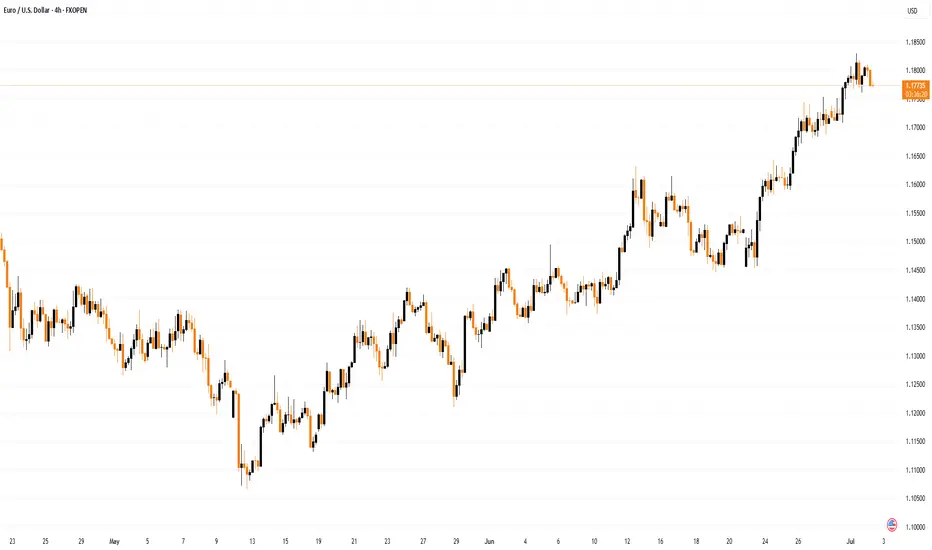
The euro has appreciated by approximately 15% against the US dollar this year, as confidence in the United States continues to wane. As ECB Chief Economist Philip Lane noted in an interview at CNBC: “There is a degree of reorientation by global investors towards the euro.”
At the same time, officials at the European Central Bank have expressed concern that the rapid strengthening of the euro could undermine efforts to stabilise inflation at 2%. They warn that a move above $1.20 may pose risks for inflation and the competitiveness of export-oriented firms — an issue raised during the ECB’s ongoing ECB Forum on Central Banking in Portugal.
Could EUR/USD Reach the $1.20 Level?
From a technical analysis perspective, EUR/USD is showing bearish signals:
→ If the early April rally (coinciding with Trump’s announcement of new tariffs) is taken as the initial impulse wave A→B, and the May low is interpreted as the end of the B→C corrective move, then, according to Fibonacci Extensions, the pair has now risen to a key resistance zone around 1.1850 (as indicated by the arrow on the chart).
→ In addition, the RSI indicator signals strong overbought conditions, while the price is hovering near the upper boundary of the ascending channel — a level that typically acts as resistance.
Given these factors, we could assume that EUR/USD may be in a vulnerable position, potentially facing a short-term correction — possibly towards the lower boundary of the channel, reinforced by support at the 1.1620 level. However, this does not negate the longer-term bullish outlook for the euro amid prevailing fundamental conditions.
This article represents the opinion of the Companies operating under the FXOpen brand only. It is not to be construed as an offer, solicitation, or recommendation with respect to products and services provided by the Companies operating under the FXOpen brand, nor is it to be considered financial advice.
NFP Bears gathering their troops? or will the Bulls stampede...The past 9 days have been quite interesting for the EUR/USD which has been relentless. Price has been rising like a helium balloon let loose at the park...
Bulls have clearly been in control, not only the past 9 days but since the beginning of the year with the exception of the strong pullback in April & May only to bounce for another 700 pip run.
I am totally USD bearish across the board as I have been mentioning in my analysis videos for the past few months but like all macro moves, we always have pullbacks along the way and that is why I have been shorting the EUR/USD back from 1.1500+ - 1.1700+
I've given this a lot of room to breathe, more than usual but considering the following technical setup, I'm willing to give the Bears some leeway and potentially show me they'll come through.
•Rising Broadening pattern (Where two trendlines start close together only to divergence and expand) - This is a bearish pattern.
•Negative Divergence on the MACD, Linear Regression & the RSI.
•Price has made a run to the yearly R3 pivot level. (Rare extension)
•Last daily candle is a hanging man candlestick (Reversal candle)
•Weekly chart has the EUR/USD at the upper band of a polynomial regression channel which calculates for price extremities in the market.
There are a few more setups as well but it's too much to describe here and I'd have to show it in a video (Which I plan to do over the weekend)
With all of that said... It could all fail lol but seriously speaking... You just can't ask for a better probabilistic setup so whatever happens during NFP... happens.
Aside from the technical aspect... I know yearly R2 around 1.1600 was a hotspot for shorts because divergence was at the early stages and taking a short there wouldn't have been a bad idea but we know institutions are in play as well, so above 1.1600 could have been a huge area to run stop losses and margin calls before a potential reversal.
250 pips would be enough to run a large pool of stops and liquidation.
IF price is going to reverse here during NFP, I believe late longs and breakout/pullback traders are going to try and buy at the trendline at 1.1660ish but it wont hold and trap them on the other side of the trade.
Under that, I can see us pulling back towards 1.1200ish...
If the Bears give up and price continues to climb... the original macro target may very well be under way which was 1.2000 - 1.2200 (Based on a Monthly and 3-Month chart analysis)
As of this writing the EUR/USD is pretty much completely flat which is expected before the NFP fireworks ahead of July 4th.
We'll see what happens tomorrow morning! buckle up!
As always, Good luck and Trade Safe! See you post NFP.

EurUsd - This is the deadly breakout!EurUsd - FX:EURUSD - is about to fly:
(click chart above to see the in depth analysis👆🏻)
EurUsd has been rallying about +15% over the past couple of months. Additionally the breakout at the current resistance trendline is about to be confirmed. Subsequently EurUsd is setting up for another major move higher, which will be painful for all European traders.
Levels to watch: $1.23, $1.11
Keep your long term vision🙏🙏
Philip (BasicTrading)

Ready to Swipe the Pips? | EUR/USD Heist Blueprint Unlocked🏴☠️💸 EUR/USD "Fiber Heist Plan" – Thief Trader Style 💸🏴☠️
The Vault is Open – Swipe the Bullish Bags! 🚀📈💰
🌟Hi! Hola! Ola! Bonjour! Hallo! Marhaba!🌟
Welcome, Money Makers & Market Robbers! 🤑✨
Here’s the latest masterstroke based on our Thief Trading Style™—a tactical breakdown of EUR/USD primed for a bullish breakout robbery. We’re targeting the red zone 🎯—where the weak hands panic, and the real players win.
🔓 Entry Plan (Buy Setup):
🟢 "The vault is wide open!" — We’re planning bullish entries using 15m–30m timeframe swing levels.
✅ Buy Limit Orders: Plot them smartly around most recent swing lows/highs.
⚠️ Chart Alert Suggested: Eyes on the prize, don’t miss the break-in.
🛑 Risk Guard (SL Setup):
💼 Stop-Loss: Set at nearest 30-min swing low (based on your risk appetite).
Remember, it’s about preserving your loot, not just grabbing it.
🎯 Target Area:
🎯 Primary Target: 1.19000
🎯 Optional Trailing SL: Ride the wave, lock the profits as price moves.
🧲 Scalpers' Notice:
Only scalp long. Got big pockets? Jump in. Smaller bags? Swing along.
💡 Trailing stop advised—don’t let the market steal your gains.
💹 Current Market Outlook:
EUR/USD is moving bullish—supported by technical signals, macro news, COT insights, and intermarket vibes.
🧠 Use all tools: Fundamental 📊 + Sentiment 🧭 + Quant + Bias Score 📈.
📎 Want the full breakdown? Check the 👉.Liinkk.🔗
(Keep updated, conditions shift fast!)
⚠️ News Risk Alert:
🚨 Stay alert during news drops—avoid fresh trades then.
Use trailing SLs to lock profits & guard against reversal raids.
💖 Support the Robbery Plan!
💥 Hit that Boost Button 💥 if you're riding with the Thief Team!
We steal smart, we trade sharp — every day’s a new heist in this market.
See you on the next plan! Stay legendary 🐱👤💸🤑🔥

EURUSD Bullish Setup: Watching for a Break and Retest📈 Looking at EURUSD right now, we’re in a strong bullish structure 🔼 — but it’s clearly overextended 🚀
As we head into the end of the week, there’s still potential for more upside today ⬆️ — but ⚠️ be cautious, since Fridays often bring retracements as we move into the weekly close 🕒📉
🔍 I’m watching for a bullish opportunity if we get a break above the current equal highs, followed by a retest and failure to break back below 🧠📊
If that setup doesn’t materialize, we’ll simply step aside and abandon the idea 🚫
💬 Not financial advice — always trade at your own risk.

EUR/USD Monthly Timeframe Analysis (SMC / ICT-Based) EUR/USD Monthly Timeframe Analysis (SMC / ICT-Based)
Current Price: 1.17437 (approx)
OB (Order Block):
A bearish order block is marked in the orange zone around 1.2250–1.2400, which aligns with a potential reversal point.
BSL (Buy-Side Liquidity):
Located just above the OB, targeting liquidity above prior highs. Price is expected to sweep this liquidity before reversal.
FVG (Fair Value Gap):
A red box indicating imbalance – likely an area price might react from once filled.
Supply Zones:
Upper Green Zone (~1.1400–1.1700): Price is currently reacting in this supply region.
Lower Green Zone (~1.1050): Previous structure and minor resistance.
SSL (Sell-Side Liquidity):
Marked at the blue demand zone (~0.9500–0.9800). The chart shows a long-term bearish projection toward this zone after a liquidity sweep.
📉 Projection Path:
Short-Term Bullish Move to the OB / BSL zone.
Liquidity Sweep above the highs.
Reversal from the OB zone.
Bearish Trend Continuation breaking below recent structure.
Final Target: Long-term drop toward SSL at 0.9500–0.9800 zone.
⚠️ Bias:
Short-Term: Bullish until OB is hit.
Long-Term: Bearish after liquidity sweep and OB rejection.

New rise in EURUSDYesterday, EURUSD continued its bullish movement, reaching 1,1807.
At current levels, all open buy positions should have their risk removed (e.g. stop loss at breakeven).
New buy entries are recommended only after a pullback with a favorable risk-reward setup.
Important news is expected later this week, which may lead to misleading price moves.
Reduce your risk and stay patient!

EUR/USD Extends Rally – Watching Resistance at 1.18000Hi Everyone,
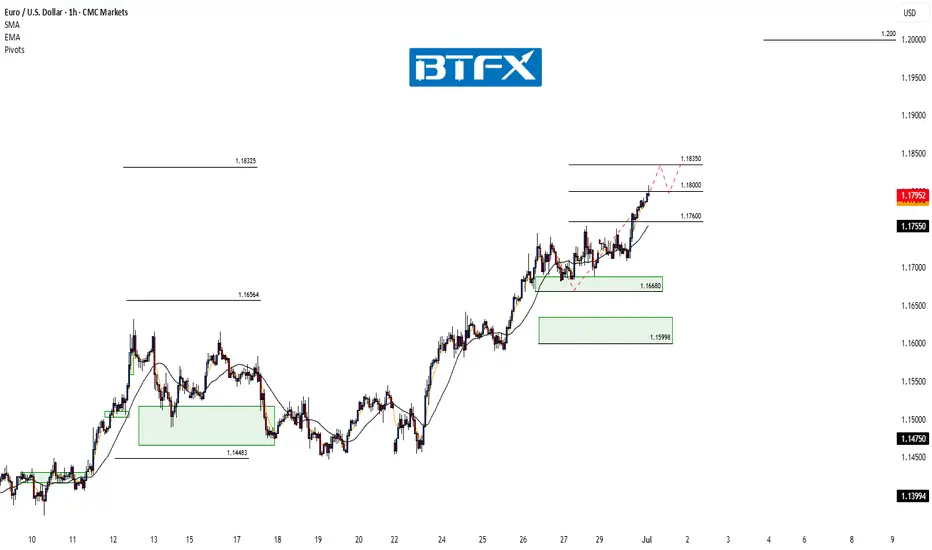
We anticipated a retest of the 1.17400 level coming into this week, setting the stage for further upside toward our highlighted targets at 1.17600 and 1.18000. Monday delivered, with a sharp move higher that saw EUR/USD break cleanly above 1.17400 and extend to 1.17600, bringing the 1.18000 level into focus.
As previously noted, we expect dynamic resistance around the 1.18000 area and will provide further updates on the projected path for EUR/USD should price test or breach this level.
The longer-term outlook remains bullish, with expectations for the rally to extend towards the 1.2000 level, provided the price holds above the key support at 1.10649.
We will continue to update you throughout the week with how we’re managing our active ideas and positions. Thanks again for all the likes/boosts, comments and follows — we appreciate the support!
All the best for a good end to the week. Trade safe.
BluetonaFX
eurusd outlook Eurusd overall bullish HTF, however I do identify alignments within wyckoff distribution. Keeping an eye on the 4hr sponsored candle, ltf fvg at 1.62 area for my next possible bullish swing into the weekly high. Until then let's see if the market can support short term bearish reversal into the area of interest.

SNATCH & RUN: EUR/USD Long Setup (High-Risk Loot Zone)🔥 EUR/USD Heist: Bullish Loot Before the Trap! (Thief Trading Strategy) 🔥
🌟 Hi! Hola! Ola! Bonjour! Hallo! Marhaba! 🌟
Attention, Money Makers & Market Robbers! 🤑💰💸✈️
Based on the 🔥Thief Trading Style🔥, here’s our master plan to loot the EUR/USD "The Fiber" Forex Market! Follow the strategy on the chart—Long Entry is key. We’re targeting the high-risk Red Zone: overbought, consolidating, and primed for a reversal. Beware the trap—bulls must strike fast before bears ambush! 🏆💸
"Take the profit and treat yourself, trader. You deserve this heist!" 💪🎉
🚪 Entry Point (The Vault is Open!)
📈 "Swipe the bullish loot at any price—the heist is LIVE!"
Pro Tip: Use Buy Limit orders within a 15-30 min timeframe (recent swing low/high). ALERTS ARE A MUST!
🛑 Stop Loss (Escape Route)
Thief SL at nearest swing low (1.12500) on the 3H timeframe (Day/Swing trade).
Adjust based on your risk, lot size, and multiple orders.
🎯 Target (Loot & Scoot!)
🎯 1.17200 (or escape earlier if the cops show up!)
⚡ Scalpers’ Quick Grab
👀 Only scalp LONG!
Big wallets? Raid straight in.
Small stacks? Join swing traders for the robbery.
Use Trailing SL to protect your stolen cash! 💰
📢 Why This Heist? (EUR/USD Bullish Momentum)
"The Fiber" is heating up! Key drivers:
Fundamentals (COT Reports, Macro Data)
Sentiment & Intermarket Trends
Future Targets & Score Outlook
🔗 Want the full intel? Check our bio0 for linkks! 👉👉
⚠️ Trading Alert: News = Danger! 📰🚨
News releases = volatility spikes! Protect your loot:
❌ Avoid new trades during news.
🔒 Use Trailing SL to lock profits.
💖 Support the Heist Crew!
💥 Smash the Boost Button! 💥
More boosts = easier money steals!
Strengthen our robbery squad!
Every day is a heist—profit with Thief Trading Style! 🏆🚀
Stay tuned for the next robbery plan! 🤑🐱👤🤩

EURUSD is in a Downside DirectionHello Traders
In This Chart EURUSD HOURLY Forex Forecast By FOREX PLANET
today EURUSD analysis 👆
🟢This Chart includes_ (EURUSD market update)
🟢What is The Next Opportunity on EURUSD Market
🟢how to Enter to the Valid Entry With Assurance Profit
This CHART is For Trader's that Want to Improve Their Technical Analysis Skills and Their Trading By Understanding How To Analyze The Market Using Multiple Timeframes and Understanding The Bigger Picture on the Charts

#EURUSD: +770 Pips Swing Move, DXY to Plumment! EURUSD is extremely bullish and is on track to cross the 1.21 area in our long-term swing plan. Based on recent price action, we have set two targets. As DXY continues to drop, the price is likely to remain bullish in the coming days or weeks. Please use accurate risk management while trading and consider this analysis.
Good luck and trade safely!
-Like
-Comment
-Share
Team Setupsfx_

EURUSDWe are expecting more strength in EURO after small correction towards 1.18 level.
Disclosure: We are part of Trade Nation's Influencer program and receive a monthly fee for using their TradingView charts in our analysis.

#EURUSD:Expecting A Strong Bull Move, Two Entries | Two TargetsIn our previous analysis, we clearly stated that the price would remain bullish as the DXY had to plummet, and it did exactly that, rising by 450 pips from our last entry. Currently, we have two areas from which we can see the price reversing. The first one is nearby and has a higher risk compared to our second entry, which may be safer for some traders. We need a strong confirmation before making any significant decisions.
Good luck and trade safely. We wish you the best in your trading journey.
Team Setupsfx_

EUR/USD Holds Above Support – Watching 1.17400 and BeyondHi Everyone,
As highlighted, a successful bounce from the near-term support at 1.16680 provided a retest of the 1.17400 zone. Looking ahead, we expect price action to revisit this level in the coming week.
A confirmed break above this resistance could open the path toward 1.18000, where we anticipate encountering dynamic resistance.
As outlined in our analysis last week, we anticipated a continued move higher toward the 1.16564 and 1.18325 levels, provided price held above 1.14483.
Price respected this level, and EUR/USD extended its rally, reaching our first key target at 1.16564 and pushing above 1.17400 — marking the highest level since February 2022.
We will provide further updates on the projected path for EUR/USD should price reach this level.
The longer-term outlook remains bullish, with expectations for the rally to extend toward the 1.2000 level, provided the price holds above the key support at 1.10649.
We will continue to update you throughout the week with how we’re managing our active ideas and positions. Thanks again for all the likes/boosts, comments and follows — we appreciate the support!
All the best for a good end to the week. Trade safe.
BluetonaFX

Eurusd bos/making LL swingsAs you can see on the 1 hr tf there's a bos creating a lower low, I think the market made new highs but in the short term i'm expecting the market to balance out fvg before rallying higher. Current bias : bearish short term and bullish long term

EUR/USD Pair Hits Yearly HighEUR/USD Pair Hits Yearly High
Yesterday, the EUR/USD exchange rate rose above the 1.1700 level for the first time this year. The last time one euro was worth more than 1.70 US dollars was in autumn 2019.
The main driver behind the euro’s rise is the weakening dollar, largely due to decisions made by the Trump administration. This week alone, the EUR/USD pair has gained more than 2%, partly as a result of escalating tensions between the US President and the Chair of the Federal Reserve.
According to Reuters, Trump called Powell “terrible” and said he had three or four candidates in mind for the top job at the Fed. It was also reported that Trump had considered selecting and announcing a replacement for Powell by September or October (his current term officially runs until May 2026).
Technical Analysis of the EUR/USD Chart
Price movements are forming an upward channel (highlighted in blue), with the following observations:
→ Midweek, the price consolidated around the channel’s median line (as indicated by arrow 1);
→ It then broke through the 1.6300 level with strong bullish momentum (shown by arrow 2), a level that had acted as resistance earlier in the month;
→ The long upper wicks on the candles forming yesterday’s highs (circled) suggest increased selling pressure near the upper boundary of the channel.
Given this, we could assume that in the short term, the price might form a new consolidation zone around the median line above the 1.6300 level. Significant fundamental catalysts would be required to break the developing upward trend.
This article represents the opinion of the Companies operating under the FXOpen brand only. It is not to be construed as an offer, solicitation, or recommendation with respect to products and services provided by the Companies operating under the FXOpen brand, nor is it to be considered financial advice.

EUR/USD Short Idea Analysis EUR/USD exhibits bearish potential on the daily timeframe, with the 1.17160–1.18070 zone acting as a key resistance area for a short setup.
Technical Analysis:
Price Action: Price is testing the 1.17160–1.18070 resistance zone, which aligns with prior highs and a rejection area. A bearish reversal pattern (e.g., shooting star or engulfing) could confirm the short.
Support/Target: Initial support at 1.1600, with a deeper target at 1.1500 if selling pressure accelerates.
Indicators: RSI is nearing overbought levels (above 65), suggesting a potential reversal. MACD shows weakening bullish momentum, supporting a bearish bias.
Fibonacci: The 1.17160–1.18070 zone aligns with the 78.6% Fibonacci retracement of the prior downmove, reinforcing resistance.
Risks: A break above 1.1820 could invalidate the setup. Watch for ECB policy updates or unexpected US data shifts.
Conclusion: The 1.17160–1.18070 resistance zone offers a compelling short opportunity for EUR/USD, backed by technical and fundamental factors. Use tight risk management due to potential volatility.

EUR/USD Rally Continues – 1.18000 in SightHi Everyone,
As outlined in our analysis last week, we anticipated a continued move higher toward the 1.16564 and 1.18325 levels, provided price held above 1.14483.
Price respected this level, and EUR/USD extended its rally, reaching our first key target at 1.16564 and pushing above 1.17400 — marking the highest level since February 2022.
A successful bounce from above 1.16680 or slightly lower at 1.15998 would offer near-term support for a potential retest of the 1.17400 zone. A confirmed break above this resistance could pave the way for a move toward 1.18000, where we anticipate encountering dynamic resistance.
We will provide further updates on the projected path for EUR/USD should price reach this level.
The longer-term outlook remains bullish, with expectations for the rally to extend toward the 1.2000 level, provided the price holds above the key support at 1.10649.
We will continue to update you throughout the week with how we’re managing our active ideas and positions. Thanks again for all the likes/boosts, comments and follows — we appreciate the support!
All the best for a good end to the week. Trade safe.
BluetonaFX

BSL (Buy-side Liquidity):Symbol: EUR/USD
Timeframe: 1 hour
Price Range Displayed: ~1.15300 to ~1.17500
Current Price: 1.16935
🔍
Key Chart Markings
BSL (Buy-side Liquidity):
Marked at the top in the yellow zone (~1.17250–1.17500).
Indicates where buy-side liquidity was likely taken—suggesting liquidity grab or stop hunt.
SSL (Sell-side Liquidity):
Marked at the bottom yellow zone (~1.15700–1.15900).
Indicates a potential drawdown area—price may seek this liquidity next.
Price Action:
The price recently made a higher high into the BSL zone, followed by a bearish rejection.
A projected path is shown: short-term retracement upward, followed by a larger move downward toward the SSL zone.
📉
Potential Outlook (Bearish Bias)
The chart suggests a bearish move is anticipated:
BSL has been swept, signaling a reversal point.
Target: Sell-side liquidity around 1.15800, possibly lower.
⚙️
Technical Implication
This setup follows Smart Money Concepts (SMC) or Liquidity Engineering:
Liquidity is taken from one side of the market (BSL), and price is expected to move to the other (SSL).
Possible setup for a short trade after confirmation of the retracement.

eurusd updateentry price 1.1329
stop loss update 1.133
take profit
1.153
1.165
1.177
1.194
result we hit first two target

Smart Money Concepts (SMC) principles.Smart Money Concepts (SMC) principles. Here’s a full breakdown of the chart and its annotations:
📊
Chart Details:
Pair: EUR/USD
Timeframe: 4-hour (H4)
Current Price: Around 1.16093 USD
🔍
Key Annotations & Zones:
🟫
Pink Zone (Supply/Resistance Area):
This area includes:
Accumulation
FVG (Fair Value Gap)
Price has recently entered and reacted from this zone.
🔼
Buy Side Liquidity:
Highlighted at the top of the range.
Price swept above recent highs to trigger buy stops (liquidity grab), possibly setting up for a reversal.
🔽
Sell Side Liquidity:
Marked below the previous consolidation range.
Price had previously dipped to collect sell-side liquidity before moving upward.
📈
Accumulation:
This phase occurred before the bullish breakout.
Suggests institutional buying or smart money positioning.
📉
FVG (Fair Value Gap):
Imbalance between buying and selling, typically gets filled.
Marked in the pink zone where price may return before continuing its move.
📌
Price Structure Analysis:
The chart shows a classic liquidity sweep setup:
Price grabs buy-side liquidity.
Enters a supply zone.
May return to fill the FVG.
Potential reversal or bearish reaction from this zone.
✅
Trading Implications:
Bearish Scenario:
Price may reject from the pink supply zone after the buy-side liquidity sweep, filling the FVG and possibly heading toward previous lows.
Bullish Scenario (less likely immediately):
If price holds above the pink zone, it could continue trending upward.
