Q4 | W49 | D1 | Y25 - EURUSD FRGNT DAILY FORECAST POST BREAKDOWN📅 Q4 | W49 | D1 | Y25 |
📊 EURUSD FRGNT DAILY FORECAST
🔍 Analysis Approach:
I’m applying Smart Money Concepts, focusing on:
Identifying Points of Interest on the Higher Time Frames (HTFs) 🕰️
Using those POIs to define a clear trading range 📐
Refining those zones on Lower Time Frames (LTFs) 🔎
Waiting for a Break of Structure (BoS) for confirmation ✅
This method allows me to stay precise, disciplined, and aligned with the market narrative, rather than chasing price.
💡 My Motto:
"Capital management, discipline, and consistency in your trading edge."
A positive risk-to-reward ratio, paired with a high win rate, is the backbone of any solid trading plan 📈🔐
⚠️ Losses?
They’re part of the mathematical game of trading 🎲
They don’t define you — they’re necessary, they happen, and we move forward 📊➡️
🙏 I appreciate you taking the time to review my Daily Forecast.
Stay sharp, stay consistent, and protect your capital
— FRNGT 🚀
FX:EURUSD
Eurusdprediction

EURUSD TIME TO FLY TO MOON , H1 Totally Bullish Structure, Eurusd H1
Bullish Setup
CISD✅
FVG✅
BOS✅
SMT✅
BUY SETUP LETSS GOO
Lets Goo Bullish Setup With 80% Confirmation

EUR/USD Price Outlook – Trade Setup (EUR/USD)📊 Technical Structure
TICKMILL:EURUSD EUR/USD extended its climb toward 1.1615, but the pair remains capped below the 1.1620–1.1627 Resistance Zone, where repeated rejections and slowing bullish momentum indicate exhaustion. Price is now rotating lower, staying beneath the resistance ceiling while holding just above short-term micro-support.
A bearish retracement scenario is favoured while EUR/USD stays below 1.1620–1.1627 with price expected to drift back toward the 1.1595–1.1590 Support Zone. The descending reaction illustrated on the chart supports a short-term pullback before any potential upside continuation can emerge.
A 30M close above 1.1632 invalidates the bearish view and opens the door toward 1.1650+.
🎯 Trade Setup
Idea: Sell from resistance rejection targeting support.
Entry: 1.1620 – 1.1627
Stop Loss: 1.1632 (above resistance zone)
Take Profit 1: 1.1595
Take Profit 2: 1.1590
Risk–Reward Ratio: ≈ 1 : 2.46
The bearish setup holds as long as price remains capped beneath 1.1620–1.1627.
🌐 Macro Background
FXStreet reports that EUR/USD strengthened above 1.1600 as the US Dollar weakened following another month of contraction in US manufacturing. The ISM Manufacturing PMI printed 48.2, marking the ninth consecutive month below 50 and reinforcing expectations that the Federal Reserve will cut rates in December. Markets now price an 87% chance of a rate cut, up from 71% last week, according to CME FedWatch.
At the same time, the Euro benefits from the growing belief that the ECB has completed its cutting cycle, with President Lagarde stating rates are at the “right level.” However, the upcoming Eurozone HICP release carries risk: softer-than-expected inflation could weigh on the Euro and increase downside pressure on EUR/USD — aligning with the short-term pullback shown on the chart.
🔑 Key Technical Levels
Resistance Zone: 1.1620 – 1.1627
Support Zone: 1.1595 – 1.1590
Invalidation Level: 1.1632 (30M close above)
📌 Trade Summary
EUR/USD faces rejection at the 1.1620–1.1627 resistance zone and is showing early weakness, supported by bearish expectations ahead of Eurozone HICP. While Fed rate-cut expectations pressure the USD, near-term EUR strength appears overstretched. A retracement toward 1.1595–1.1590 remains the higher-probability path unless price breaks above 1.1632.
⚠️ Disclaimer
This analysis is for reference only and does not constitute trading advice. Trading involves significant risk, and proper risk management is essential.

EURUSD – Fibonacci Analysis (SELL Bias) Take Profit 1.15793Institutional Technical Breakdown | All Sessions
EUR/USD has generated a SELL signal based on the Fibonacci Retracement model, with price now reacting from a key Fib retracement zone that aligns with intraday resistance. Combined with weakening momentum and bearish divergence, the pair is showing strong signs of downward continuation.
This setup remains entirely technical, with no high-impact fundamental events distorting price action.
📌 Signal Summary
Bias: SELL
Model: Fibonacci Retracement
Sessions: All Sessions
Risk/Reward: ~1:2.5
Market Environment: High liquidity, stable volatility
The algorithm identifies that EUR/USD has retraced into a strong Fib resistance cluster, setting up a clean reversal opportunity.
📊 Technical Outlook
1. Fibonacci Confluence Zone
Price is currently reacting from the Fib retracement zone that aligns with:
38.2% to 50% retracement of the recent swing
Intraday resistance around 1.16125 – 1.16155
This creates a layered confluence zone, a common institutional sell area where liquidity is engineered before reversal.
2. Momentum & Divergence
MACD & momentum indicators show bearish divergence, meaning price is making higher highs while momentum fails to follow.
This suggests bullish exhaustion and increases the probability of a reversal from the Fib zone.
3. Price Action Behavior
Wicks forming at the top of the fib band show rejection of higher prices.
Price has failed multiple attempts to break above 1.16155, forming a clear supply zone.
The structure remains in a lower-high formation, fitting well with a Fibonacci-based trend continuation.
4. Market Context
Liquidity remains high across all sessions (Asia, London, NY).
No major events for EUR or USD in the immediate horizon — clean technical environment.
USD maintains a mildly strong macro tone.
📌 Key Technical Levels
Level Type Price
Immediate Resistance 1.16125
Immediate Support 1.16065
Major Resistance 1.16155
Major Support 1.16035
The 1.16125–1.16155 zone aligns with Fibonacci resistance and acts as your sell area.
🎯 Trade Parameters (from the model)
Entry Price: 1.16095
Stop Loss: 1.16246
Take Profit: 1.15793
The SL is positioned above major resistance & Fibonacci cluster, ensuring structural protection.
The TP targets the next liquidity shelf near the 1.15800 handle, a common continuation zone.
🧠 Trade Rationale
Price reacting from a major Fibonacci retracement zone.
Breakdown expected toward the 1.16035 → 1.15800 liquidity pocket.
Confluence of bearish divergence, supply rejection, and lower-high structure.
EUR showing cross-pair weakness; USD maintaining strength intraday.
This creates a high-probability Fibonacci reversal-to-continuation setup.
📉 Risk Management Guidance
Risk 1–2% max per position.
Monitor volatility spikes near intraday session openings.
Enable trailing stop once price breaks below 1.16035.
If a candle closes above 1.16246, bearish bias is invalid.
📌 Analyst Conclusion
EUR/USD is positioned for a technical reversal from the Fibonacci resistance cluster, supported by divergence, price-action rejection, and broader USD strength. As long as the pair holds beneath 1.16125–1.16155, the bearish continuation toward 1.15793 remains the most probable path.

EURUSD FRGNT WEEKLY FORECAST - Q4 | W49 | Y25 |📅 Q4 | W49 | Y25 |
📊 EURUSD FRGNT WEEKLY FORECAST
🔍 Analysis Approach:
I’m applying Smart Money Concepts, focusing on:
Identifying Points of Interest on the Higher Time Frames (HTFs) 🕰️
Using those POIs to define a clear trading range 📐
Refining those zones on Lower Time Frames (LTFs) 🔎
Waiting for a Break of Structure (BoS) for confirmation ✅
This method allows me to stay precise, disciplined, and aligned with the market narrative, rather than chasing price.
💡 My Motto:
"Capital management, discipline, and consistency in your trading edge."
A positive risk-to-reward ratio, paired with a high win rate, is the backbone of any solid trading plan 📈🔐
⚠️ Losses?
They’re part of the mathematical game of trading 🎲
They don’t define you — they’re necessary, they happen, and we move forward 📊➡️
🙏 I appreciate you taking the time to review my Daily Forecast.
Stay sharp, stay consistent, and protect your capital
— FRNGT 🚀
FX:EURUSD

Core driving logicMonetary policy: US easing, EU stability pattern clear
The probability of the Fed cutting interest rates in December remains around 30%, but the expectation of a rate cut in 2026 has not changed. The cooling of the labor market and economic uncertainty have left room for easing. The ECB has maintained the 2% interest rate for four consecutive times. The year-on-year CPI in the Eurozone in October was 2.1%, approaching the target. Lagarde emphasized that the policy is at an appropriate level, and the probability of a rate cut before mid-2026 is extremely low. Currently, the 10-year US and Eurozone government bond yields have a spread of 135.4 basis points. Although it provides short-term support for the US dollar, the trend of the spread narrowing is clear, laying the foundation for the long-term upward movement of the euro.
EUR/USD Today's Trading Strategy
buy:1.16000-1.16100
tp:1.16500-1.16700
sl:1.15700

EURUSD D11. Market Structure
Break of the Downtrend
The chart shows a descending channel that price has recently broken upward.
A breakout from a multi-week channel usually signals bearish exhaustion and potential trend reversal.
Higher-Timeframe Support
Price reacted strongly from the 1.1500–1.1560 demand zone (highlighted in blue).
The bounce aligns with a 0.786 retracement, which often marks deeper liquidity grabs before a reversal.
📌 2. Key Levels on Chart
Support
1.15062 — strong higher-timeframe support.
1.15691 — mid-range support (blue dashed line).
Resistance
1.16525 — price is currently testing this level.
1.17284 — next major resistance.
1.19140 — ultimate upside target drawn on your chart.
📌 3. Candlestick & Momentum Notes
Multiple bullish candles after a clear sweep below the demand zone.
Strong impulsive candle breaking above the descending trendline:
→ suggests shift in momentum from bearish to bullish.
Current daily candle shows bullish continuation attempting to close above 1.16525.
📌 4. Expected Scenario (Based on Your Drawing & Structure)
Bullish Path (Primary Bias)
If price closes above 1.16525, next milestones:
1.17284
Minor resistance; likely initial reaction area.
1.19140
Major upside target — aligns with the vertical arrow on your chart.
This would represent a full bullish reversal from the previous downtrend.
Bearish While Correction
If price rejects 1.16525:
Expect a pullback back toward 1.1569 or even deeper toward the blue demand zone.
As long as price holds above 1.1506, the bullish structure remains intact.

DXY,EURUSD and GBPUSD Analysis todayHello traders, this is a complete multiple timeframe analysis of this pair. We see could find significant trading opportunities as per analysis upon price action confirmation we may take this trade. Smash the like button if you find value in this analysis and drop a comment if you have any questions or let me know which pair to cover in my next analysis.

EUR/USD – SMC Based Short Idea.🔸 Monday — Weekly Outlook
Post Type: Macro bias + liquidity map
Content Includes:
Higher timeframe imbalance zones
Premium/discount map
BSL/SSL liquidity draws
Purpose → Positions your page as a market guide.
Liquidity Grab → Premium Sell Zone → Distribution → Downside Targets**
Price has been engineering liquidity on the upside for multiple sessions, forming Equal Highs + Clustered Buy-Side Liquidity (SSS). The recent Displacement & CHoCH confirms weakness from premium levels, and the market appears ready to deliver back into discounted zones.
Currently price is tapping into an Entry Zone inside a premium imbalance + Mitigation area, where smart money often reverses to sweep the lows.
Sell Narrative
💠 Liquidity engineered above previous swing
💠 CHoCH + BOS confirming distribution
💠 Multiple SSS layers above price = inducement
💠 Premium priced mitigation block hit → Short idea activated
💠 Corrective pullback seeks inefficiencies below
Targets liquidity areas
Take-Profit Level Price Zone
🎯 Initial Target 1.15765
🎯 Target 2 1.15625
🏁 Final Target 1.15471
Stops remain above liquidity + mitigation to avoid manipulation wicks.
This setup uses the Core Smart Money framework → Liquidity sweep → Premium short → Discounted targets.
Note
This is not financial advice — purely market structure observation and idea execution logic using SMC/ICT concepts.
If you understand liquidity & imbalance, you stop chasing price —
You let price come to you.

EURUSD – Trendline Breakout Momentum ViewThe market has been respecting this broadening trendline structure for a long time.
Every touch on the upper and lower trendline created clear reactions, showing that the market is strongly respecting this geometry.
Now price is attempting to break above the upper trendline, and this is where things get interesting.
Instead of forcing a directional bias early, I’m simply following my breakout approach:
✨ My Perspective
If EURUSD pushes above this trendline with strength, I expect a continuation toward the next Fib extension zones.
These zones usually act like natural magnet levels once a major trendline is taken out.
Based on the Fib projections:
🎯 Expectation Zone 1: 1.16400
🎯 Expectation Zone 2: 1.16800
These levels are not random — they align perfectly with the extension structure drawn on the chart.
Once the breakout is confirmed, the market often moves quickly toward these extension ranges because there are fewer obstacles on the path.
🔥 Why This Breakout Matters
- Price has created higher lows, showing buyer interest building up.
- Volume is gradually improving at the top of the pattern.
This combination usually leads to an expansion move.
📘 Disclaimer
This is only my personal viewing style, not financial advice.

EURUSD Temporary sellEURUSD Temporary sell to the BUY entry. Let's take sell to the FVG then we will continue with BUY entry afrer confirmation.

EURUSD : Mid-Term Bullish ScenarioEURUSD is developing a progressive bullish structure on the 4-hour timeframe, with price action continuing to build momentum after completing its recent corrective phase. The current outlook highlights a potential continuation pattern that may guide the pair toward the next upside zone as long as momentum remains intact through early December.
Disclosure: We are part of Trade Nation's Influencer program and receive a monthly fee for using their TradingView charts in our analysis.

EURUSD is in a Downside DirectionHello Traders
In This Chart EURUSD HOURLY Forex Forecast By FOREX PLANET
today EURUSD analysis 👆
🟢This Chart includes_ (EURUSD market update)
🟢What is The Next Opportunity on EURUSD Market
🟢how to Enter to the Valid Entry With Assurance Profit
This CHART is For Trader's that Want to Improve Their Technical Analysis Skills and Their Trading By Understanding How To Analyze The Market Using Multiple Timeframes and Understanding The Bigger Picture on the Charts

Elise | EURUSD 4H — Trend Reversal Breakout SetupFX:EURUSD
EURUSD has transitioned from a bearish channel into bullish strength after rejecting demand twice and invalidating the previous lower high. The break and retest of structure indicate a potential continuation toward higher liquidity levels, especially above previous consolidation highs.
Key Scenarios
🚀 Bullish Case (Primary Bias)
If price holds the 1.1550–1.1580 demand zone, expect continuation toward:
🎯 Target 1: 1.1680 (first demand reaction zone)
🎯 Target 2: 1.1785–1.1850 liquidity range
A sweep of previous equal highs is expected on the path to the second target.
📉 Bearish Case (Invalidation)
A clean break and close below 1.1480 would weaken bullish structure and may return price back into the previous accumulation zone.
Current Levels to Watch
Entry Buy Zone: 1.1550–1.1580
Bullish Confirmation: Break above 1.1680
Invalidation: Below 1.1480
⚠️ Disclaimer: This analysis is for educational purposes only. Not financial advice.

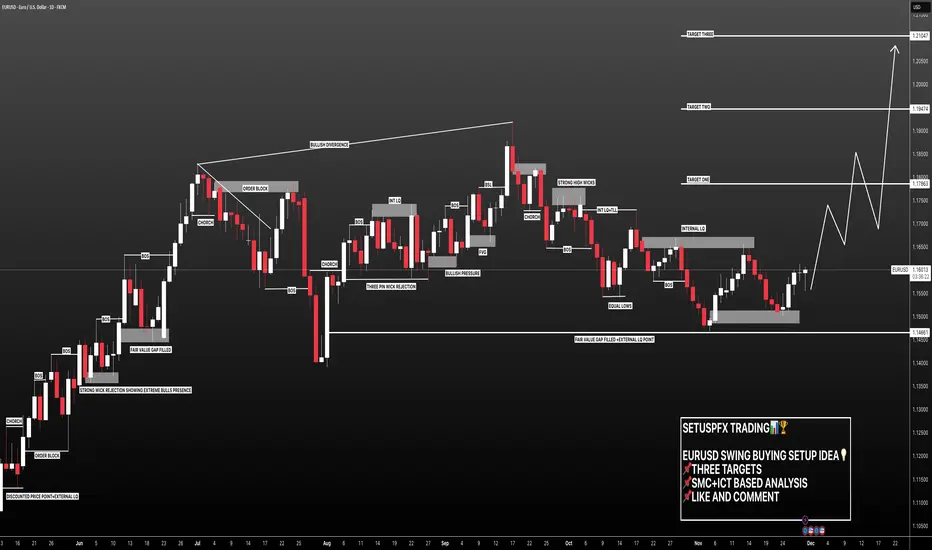
EURUSD: Reversal Almost Confirmed +1500 Pips In Making! FX:EURUSD
As outlined in our previous analysis, the price fell further than anticipated. Given this region, we believe the price has reversed from a crucial level. Consequently, we anticipate a significant price increase. A swing bullish move is possible, potentially gaining around +1500 pips if successful. Please like and comment if you enjoy our work.
Good luck and trade safely!
Team Setupsfx_
EURUSD SELLEUR/USD broke below key support at 1.1550 and the 50/200-day moving averages. This technical breakdown, with bearish candles and rising volume, signals strong downside momentum targeting the next major support near 1.14000

Short opportunity on EURUSD 4H Time Frame According to Breakout uptrend line
Pattern into a corrective wave
CCI

EURUSD moving higherEURUSD is holding above 1,1580 and is heading toward a retest of the previous high.
We’re watching for the formation of a higher low, which could provide a potential buying opportunity.
The target remains a test and possible break of the prior high.
Monitor the daily close and look for confirmation of a continued move to the upside.

EURUSD BUYI expect EURUSD Short term buy. This can be seen after a price hit Low fair value gap and bullish order block so as reverse to a bearish order block for continuing sell.

EURUSD: Bullish Push to 1.167?FX:EURUSD is eyeing a bullish breakout on the 4-hour chart , with price rebounding from a key support zone near recent lows, converging with cumulative sell liquidation and a potential entry area that could spark upside momentum if buyers hold against short-term pullbacks. This setup hints at a reversal opportunity after the recent downtrend, targeting higher resistance levels with strong risk-reward.
Entry between 1.1490–1.1500 for a long position (aggressive entry right here with proper risk management is recommended). Targets at 1.1590 (first), 1.1670 (second). Set stop loss on a close below 1.14685 , delivering a clean risk-reward ratio of ~1:4+ (full run). Watch for bullish confirmation on lower timeframe breakout or strong green candle with volume surge.⚡
Fundamentally , peace talks between Russia and Ukraine are gaining traction in November 2025, with US officials (including Army Secretary Dan Driscoll) engaging in secret negotiations in Abu Dhabi under a proposed Trump-backed plan, where Ukraine has agreed in principle but minor details remain, though Russia shows reluctance and may reject revisions. This could positively impact the euro's upward trend by reducing geopolitical risks, stabilizing European energy markets, and boosting investor confidence in the region's economy.
📝 Trade Setup
🎯 Entry (Long):
1.1490 – 1.1500
(Aggressive entry at current levels is acceptable with strict risk management.)
🎯 Targets:
• TP1: 1.1590
• TP2: 1.1670
❌ Stop Loss:
• Close below 1.14685
⚖️ Risk-to-Reward:
• ~1:4+ full target
👇 Share your thoughts below! 👇

EUR/USD Bounces From Support – Bulls Showing StrengthOn the EUR/USD 10-minute chart, price has reacted cleanly from the 1.1579 support zone, forming a bullish bounce after a sharp decline. If buyers maintain momentum, the pair could push back toward the recent highs around 1.1605–1.1615. This support level has held multiple times, making it a key zone to watch. A sustained move above current structure may confirm further upside, while a break below 1.1579 would invalidate the bullish scenario. Patience and confirmation remain essential.

EUR_USDSell EUR to USD at the Dream Center with specific stops and targets. Pay attention to entries and volumes.

EURUSD FRGNT Daily Forecast - Q4 | W48| D27 | Y25 |📅 Q4 | W48| D27 | Y25 |
📊 EURUSD FRGNT Daily Forecast
🔍 Analysis Approach:
I’m applying Smart Money Concepts, focusing on:
Identifying Points of Interest on the Higher Time Frames (HTFs) 🕰️
Using those POIs to define a clear trading range 📐
Refining those zones on Lower Time Frames (LTFs) 🔎
Waiting for a Break of Structure (BoS) for confirmation ✅
This method allows me to stay precise, disciplined, and aligned with the market narrative, rather than chasing price.
💡 My Motto:
"Capital management, discipline, and consistency in your trading edge."
A positive risk-to-reward ratio, paired with a high win rate, is the backbone of any solid trading plan 📈🔐
⚠️ Losses?
They’re part of the mathematical game of trading 🎲
They don’t define you — they’re necessary, they happen, and we move forward 📊➡️
🙏 I appreciate you taking the time to review my Daily Forecast.
Stay sharp, stay consistent, and protect your capital
— FRNGT 🚀
FX:EURUSD
