EURUSD pullbackYesterday, EURUSD failed to extend its rally and tested levels below 1,1700.
The correction may deepen ahead of tomorrow’s news, which will likely set the stage for the next strong move.
If you don’t have any open positions, it’s better to wait and avoid rushing into entries at the current levels.
Eurusdtrade

EURUSD – Market Outlook
🔼 Bullish Scenario:
• If price holds above 1.1735, the bullish momentum will continue.
• Next target: 1.1810 (bullish zone objective).
🔽 Bearish Scenario:
• If price falls and stabilizes below 1.1735, the trend will shift bearish.
• First target: 1.1710 (support level).
• If 1.1710 breaks and the price closes below it, then the bearish trend will extend further (full downside continuation).
📊 EURUSD – Trading Signal
🔔 Entry:
• Above 1.1735
🎯 Target (TP):
• 1.1810
🛡️ Stop Loss (SL):
• Below 1.1710
📌 Note: If the price stays above 1.1735, you can consider a Buy position aiming for 1.1810.

EURUSD remains rising 🎯 Euro Hunt (EUR/USD)
The Euro is currently trading above the breakout level.
As long as the price holds above 1.1735, 🎯 the direction remains bullish, targeting the upside zone.
⚠️ However, if the price fails to hold and drops back below 1.1735, the bearish hunt begins, aiming for the 1.1710 support. A break of this level will completely shift the outlook into a bearish hunt, with targets extending into the lower zone.
📌 EUR/USD – Hunting Trade Plan
🔼 Bullish Scenario:
• Entry: Above 1.1735
• Target (TP): 1.1760 → 1.1785
🔽 Bearish Scenario:
• Entry: Below 1.1735
• Target (TP): 1.1710 → 1.1685

EURUSD Daily Forecast Q3 | W37 | D9 | Y25📊 EURUSD Daily Forecast Q3 | W37 | D9 | Y25
🔍 Analysis Approach:
I’m applying Smart Money Concepts, focusing on:
Identifying Points of Interest on the Higher Time Frames (HTFs) 🕰️
Using those POIs to define a clear trading range 📐
Refining those zones on Lower Time Frames (LTFs) 🔎
Waiting for a Break of Structure (BoS) for confirmation ✅
This method allows me to stay precise, disciplined, and aligned with the market narrative, rather than chasing price.
💡 My Motto:
"Capital management, discipline, and consistency in your trading edge."
A positive risk-to-reward ratio, paired with a high win rate, is the backbone of any solid trading plan 📈🔐
⚠️ Losses?
They’re part of the mathematical game of trading 🎲
They don’t define you — they’re necessary, they happen, and we move forward 📊➡️
🙏 I appreciate you taking the time to review my Daily Forecast.
Stay sharp, stay consistent, and protect your capital
— FRNGT 🚀
OANDA:EURUSD

EUR/USD Poll: 1.2000 here we come?EUR/USD: 1.2000 Bank Target?
I am usually not a trend-trader (I prefer Mean Reversion), but this looks like a bullish setup to me: Breakout attempt + inverse head and shoulder.
Almost all banks have 1.2000 as a year-end-target for the Euro.
Fundamental reasons:
1. USD weakness due to weakening Jobs-Date
2. Increasing odds of a FED rate cutting cycle
3. USD-Outflows due to lost confidence in US-government
4. EUR Inflows due to fiscal measures in Germany
What do you guys think? 1.2000 just a matter of time?
Let me know in the comments!

EURUSD Daily Forecast – Q3 | W37 | D8 | Y25EURUSD Daily Forecast – Q3 | W37 | D8 | Y25 📊
🔹 Market Context
For the past 8 weeks, EURUSD has been held in a weekly range. This can give us clean trading opportunities, but caution is required — I’ll be waiting for a 15M break of structure before committing to either longs or shorts.
🔹 Bullish Bias (Higher Probability)
Weekly (W36) candle closed bullish above the weekly 50 EMA, with a strong wick rejection from the lows.
The previous daily candle also closed bullish above the daily 50 EMA, keeping my bias in favor of long opportunities.
🔹 Bearish Scenario (Range Top Reversal)
Shorts remain possible, but only with confluence.
If price retests previous weekly highs (wick fills → top of the range), I’ll look for:
A 1H / 4H bearish close from that area
Imbalance fill confirming rejection
A 15M break of structure for precise short entries
Target would be previous daily imbalance and down towards the daily 50 EMA, where I expect a reaction/hold.
Summary:
📈 Longs remain the higher-probability setup.
📉 Shorts valid at range highs only with confirmation.
Patience is key — wait for structure breaks before committing.
🔍 Analysis Approach:
I’m applying Smart Money Concepts, focusing on:
Identifying Points of Interest on the Higher Time Frames (HTFs) 🕰️
Using those POIs to define a clear trading range 📐
Refining those zones on Lower Time Frames (LTFs) 🔎
Waiting for a Break of Structure (BoS) for confirmation ✅
This method allows me to stay precise, disciplined, and aligned with the market narrative, rather than chasing price.
💡 My Motto:
"Capital management, discipline, and consistency in your trading edge."
A positive risk-to-reward ratio, paired with a high win rate, is the backbone of any solid trading plan 📈🔐
⚠️ Losses?
They’re part of the mathematical game of trading 🎲
They don’t define you — they’re necessary, they happen, and we move forward 📊➡️
🙏 I appreciate you taking the time to review my Daily Forecast.
Stay sharp, stay consistent, and protect your capital
FRGNT 🚀
OANDA:EURUSD

The Maze Series | EURUSD Trapped in the Illusion of BreakoutsHello Traders,
"The market often behaves like a maze — it gives us paths that look like exits, but they only lead to dead-ends. On this chart, EURUSD is moving inside an upward channel, creating the illusion of strength. Each time price touched the upper boundary, it tempted traders with the hope of a breakout. Yet, what followed was rejection and reversal* a classic fake breakout, a wall inside the maze.
📌 What we can observe:
Repeated fake breakouts above the channel, drawing in breakout traders but leaving them trapped.
Liquidity zones below, highlighted by clusters of stop orders that act as the true magnet of price.
The IDM point, where the final push upward appeared convincing but was, in reality, the last misdirection before the maze’s true path downward.
This structure teaches an important lesson: markets don’t move in straight lines, they move through puzzles. The real breakout often happens after enough false exits have consumed liquidity and punished impatience. Until that moment, every candle can just be another wall keeping traders inside.
💡 Insight: Patience is the key to escaping the maze. Understanding where liquidity rests gives us a clearer map than simply following the first door that opens.
👉 Do you think EURUSD will complete the maze by tapping deeper liquidity before any sustainable move begins? Share your view is the next true exit below 🔻 or above 🔺?"

EURUSD: Bullish -Neutral For Weeks! Time For A Breakout?Welcome back to the Weekly Forex Forecast for the week of Sept 8 - 12th.
In this video, we will analyze the following FX market: EURUSD
The EURUSD has been bullish-neutral for the summer. Friday finally saw a sweep of the consolidation high with bad NFP numbers announced. Notably, the weekly candle closed back within the range of the previous weekly candle, hinting weakness for the upcoming week. And the swing high still remains protected.
We'll see if they hold for the week, sending prices lower.
Enjoy!
May profits be upon you.
Leave any questions or comments in the comment section.
I appreciate any feedback from my viewers!
Like and/or subscribe if you want more accurate analysis.
Thank you so much!
Disclaimer:
I do not provide personal investment advice and I am not a qualified licensed investment advisor.
All information found here, including any ideas, opinions, views, predictions, forecasts, commentaries, suggestions, expressed or implied herein, are for informational, entertainment or educational purposes only and should not be construed as personal investment advice. While the information provided is believed to be accurate, it may include errors or inaccuracies.
I will not and cannot be held liable for any actions you take as a result of anything you read here.
Conduct your own due diligence, or consult a licensed financial advisor or broker before making any and all investment decisions. Any investments, trades, speculations, or decisions made on the basis of any information found on this channel, expressed or implied herein, are committed at your own risk, financial or otherwise.

EURUSDEURUSD along with rest of the majors should give us correction or impulse down.
Disclosure: We are part of Trade Nation's Influencer program and receive a monthly fee for using their TradingView charts in our analysis.

UPDATE - EUR/USD Holding Support, Upside Still on the CardsHi Everyone,
A quick update on the idea shared earlier this week — we’re still looking for the Fiber to attempt a move toward the 1.17889 resistance. Yesterday’s dip found support between the 1.15880–1.16180 zone, which could provide the base for another push toward the upside target.
That said, a deeper retracement toward the 1.15200 zone may still be required to attract fresh buying interest and cannot be ruled out.
The impulsive rally from the 1st August low continues to reinforce our bullish outlook on EUR/USD.
Our broader view remains unchanged: we expect the pair to continue building momentum for another leg to the upside. A decisive break above 1.17889 would open the path toward the 1.18350–1.19290 zone, and ultimately the 1.20000 handle.
We’ll be monitoring price action closely to see whether this recovery gains traction and if buyers can sustain momentum through resistance. The longer-term outlook remains bullish, provided price continues to hold above the key support levels.
We’ll keep updating you throughout the week as the structure develops and share how we’re managing our active positions.
Thanks again for all the likes, boosts, comments, and follows — your support is truly appreciated!
All the best for the rest of the week.
Trade safe.
BluetonaFX

Market Analysis: EUR/USD Trims GainsMarket Analysis: EUR/USD Trims Gains
EUR/USD started a downside correction from 1.1740.
Important Takeaways for EUR/USD Analysis Today
- The Euro struggled to clear 1.1740 and corrected gains against the US Dollar.
- There was a break below a key bullish trend line with support at 1.1705 on the hourly chart of EUR/USD.
EUR/USD Technical Analysis
On the hourly chart of EUR/USD, the pair gained pace for a move above 1.1650. The Euro tested 1.1735 and recently corrected gains against the US Dollar.
The pair dipped below 1.1700 and a key bullish trend line with support at 1.1705. It sparked a move below the 50% Fib retracement level of the upward move from the 1.1574 swing low to the 1.1736 high.
The pair shows some bearish signs below the 50-hour simple moving average, and gains might remain capped since the RSI is now below 50. Immediate resistance on the upside is near 1.1655. The next key hurdle for the bulls could be near the 50-hour simple moving average at 1.1675.
An upside break above 1.1675 might send the pair toward 1.1705. Any more gains might open the doors for a move toward 1.1740.
On the downside, immediate support on the EUR/USD chart is seen near the 76.4% Fib retracement at 1.1610. The next major area of interest is 1.1575. A downside break below 1.1575 could send the pair toward the 1.1500 handle.
This article represents the opinion of the Companies operating under the FXOpen brand only. It is not to be construed as an offer, solicitation, or recommendation with respect to products and services provided by the Companies operating under the FXOpen brand, nor is it to be considered financial advice.

EURUSD and GBPUSD Analysis todayHello traders, this is a complete multiple timeframe analysis of this pair. We see could find significant trading opportunities as per analysis upon price action confirmation we may take this trade. Smash the like button if you find value in this analysis and drop a comment if you have any questions or let me know which pair to cover in my next analysis.

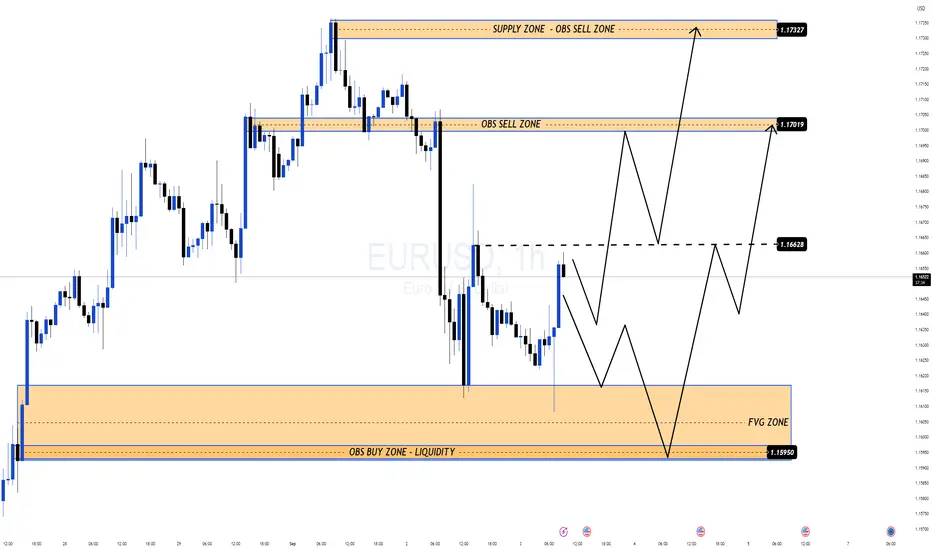
EURUSD – Liquidity Trap or Big BUY Opportunity?EURUSD is consolidating after a sharp drop, currently balancing between the upper Supply Zone and the Liquidity + FVG Zone below. This area is critical to determine the next major move.
📊 MMFLOW VIEW
Buyers are trying to recover, but price is facing strong resistance at OBS Sell Zone 1.1701 – 1.1732.
If price gets rejected, we expect a pullback into OBS Buy Zone & FVG 1.1595 to grab liquidity before a potential rally.
A clean breakout above 1.1732 could trigger a stronger bullish leg.
🔑 Key Levels
Supply Zone – OBS SELL Zone: 1.1701 – 1.1732
Liquidity Buy Zone – FVG: 1.1595
Pivot Level: 1.1662 (balance point between buyers & sellers)
🎯 Trading Plan
✅ SELL Scenario (short-term, high risk)
Entry: 1.1700 – 1.1730
SL: 1.1745
TP: 1.1660 – 1.1620 – 1.1600 – 1.1595
✅ BUY Scenario (main setup, high probability)
Entry: 1.1595 – 1.1600 (OBS Buy Zone – Liquidity)
SL: 1.1575
TP: 1.1660 – 1.1700 – 1.1730 – ???
⚠️ Important Notes
Market is prone to false breaks & liquidity traps.
Prioritize BUY setups at liquidity zones – SELL only with confirmed volume rejection.
Always manage risk properly, avoid FOMO at supply levels.
🔥 This is the MMFLOW TRADING Plan – follow for updates and don’t miss the next EURUSD move!
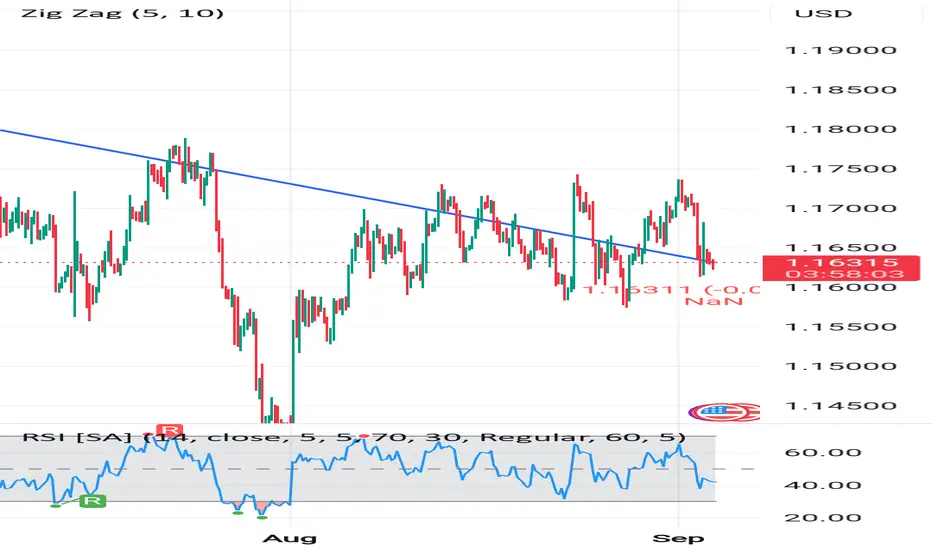
4H Chart | Price Action, Trendline & RSI Signals📉 Pair: EUR/USD
⏱ Timeframe: 4 Hours
💹 Current Price: 1.16312
Technical Overview
The EUR/USD pair is currently trading near 1.16312, showing bearish pressure after failing to hold above the 1.1650 zone. The price has been respecting a downward trendline, which has acted as dynamic resistance on multiple occasions.
A recent Zig Zag indicator setup highlights the swing highs and lows, confirming the presence of a descending pattern. Until the price breaks and sustains above this trendline, the bearish outlook remains intact.
Key Levels
Resistance: 1.1700 – 1.1750
Support: 1.1600 – 1.1520
RSI Indicator (14)
The RSI is currently hovering around the 40–45 range, suggesting mild bearish momentum but not yet oversold. A dip below 30 could indicate an oversold condition and potential for reversal.
Price Action Insights
A break below 1.1600 could open doors for further downside toward 1.1520.
On the upside, a clean break and retest above 1.1700 would invalidate the bearish structure and favor bulls.
Trading Plan
Bearish Scenario: Look for sell opportunities below 1.1650 with targets near 1.1600 and 1.1520.
Bullish Scenario: A breakout above 1.1700 may offer buy setups toward 1.1750 and 1.1800.
📊 Risk Management: Always use proper stop-loss and position sizing to manage risk effectively.
💬 What’s your bias on EUR/USD? Are you expecting a breakdown or reversal from here? Drop your analysis in the comments!
EURUSD Daily Forecast -Q3 | W35 | D2 | Y25📅 Q3 | W35 | D2 | Y25
📊 EURUSD Daily Forecast
🔍 Analysis Approach:
I’m applying Smart Money Concepts, focusing on:
Identifying Points of Interest on the Higher Time Frames (HTFs) 🕰️
Using those POIs to define a clear trading range 📐
Refining those zones on Lower Time Frames (LTFs) 🔎
Waiting for a Break of Structure (BoS) for confirmation ✅
This method allows me to stay precise, disciplined, and aligned with the market narrative, rather than chasing price.
💡 My Motto:
"Capital management, discipline, and consistency in your trading edge."
A positive risk-to-reward ratio, paired with a high win rate, is the backbone of any solid trading plan 📈🔐
⚠️ Losses?
They’re part of the mathematical game of trading 🎲
They don’t define you — they’re necessary, they happen, and we move forward 📊➡️
🙏 I appreciate you taking the time to review my Daily Forecast.
Stay sharp, stay consistent, and protect your capital
— FRNGT 🚀
FX:EURUSD

EURUSD and GBPUSD Analysis todayHello traders, this is a complete multiple timeframe analysis of this pair. We see could find significant trading opportunities as per analysis upon price action confirmation we may take this trade. Smash the like button if you find value in this analysis and drop a comment if you have any questions or let me know which pair to cover in my next analysis.

EUR/USD SetupThis EUR/USD analysis suggests a bullish move. A limit trade is set around 1.17038 with a stop loss at 1.16460. The first target is 1.17825 and the second target is 1.18531, indicating potential upward continuation.

EURUSD continues its sideways accumulation phase✏️ OANDA:EURUSD is stuck in a boundary created by 2 trendlines. The sideways accumulation trend is still going on. A trading signal appears when one side shows its power and breaks out of the price boundary. Some selling pressure started in London trading today towards the Keylevel 1.158 support zone. Buy and sell strategy will be activated when there is confirmation from H4 showing the market trend around this zone.
📉 Key Levels
BUY trigger Rejection at support 1.158
Target 1.177
Risky when closing below 1.158 active SELL to target 1.140
Leave your comments on the idea. I am happy to read your views.

EUR/USD Buy Setup from Support Zone towards 1.1743 TargetEUR/USD 2H Chart Analysis
The chart shows EUR/USD trading within a rising channel, with the price currently retesting the support zone (1.1600–1.1620).
Trend & Structure: Price has been respecting channel support and resistance. Currently, it bounced off the lower boundary of the channel, signaling a potential bullish reversal.
Support & Resistance: Strong support at 1.1600 zone, resistance/target at 1.1743.
Moving Averages: EMA 70 (1.1655) and EMA 200 (1.1648) are near, acting as dynamic resistance. A bullish break above them confirms upside continuation.
Candlestick & Momentum: Long wicks near support indicate buyer interest, suggesting accumulation before reversal.
Risk Management: Stop loss should be placed just below 1.1580 (last swing low).
✅ BUY Setup: From 1.1600–1.1620 support zone, targeting 1.1743 with stop loss below 1.1580.
📊 Strategies Used: Trendline channel, EMA confirmation, support/resistance, candlestick patterns, and risk-reward setup.

What’s your view on today’s EUR/USD trend? Hello traders! 🔥 Welcome to today’s EUR/USD analysis with GreenFire_Forex.
Key Support and Resistance Levels
Support: 1.16300–1.16440 zone 📉
Resistance: 1.16700–1.16800 zone 📈
Bullish Scenario
If EUR/USD holds above the key support zone (1.16440), a move toward the resistance at 1.16700 is possible. A breakout above 1.16800 could open the path to higher targets near 1.17000.
Bearish Scenario
If price fails to hold above support and breaks below 1.16300, expect bearish momentum to accelerate, potentially testing lower targets beneath 1.16300.
Simple Trading Plan
Buy near support (1.16440–1.16300) if bullish signs appear.
Sell near resistance (1.16700–1.16800) if bearish signs emerge.
Wait for a clear breakout above resistance or below support for confirmation before entering new trades.
What’s your view on today’s EUR/USD trend? Share your thoughts in the comments and don’t forget to follow GreenFire_Forex for more daily insights! ❤️📈

EUR/USD — Buyers Still in Control, Eyes on Key US DataEUR/USD continues to hold strong bullish momentum despite the recent recovery in USD (DXY). Traders are now closely watching today’s high-impact US economic releases during the New York session:
📊 USD Prelim GDP q/q → Forecast: 3.1% (Prev. 3.0%)
📊 USD Unemployment Claims → Forecast: 231K (Prev. 235K)
🔎 Market Outlook
If US data comes out stronger than expected, the USD could regain momentum, putting pressure on EUR/USD. A potential correction may retest lower demand zones around 1.1615 – 1.159x.
If the data is neutral or weaker, buyers could push higher into the 1.1703 zone, and possibly extend towards 1.1740 resistance, a key level aligned with previous supply and Fibonacci retracements.
📌 Key Levels to Watch
Resistance: 1.1703 – 1.1740 (major supply / fib zone)
Support: 1.1657 – 1.1615 (short-term buy zone)
Deep Support: 1.1593 (liquidity grab level)
🎯 MMFLOW Strategy
👉 Focus on reactions to US data release — volatility will be elevated.
👉 Wait for liquidity sweeps into demand zones for clean long setups.
👉 Short-term bias: still bullish as long as 1.1615 holds.
⚡️ Only one major economic event this week — meaning all market attention is on today’s release. Expect strong volatility!
💬 What do you think? Will EUR/USD power through 1.1700+, or will USD strength drag it back towards 1.16xx?

EUR/USD Recovers from 20-Day LowEUR/USD Recovers from 20-Day Low
The EUR/USD pair today is moving under the influence of several factors:
- Donald Trump’s decision to dismiss Lisa Cook, a member of the Federal Reserve Board of Governors, raising concerns over the Fed’s independence;
- expectations of a Fed rate cut in September;
- anticipation of US GDP and jobless claims data (due today at 15:30 GMT+3);
- the political crisis in France.
These and other drivers pushed the pair down to a 20-day low yesterday (with a local low L3 formed on the EUR/USD 4-hour chart), before it staged a firm recovery.
EUR/USD Chart Technical Analysis
At the start of the week, we:
→ outlined a descending channel (shown in red);
→ drew an interim upward price trajectory (purple lines);
→ highlighted bearish signs (for instance, the lower purple line acting as resistance), suggesting a possible attempt to break key support at 1.1600.
Yesterday’s price action confirmed such an attempt, but it triggered renewed demand. The bulls prevented further downside momentum, leaving EUR/USD trading above 1.1600 today.
At the same time:
→ with the formation of the L3 low, a bullish engulfing pattern can be observed;
→ the sequence of higher highs (H1→H2→H3) alongside lower lows (L1→L2→L3) forms a megaphone pattern.
As for resistance, the 1.1660 level stands out – bears were successful here when they broke through the lower boundary of the interim upward trajectory, and this zone also coincides with the axis of the megaphone pattern.
Thus, we could assume that in the near term EUR/USD may fluctuate within the 1.1600–1.1660 range, until sentiment shifts – for example, due to statements from Washington or fresh US labour market data.
This article represents the opinion of the Companies operating under the FXOpen brand only. It is not to be construed as an offer, solicitation, or recommendation with respect to products and services provided by the Companies operating under the FXOpen brand, nor is it to be considered financial advice.

EURUSD – DAILY FORECAST Q3 | W35 | D28 | Y25📊 EURUSD – DAILY FORECAST
Q3 | W35 | D28 | Y25
🔍 Daily Forecast | EURUSD
Here’s a concise breakdown of the current chart setup 🧠📈:
📌 Higher time frame order blocks have been identified — these are our patient points of interest 🎯🧭.
We wait for a confirmed break of structure 🧱✅ before executing any position.
This keeps us disciplined, and in sync with what the price action is actually telling us — not what we want it to say.
📈 Risk Management Protocols
🔑 Core Principles:
Max 1% risk per trade
Execute only at pre-identified levels
Use alerts, not emotion
Stick to your RR plan (minimum 1:2)
🧠 You’re not paid for how many trades you take — you're paid for how well you manage risk.
"Trade what the market gives, not what your ego wants."
Stay mechanical. Stay focused. Let the probabilities work for you. 🎯📊
FRGNT
FX:EURUSD
