Will Fibre's change of character hold?EURUSD has shown earliest signs of what seems like a change in the trend, shorting from the current price would be much cheaper!!
Eurusdtradeidea

Fiber Battle Plan: Bulls Prepare for EUR/USD Uprising🏴☠️💸 EUR/USD "Fiber Heist Plan" – Thief Trader's Bullish Raid! 💸🏴☠️
🔓 The Vault is CRACKED – Time to LOAD UP! 🚀📈💰
🎯 MASTER PLAN:
Asset: EUR/USD ("Fiber")
Direction: BULLISH HEIST 🐂💪
Entry Strategy: Layered Limit Orders (Sneaky thief-style accumulation)
Trigger: Hull MA CROSS confirmed + Price > 1.16300 🎯
Stop Loss: 1.15100 (Guarding the loot!) 🛡️
Target: 1.18000 (Bank it & bounce!) 💰🔥
🕵️ THIEF TRADER’S BREAKDOWN:
💡 "Weak hands shake, WE TAKE!" – This is a high-probability bullish raid with layered entries for MAXIMUM stealth.
✅ ENTRY TACTICS:
Buy Limit Orders stacked near swing lows (1.16300 zone)
Only trigger AFTER Hull MA confirms bullish flip (No early fomo!)
Scale in like a pro thief – don’t dump all bullets at once.
⚔️ RISK CONTROL (MANDATORY!):
SL at 1.15100 (Break this? ABORT MISSION.)
No revenge trading! Stick to the plan or get caught slippin’.
🎯 PROFIT SECURING:
First TP: 1.18000 (Lock in gains!)
Trailing SL option (If momentum stays strong, let it RUN!)
🚨 THIEF’S WARNING:
⚠️ News = Trap Zone! (Avoid fresh entries during high-impact news)
⚠️ No greed! Secure profits before the market reverses on you.
⚠️ Follow the Hull MA like a shadow – if it flips bearish, RE-EVALUATE!
🔥 SUPPORT THE HEIST!
💥 SMASH THAT LIKE & BOOST BUTTON if you're riding with the Thief Trading Crew!
💬 Comment "🚀 LOADED!" if you're in!
We steal smart, trade sharp, and stack profits like bandits. Stay lethal, traders! 🐱👤💸🔥

EURUSD potential longs due to as expected retail sales data. U.S. retail sales for July 2025 rose by 0.5% month-over-month, reaching $726.3 billion, according to the Commerce Department’s Census Bureau. This matched economists’ expectations but was a slowdown from June’s revised 0.9% increase.
Due to this we will be looking for Euro strength vs Dollar weakness.

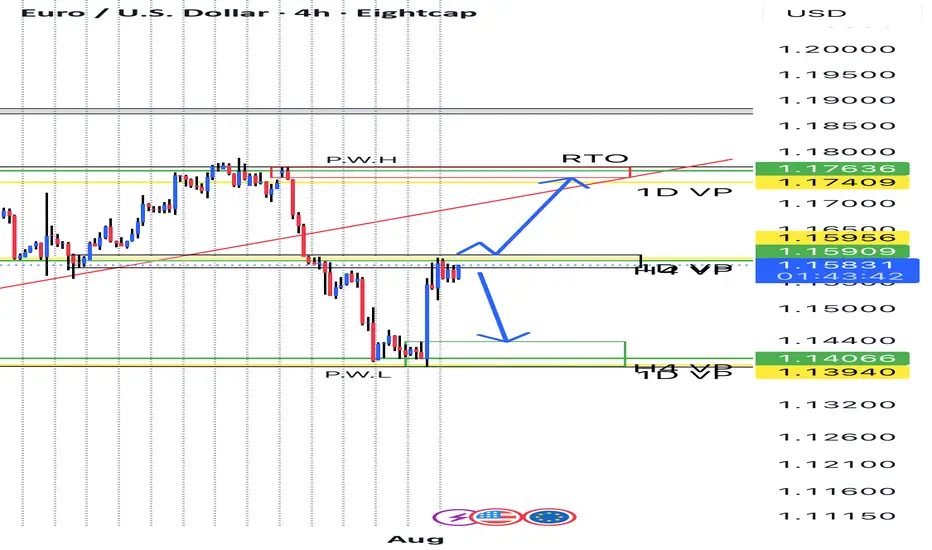
EURUSD POSSIBLE SELL SETUP **RISK MANAGEMENT **This chart illustrates a **Supply and Demand** setup on the EUR/USD daily timeframe.
-Supply Zone (Red Area)**: Price previously dropped sharply from this zone (around 1.1713–1.1796), showing strong selling pressure.
-BOS (Break of Structure)**: The market broke a key support level, confirming bearish intent.
-Entry**: Price retraced back into the supply zone, offering a short-selling opportunity.
* **Targets**:
-TP1** at \~1.1500 (first liquidity pool / minor demand)
-TP2** at \~1.1400 (major demand zone)

EURUSD Pullback Could Present A Buying Opportunity📊 I’m analyzing EURUSD and have observed a recent bullish break of structure on the daily chart 📈. My bias remains to the upside, but with price now stretched after its latest push, I’m watching for a pullback into important value zones. A confirmed bullish break of market structure from these areas could set up a strong long opportunity 🔍💡🚀 (not financial advice).

EURUSD after the newsYesterday, EURUSD continued its bullish move, reaching 1,1697.
If the rally continues, the next target is 1,1760.
Some pullbacks are still possible before breaking above the previous high, which could provide opportunities for additional entries.
Focus only on trades in the main direction!

EU shortsLooking for shorts after Gu swept PDH, an S.M.T occurred aiming for PDL.
On the 4hr we happen to see another SMT occurring.
On the 15min i am looking for entries after i get a CISD.

EURUSD before inflation dataEURUSD remains range-bound ahead of the key U.S. inflation news scheduled for 1:30 PM (GMT+1).
We expect increased volatility following the release.
Wait for the market’s reaction and look for entries only once the main direction is confirmed.

EURUSD - General dynamics and rangesCurrent technical status (Daily/Weekly)
After breaking through the key support at ~1.1445 and then rebounding, EUR/USD is moving up within a steady daily trend, confirmed by the formation of the morning star candlestick pattern, with the short-term target at 1.1800.
The monthly chart shows the development of an upward trend from the October 2025 closing level, with the target of raising prices to 1.1710, but a correction to 1.1588 — the 14.6% Fibonacci retracement level — is possible.
Short-term levels (H1–H4)
Support:
1.1500–1.1480 — the buy zone, from where a reversal has already occurred; the stop level should logically be placed below 1.1440.
Resistance:
1.1600–1.1680 — the near zone, then — 1.1700 and 1.1800 if growth continues.
General dynamics and ranges
The week from August 4 to 8 was characterized by a slowdown in growth, fluctuations in the range of 1.1390–1.1500. The MACD and Stochastic indicators reflect the sellers' momentum, but the oversold situation can provoke a local rebound — growth is possible only with a breakout of 1.1550.
The 1.1650 level is a historically significant barrier. It coincides with the 50% Fibonacci correction and a number of moving averages. Its breakout will open the way to the 1.1700–1.1750 zones. Otherwise, a rollback to 1.1580–1.1530–1.1500 is likely.

EUR/USD Robbery Blueprint Bear Strike Activated!💣🎯Operation Fiber Down: EUR/USD Robbery Blueprint (Day Trade Edition) 💰🔫
🚨 Thieves, Hustlers & Chart Bandits Assemble! 🚨
🌍 Hi! Hola! Ola! Bonjour! Hallo! Marhaba! 🌍
Welcome back to another Thief Trading Operation, where the money never sleeps—and neither do we. Let’s break into the vault of EUR/USD “The Fiber” with surgical precision. 🧠💼🕶️
🧨 THE MASTER ROBBERY PLAN: EUR/USD SHORT STRIKE 🔍💸
💀 Market Bias: Bearish – Trend Reversal + Supply Trap Setup
🎯 Target: 1.14600
🛑 Stop-Loss: Near Swing High (around 1.16700 – 4H chart view)
🕓 Timeframe Focus: 15m / 30m / 3H
🧭 ENTRY ZONE:
👣 Plan your entry from recent high retests—that’s where the big money bulls get trapped.
🎯 Use Sell Limit Orders (DCA style / Layered Limit Orders) like a true thief setting up tripwires.
💼 RISK STRATEGY:
💡 SL should match your lot size and order count—not one-size-fits-all!
📌 Place above key structure or swing level (e.g. 1.16700) based on timeframe.
🔍 BEHIND THE SCENES – THE WHY:
The EUR/USD "Fiber" pair is showing all the classic signs of a trend shift and bear raid setup, including:
📰 Fundamentals weakening the Euro
💣 COT Report reveals institutional exits
🍂 Seasonal Bias points to downward trend
📉 Intermarket Pressure from bond yields & USD strength
📊 Sentiment turning overly bullish = trap zone
⛽ Storage & Inventory imbalances adding fuel
📌 Reminder: Before any robbery, study the layout—Macro, Fundamentals, Sentiment, and Intermarket are your blueprint.
🚨 HEIST ALERT – PROTECT THE LOOT:
🕰️ High-Impact News Events? Tighten up!
💼 Don’t take fresh entries during releases.
🔐 Use Trailing SLs to lock in profits.
🎯 Exit with grace before the sirens start.
⚡🔥JOIN THE CREW, BOOST THE LOOT🔥⚡
💥 Smash the Boost Button 💥 if you're vibing with the Thief Trading Movement.
We ain’t just trading—we’re executing strategic robberies on the market’s weaknesses.
🧠💪 Every like = more power to the crew. Every comment = a new map to a vault.
We rob, retreat, and repeat. Let’s make money with skill, not luck. 🕶️💰🚁
⚠️ LEGAL COVER (For the Lawyers 😏):
This plan is not investment advice, just an organized heist blueprint by chart robbers.
Always manage your own risk and update your plan as the market evolves.
🕶️ Stay ready for the next master plan... Until then, keep your charts clean and your stops tight. 🕶️💣📉
– Thief Trader Out 🐱👤🚀

EURUSD continues its uptrendYesterday, EURUSD extended its climb, reaching 1,1699.
The trend remains firmly bullish, with buying opportunities being the only viable option.
Watch for a pullback and a continuation towards the next target.
Look for a favorable risk-to-reward ratio and manage your risk carefully.

EUR/USD Bullish Outlook – Why the Euro Could Strengthen📈 EUR/USD Bullish Outlook – Why the Euro Could Strengthen
EUR/USD is showing signs of a potential rebound, supported by both technical setups and shifting fundamentals.
1. Dovish Fed Expectations:
Markets are increasingly pricing in Fed rate cuts as U.S. inflation cools and economic growth shows signs of slowing. A more dovish Fed stance puts downward pressure on the dollar, offering support to the euro.
2. ECB Less Dovish Than Expected:
While the ECB has started easing, recent comments suggest a cautious approach to further cuts. If inflation remains sticky in the Eurozone, the ECB could pause or slow future rate reductions, which would support EUR.
3. Technical Support & Reversal Patterns:
EUR/USD has bounced off strong support forming a bullish reversal pattern (e.g. double bottom / bullish engulfing candle). Momentum indicators like RSI and MACD are turning upward, signaling potential continuation of the move.
4. Improving Eurozone Data:
Recent Eurozone data has surprised to the upside, especially in manufacturing and services PMIs. If this trend continues, confidence in the euro could rise.
📌 Conclusion:
With growing expectations for a Fed pivot and signs of stabilization in the Eurozone economy, EUR/USD could push higher.

EURUSD trading range. Top-bottom trading strategy✏️ OANDA:EURUSD surged after Nonfarm data. Formed a wide trading range bounded by 2 trendlines. The market needs more momentum to break out of the range. If there is confirmation at the upper and lower bands, it is a top-bottom trading signal for this pair.
📉 Key Levels
SELL trigger: reject resistance 1.175
BUY trigger: reject support 1.145
Leave your comments on the idea. I am happy to read your views.

EURUSD - Current technical pictureCurrent technical picture
The euro strengthened after weak US employment data and broke above 1.1670, which greatly improved its technical sentiment
The pair is currently testing its 200-hour moving average (≈1.1578) - stability above this level indicates confident interest in the euro
The price has broken the 50% retracement level of the decline from the July 1 high (≈1.16098) and has already reached the 61.8% level (≈1.1661), which previously served as resistance in mid-July

EURUSD – DAILY FORECAST Q3 | W32 | D7 | Y25📊 EURUSD – DAILY FORECAST
Q3 | W32 | D7 | Y25
Daily Forecast 🔍📅
Here’s a short diagnosis of the current chart setup 🧠📈
Higher time frame order blocks have been identified — these are our patient points of interest 🎯🧭.
It’s crucial to wait for a confirmed break of structure 🧱✅ before forming a directional bias.
This keeps us disciplined and aligned with what price action is truly telling us.
📈 Risk Management Protocols
🔑 Core principles:
Max 1% risk per trade
Only execute at pre-identified levels
Use alerts, not emotion
Stick to your RR plan — minimum 1:2
🧠 You’re not paid for how many trades you take, you’re paid for how well you manage risk.
🧠 Weekly FRGNT Insight
"Trade what the market gives, not what your ego wants."
Stay mechanical. Stay focused. Let the probabilities work.
FX:EURUSD

EURUSD – Target: 1,1731EURUSD reached 1,1668, confirming the uptrend on the 1-hour chart.
The next target is a breakout above 1,1731.
At the current levels, the risk-to-reward ratio is not favorable.
Wait for a pullback to look for new entry opportunities.

EUR/USD Intraday Analysis – Bearish Momentum Continues with WeakThe 1-hour chart of EUR/USD suggests continued bearish momentum, though a temporary price bounce may be on the horizon. The pair is currently trading around 1.15589, struggling below the 9-period Simple Moving Average (SMA). This indicates that short-term trend pressure remains bearish.
🔍 Technical Overview
✅ Price Action:
The market recently made a lower low, touching near 1.15400 before showing a minor rebound.
Sellers have clearly been in control, forming a strong sequence of bearish candles.
The SMA 9 is trending downward and is acting as dynamic resistance, confirming bearish pressure.
📊 Indicators:
SMA 9 (close): Price is still trading below the moving average, indicating that the pair is in a short-term downtrend.
RSI 14 (Relative Strength Index): The RSI has dropped below the 40 level, which shows bearish momentum. However, the RSI has started to curl upward, suggesting a minor relief rally may occur — but it’s too early to confirm a reversal.
📈 Possible Trade Setups:
🔻 Sell on Pullback (Preferred):
Sell Entry: Near 1.15750–1.15800 (around SMA resistance)
Stop Loss: 1.16050
Take Profit: 1.15300 / 1.15000
⚠️ Cautious Buy (Aggressive):
If RSI breaks above 50 and price closes above SMA 9, short-term buying could be considered, but overall bias remains bearish until reversal confirmation.
🔧 Support & Resistance Levels:
LevelPriceResistance1.15850Resistance1.16000Support1.15350Support1.15000
📌 Conclusion
EUR/USD remains in a short-term bearish trend, with sellers dominating price action. While a minor RSI bounce is visible, the price still trades under SMA resistance, making “Sell on Rally” the more favorable strategy. Traders should be cautious of any news-driven volatility and wait for strong confirmation before entering aggressive buy trades.

EURUSDEURUSD needs a correction down or a break above resistance, retest and another push up this week.
Disclosure: We are part of Trade Nations Influencer Program and receive a monthly fee for using their TradingView charts in our analysis.
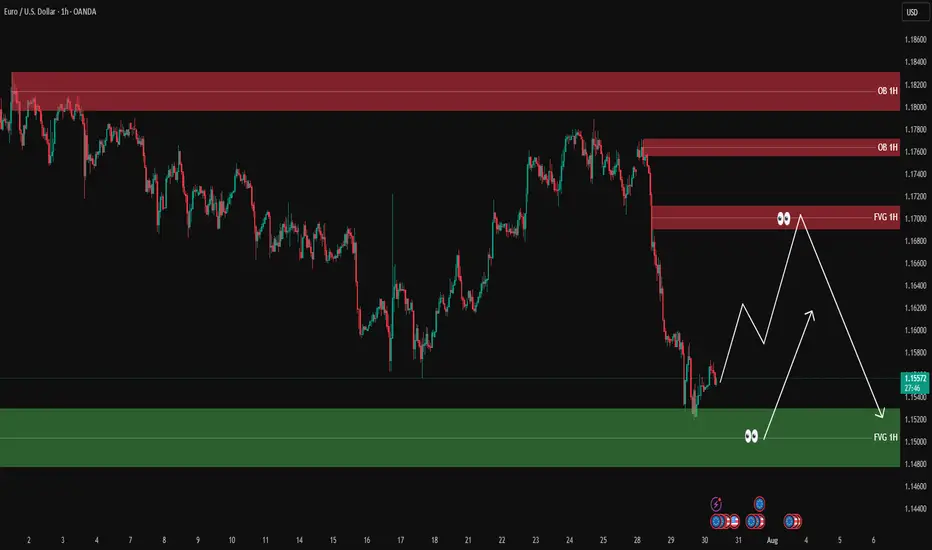
EURUSD analysis - 1H FVG and OB setupsOn the 1H timeframe, price has entered the green demand zone (1H FVG) around 1.1480 – 1.1520 after a strong bearish leg.
We're expecting a bullish retracement from this zone, aiming toward the upper red FVG/OB zone around 1.1690 – 1.1715.
📌 There are two key scenarios:
1️⃣ Scenario 1: Price starts moving up from the green FVG → reaches red FVG zone → short setup after lower timeframe confirmation
2️⃣ Scenario 2: Price makes an initial move to ~1.1620 → pulls back to the green zone → pushes back up into the red OB → short setup on confirmation
🎯 Final target for both scenarios: a break below the green FVG zone and continuation down
✅ Entry only after confirmation from lower timeframes (3M–15M)
❌ No trades without confirmation
EURUSD shows bullish momentumLast week’s price signals pointed to bullish momentum, setting the tone for this week’s market action.
EURUSD broke and closed above our reversal zone, indicating a likely continuation to the upside.
As long as the price stays above 1,1388, we’ll be watching for a higher low and potential buying opportunities.
You can easily spot the next target levels by checking previous highs and using the Fibonacci expansion tool.

EURUSD(20250804) Today's AnalysisMarket News:
① The US non-farm payrolls rose by 73,000 jobs in July, far below the expected 110,000; the previous two months saw a significant downward revision of 258,000 jobs, prompting traders to fully price in two Fed rate cuts before the end of the year.
② The US ISM Manufacturing PMI for July unexpectedly fell to 48, below the expected 49.5 and the lowest level since October 2024.
③ The University of Michigan Consumer Confidence Index for July reached a five-month high.
Technical Analysis:
Today's Buy/Sell Levels:
1.1524
Support and Resistance Levels:
1.1727
1.1651
1.1602
1.1446
1.1397
1.1321
Trading Strategy:
On a break above 1.1602, consider a buy entry, with the first target price at 1.1651. On a break below 1.1524, consider a sell entry, with the first target price at 1.1446.

EUR/USD Technical OutlookEUR/USD is currently trading within a Descending Triangle formation. At present, the pair shows a higher probability of an upside breakout from this structure. A confirmed break above the immediate resistance zone at 1.1428 – 1.1430 could accelerate bullish momentum, opening the way toward the next key resistance level at 1.1485.
On the other hand, if the pair fails to sustain above the triangle and breaks to the downside, price may extend losses toward the 1.1375 – 1.1360 support area. From this zone, a potential corrective rebound could occur before the broader bearish trend resumes.
Overall, short-term direction hinges on the breakout of the descending triangle, with 1.1428 – 1.1430 as the critical level to watch for bulls, and 1.1375 – 1.1360 for bears. FOREXCOM:EURUSD

EURUSD ahead of NFPEURUSD is still trading within the range established after Wednesday’s news.
We’re watching for a close above 1,1503, which would confirm a potential buying opportunity.
Today at 1:30 PM (London), the NFP data will be released, which could further impact price action - especially if a reversal is underway.
In case of a decline, the next key support level to watch is around 1,1346.
