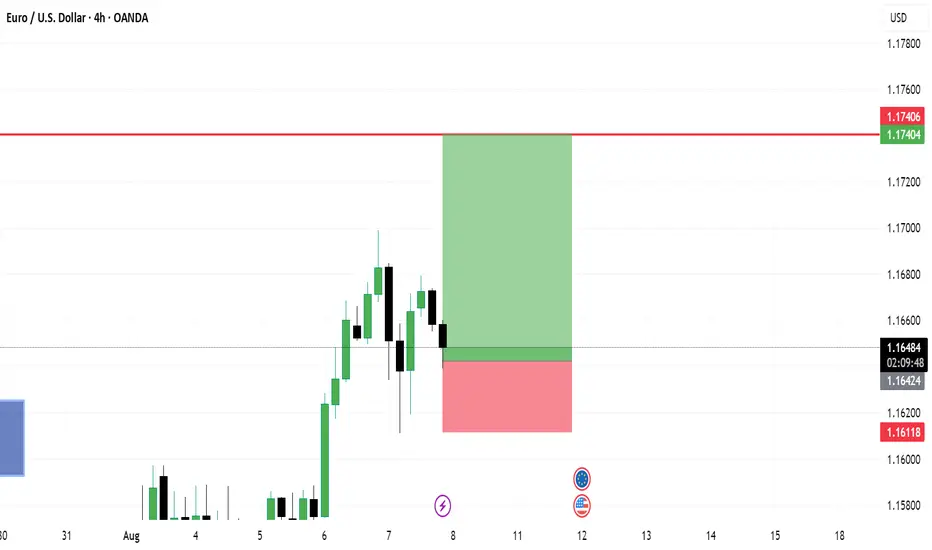
EURUSD - LongEURUSD – BUY Setup
📊 H4 Timeframe Analysis by Nii_Billions
🔹 Outlook: BULLISH
Using multiple timeframe confirmation for direction.
Strategy blends technicals, fundamentals, and sentiment.
Entry, SL, and TP structured with risk management in mind.
🟢 Educational purposes only 🟢
❤️ Like & comment if this helps your trading journey.
👉 Follow for more swing trade ideas.
Eurusdtrend

EURUSD Bears Regain Control as Dollar Strength Holds FirmEURUSD is showing fresh signs of exhaustion after its recent bounce, struggling to hold momentum against a resilient U.S. dollar. Price action has rejected trendline resistance and is now threatening to extend lower toward key demand zones. With the ECB battling slowing growth while the Fed remains cautious but firm, EURUSD faces mounting pressure to the downside.
Current Bias
Bearish – rejection at resistance keeps the pair vulnerable to further downside toward 1.1600 and potentially 1.1410.
Key Fundamental Drivers
U.S. dollar demand supported by safe-haven flows and relatively strong U.S. economic data.
ECB’s dovish tilt as growth falters in the Eurozone, limiting scope for additional rate hikes.
Differentials in monetary policy continue to favor the USD over the EUR in the medium term.
Macro Context
Interest rate expectations: The Fed is expected to keep rates higher for longer, maintaining a hawkish edge, while the ECB faces pressure to slow policy tightening given weak Eurozone growth.
Economic growth: U.S. growth remains more resilient than Europe’s, with Eurozone industrial and consumer sectors showing signs of fatigue.
Commodity flows: Lower European energy demand and potential disruptions in global gas/oil trade leave the euro vulnerable.
Geopolitical themes: Trade tariffs, global slowdown risks, and U.S.–EU policy divergence all weigh on the single currency.
Primary Risk to the Trend
A surprise hawkish shift from the ECB or softer-than-expected U.S. data could reignite EUR upside momentum and squeeze shorts.
Most Critical Upcoming News/Event
ECB policy meeting minutes (guidance on growth vs. inflation trade-off)
U.S. PMI & jobless claims (gauging the Fed’s stance on growth resilience)
Leader/Lagger Dynamics
EURUSD is a leader pair in the FX market, often dictating overall USD sentiment.
Movements here influence correlated assets such as DXY, gold, and EUR-crosses like EURJPY and EURNZD.
Key Levels
Support Levels: 1.1606, 1.1410
Resistance Levels: 1.1710, 1.1797
Stop Loss (SL): 1.1800
Take Profit (TP): 1.1606 (first target), 1.1410 (extended target)
Summary: Bias and Watchpoints
EURUSD continues to lean bearish, with rejection from resistance and a weakening Eurozone macro backdrop providing downside pressure. The bias favors further losses toward 1.1606, with extended downside into the 1.1410 region if bearish momentum accelerates. A stop loss above 1.1800 provides protection against a breakout reversal. Traders should closely monitor ECB commentary and U.S. data releases, as any divergence from expectations could quickly shift momentum. Until then, the path of least resistance remains to the downside.

EURUSD is slow moving. Wait for more factors to enter orders✏️ EURUSD is trading in a consolidation range, the trend to trade at the moment is not there. Wait for clearer momentum at resistance or support zones to set up Orders. 1.154 plays an important support role at the moment of the bullish wave structure, it is the confluence point of the Trendline and the support zone of the BUY side. In the opposite direction, the resistance 1.171 plays the role of the upper boundary of the price channel.
📉 Key Levels
BUY Trigger Rejection at support1.154
BUY DCA Trigger Breakout of resistance 1.171
Leave your comments on the idea. I am happy to read your views.

EURUSD Weekly Forecast – Q3 | W35 | Y25
📊 EURUSD – WEEKLY FORECAST
📈 EURUSD Weekly Forecast – Q3 | W35 | Y25
Much like other USD-cross pairs, EUR/USD ended the week strongly bullish, with the weekly candle closing above the weekly 50 EMA.
This close shifts the higher time frame bias toward long-term buy positions, in line with broader dollar weakness.
🔍 Forecast & Strategy:
Despite the bullish weekly close, I’m anticipating a retracement early in the week — specifically a pullback into the daily imbalance created by Friday’s strong move.
📍 Below that imbalance, there’s a daily order block that aligns with:
The daily 50 EMA
Mid-range and lower-range points of interest
This confluence zone becomes a key area to look for long executions, provided the market gives us confirmation.
🎯 Execution Plan:
Once price enters these zones (both short- and long-term POIs):
Look for a clear Break of Structure (BOS) on the 5M or 15M timeframes before executing.
No BOS = no entry.
📉 Short-Term Shorts – With Caution:
If price offers valid short setups from current highs, target areas will include:
The daily imbalance (first target & partial TP zone)
The daily 50 EMA and the daily order block (final TP and long re-entry zone)
Important: All short positions should be managed aggressively and fully closed by the time price reaches the bullish POI, as the higher time frame bias favors longs.
✅ Bias: Bullish (Higher Time Frame)
⚠️ Shorts are counter-trend and must be managed accordingly
📌 Wait for confirmation before executing either side
Let’s stay patient, let structure lead, and execute only when the market tells us it’s time.
FRGNT
FX:EURUSD

EURUSD shows a bullish rebound after Powell's speechCurrent technical picture
The EUR/USD pair showed a bullish rebound after Powell's speech at the Jackson Hole forum, which weakened the USD - DXY fell by 0.9%, which adds support to the euro. Thus, a double top was formed at 1.1800 and strong support at 1.1600. As a result, the weekly candle was almost unchanged.
FXStreet notes a stable bullish momentum - after a fall to 1.1583, the euro recovered above 1.1700 against the backdrop of a weak dollar.
The analysis shows that the fall to 1.1582 stopped the decline, and the current breakout of the 1.1729 level indicates a continuation of the upward movement. Focus is on the retest of 1.1819. As long as the 1.1582 level holds, the advantage remains with buyers.

EURUSD Epic Bearish Breakout!
HI,Traders !
#EURUSD made an epic
Bearish breakout of a very
Strong key horizontal level
Of 1.16304 which is now a
Resistance and the breakout
Is confirmed so we are
Bearish biased and we will
Be expecting a further
Bearish move down !
Comment and subscribe to help us grow !

EURUSD – DAILY FORECAST Q3 | W34 | D21 | Y25📊 EURUSD – DAILY FORECAST
Q3 | W34 | D21 | Y25
Daily Forecast 🔍📅
Here’s a short diagnosis of the current chart setup 🧠📈
Higher time frame order blocks have been identified — these are our patient points of interest 🎯🧭.
It’s crucial to wait for a confirmed break of structure 🧱✅ before forming a directional bias.
This keeps us disciplined and aligned with what price action is truly telling us.
📈 Risk Management Protocols
🔑 Core principles:
Max 1% risk per trade
Only execute at pre-identified levels
Use alerts, not emotion
Stick to your RR plan — minimum 1:2
🧠 You’re not paid for how many trades you take, you’re paid for how well you manage risk.
🧠 Weekly FRGNT Insight
"Trade what the market gives, not what your ego wants."
Stay mechanical. Stay focused. Let the probabilities work.
FX:EURUSD

EURUSD(20250821) Today's AnalysisMarket Update:
This week, central bankers from around the world gathered in Jackson Hole, Wyoming, for the annual global central bank meeting. They planned not only to exchange research and enjoy the beautiful mountain scenery, but also to defend Federal Reserve Chairman Jerome Powell. Powell has come under sustained attack from US President Trump for his refusal to cut interest rates. Trump has also promised to replace Powell with a more compliant candidate after his term ends next year. This offensive has unnerved global policymakers, who worry that central bank independence, seen as key to controlling inflation, could be undermined.
Technical Analysis:
Today's Buy/Sell Levels:
1.1648
Support and Resistance Levels:
1.1699
1.1680
1.1668
1.1628
1.1616
1.1597
Trading Strategy:
On a break above 1.1668, consider entering a buy position, with the first target at 1.1680.
On a break below 1.1648, consider entering a sell position, with the first target at 1.1628.

Market Analysis: EUR/USD Dips AgainMarket Analysis: EUR/USD Dips Again
EUR/USD declined from 1.1720 and traded below 1.1650.
Important Takeaways for EUR/USD Analysis Today
- The Euro started a fresh decline after a decent move above 1.1680.
- There was a break below a key bullish trend line with support at 1.1650 on the hourly chart of EUR/USD.
EUR/USD Technical Analysis
On the hourly chart of EUR/USD, the pair rallied above the 1.1680 resistance zone before the bears appeared, as discussed in the previous analysis. The Euro started a fresh decline and traded below 1.1660 against the US Dollar.
There was a break below a key bullish trend line with support at 1.1650, and a low was formed near 1.1622. After that, the pair started a consolidation phase.
There was a minor recovery wave above 1.1630. EUR/USD is now trading below 1.1650 and the 50-hour simple moving average. On the upside, the pair is now facing hurdles near the 23.6% Fib retracement level of the downward move from the 1.1692 swing high to the 1.1622 low at 1.1640.
The next key resistance is 1.1655 and the 50% Fib retracement. The main barrier for the bulls could be 1.1665. A clear move above 1.1665 could send the pair toward 1.1690. An upside break above 1.1690 could set the pace for another increase. In the stated case, the pair might rise toward the 1.1720 zone.
If not, the pair might resume its decline. The first major support on the EUR/USD chart is near 1.1620. The next important region for buyers sits at 1.1600. If there is a downside break below 1.1600, the pair could drop toward 1.1550. Any more losses might send the pair toward 1.1500.
This article represents the opinion of the Companies operating under the FXOpen brand only. It is not to be construed as an offer, solicitation, or recommendation with respect to products and services provided by the Companies operating under the FXOpen brand, nor is it to be considered financial advice.

EURUSD Bullish Structure Break: Watching for Pullback EntryI’m closely monitoring EURUSD 📊, where price action is starting to show a bullish structure break 📈, signaling potential upside 🔝. On the 30-minute chart ⏱️, I’m watching for a pullback into the imbalance zone ⚖️ highlighted in the video 🎥. As long as price holds above the low of that imbalance range ⬇️, I’ll be looking for a potential long opportunity 🚀💡. (Not financial advice).

EURUSD: Elliot Waves AnalysisHello friends. Based on Elliott waves, the euro currency can be seen to be facing the monthly pivot resistance and also the completion of the fifth wave. Based on the DXY index, which is likely to rise, this view can be correct. So, we will expect a downward trend from this currency.

EURUSD – WEEKLY FORECAST Q3 | W34 | Y25📊 EURUSD – WEEKLY FORECAST
Q3 | W34 | Y25
Weekly Forecast 🔍📅
Here’s a short diagnosis of the current chart setup 🧠📈
Higher time frame order blocks have been identified — these are our patient points of interest 🎯🧭.
It’s crucial to wait for a confirmed break of structure 🧱✅ before forming a directional bias.
This keeps us disciplined and aligned with what price action is truly telling us.
📈 Risk Management Protocols
🔑 Core principles:
Max 1% risk per trade
Only execute at pre-identified levels
Use alerts, not emotion
Stick to your RR plan — minimum 1:2
🧠 You’re not paid for how many trades you take, you’re paid for how well you manage risk.
🧠 Weekly FRGNT Insight
"Trade what the market gives, not what your ego wants."
Stay mechanical. Stay focused. Let the probabilities work.
FRGNT
FX:EURUSD

Fiber Battle Plan: Bulls Prepare for EUR/USD Uprising🏴☠️💸 EUR/USD "Fiber Heist Plan" – Thief Trader's Bullish Raid! 💸🏴☠️
🔓 The Vault is CRACKED – Time to LOAD UP! 🚀📈💰
🎯 MASTER PLAN:
Asset: EUR/USD ("Fiber")
Direction: BULLISH HEIST 🐂💪
Entry Strategy: Layered Limit Orders (Sneaky thief-style accumulation)
Trigger: Hull MA CROSS confirmed + Price > 1.16300 🎯
Stop Loss: 1.15100 (Guarding the loot!) 🛡️
Target: 1.18000 (Bank it & bounce!) 💰🔥
🕵️ THIEF TRADER’S BREAKDOWN:
💡 "Weak hands shake, WE TAKE!" – This is a high-probability bullish raid with layered entries for MAXIMUM stealth.
✅ ENTRY TACTICS:
Buy Limit Orders stacked near swing lows (1.16300 zone)
Only trigger AFTER Hull MA confirms bullish flip (No early fomo!)
Scale in like a pro thief – don’t dump all bullets at once.
⚔️ RISK CONTROL (MANDATORY!):
SL at 1.15100 (Break this? ABORT MISSION.)
No revenge trading! Stick to the plan or get caught slippin’.
🎯 PROFIT SECURING:
First TP: 1.18000 (Lock in gains!)
Trailing SL option (If momentum stays strong, let it RUN!)
🚨 THIEF’S WARNING:
⚠️ News = Trap Zone! (Avoid fresh entries during high-impact news)
⚠️ No greed! Secure profits before the market reverses on you.
⚠️ Follow the Hull MA like a shadow – if it flips bearish, RE-EVALUATE!
🔥 SUPPORT THE HEIST!
💥 SMASH THAT LIKE & BOOST BUTTON if you're riding with the Thief Trading Crew!
💬 Comment "🚀 LOADED!" if you're in!
We steal smart, trade sharp, and stack profits like bandits. Stay lethal, traders! 🐱👤💸🔥

EUR/USD Shows Optimism Ahead of Trump–Putin MeetingEUR/USD Shows Optimism Ahead of Trump–Putin Meeting
The meeting between the Presidents of the United States and the Russian Federation, scheduled for today in Alaska, is a major geopolitical event with the potential to exert a significant influence on financial markets.
Expectations are mounting that the talks could lead to a cessation of hostilities in Ukraine – a prospect acting as a bullish factor for the euro. As a result, the EUR/USD chart has been displaying an upward trajectory this week (highlighted by the blue channel).
The blue arrow indicates that:
→ Yesterday’s release of the highest Producer Price Index (PPI) figures in three years triggered a sharp strengthening of the US dollar – possibly because market participants assumed the Federal Reserve might postpone monetary policy easing in light of rising producer prices (widely considered a consequence of Trump’s tariff measures).
→ However, the lower boundary of the upward channel prevented further decline, and today EUR/USD is showing optimism ahead of the presidential meeting.
EUR/USD Technical Analysis
On 7 August, we plotted a descending channel based on the sequence of lower highs and lows formed over the summer.
From the bearish perspective, the price is currently near a cluster of key resistance levels, which include:
→ the upper boundary of the descending (red) channel;
→ the 1.17145 level (a historical price interaction zone, as shown by the arrows on the left side of the chart);
→ the median line of the ascending (blue) channel.
Conversely, the bulls could be supported by:
→ the lower boundary of the blue channel;
→ the aggressive buying momentum evident in the sharp EUR/USD rally on 12 August (highlighted by the orange arrow).
The bullish case is further reinforced by the fact that buyers managed to fully recover from the decline that began on 28 July.
Given the above, we could assume some consolidation today as the market awaits the outcome of the presidential talks. The fact that the ADX indicator is hovering near its lows and trending downward underscores the current indecision and caution in the market.
However, Monday’s open could prove highly volatile. Be prepared for sharp EUR/USD movements in either direction, depending on statements made by the US and Russian leaders.
This article represents the opinion of the Companies operating under the FXOpen brand only. It is not to be construed as an offer, solicitation, or recommendation with respect to products and services provided by the Companies operating under the FXOpen brand, nor is it to be considered financial advice.

EURUSD Pullback Could Present A Buying Opportunity📊 I’m analyzing EURUSD and have observed a recent bullish break of structure on the daily chart 📈. My bias remains to the upside, but with price now stretched after its latest push, I’m watching for a pullback into important value zones. A confirmed bullish break of market structure from these areas could set up a strong long opportunity 🔍💡🚀 (not financial advice).

EURUSDEURUSD also have a correction coming this week before anymore upside.
Disclosure: We are part of Trade Nations Influencer program and receive a monthly fee for using their tradingview charts in our analysis.

EURUSDEURUSD also have correction coming this week before anymore upside.
Disclosure: We are part of Trade Nation's Influencer program and receive a monthly fee for using their TradingView charts in our analysis.

EURUSD - General dynamics and rangesCurrent technical status (Daily/Weekly)
After breaking through the key support at ~1.1445 and then rebounding, EUR/USD is moving up within a steady daily trend, confirmed by the formation of the morning star candlestick pattern, with the short-term target at 1.1800.
The monthly chart shows the development of an upward trend from the October 2025 closing level, with the target of raising prices to 1.1710, but a correction to 1.1588 — the 14.6% Fibonacci retracement level — is possible.
Short-term levels (H1–H4)
Support:
1.1500–1.1480 — the buy zone, from where a reversal has already occurred; the stop level should logically be placed below 1.1440.
Resistance:
1.1600–1.1680 — the near zone, then — 1.1700 and 1.1800 if growth continues.
General dynamics and ranges
The week from August 4 to 8 was characterized by a slowdown in growth, fluctuations in the range of 1.1390–1.1500. The MACD and Stochastic indicators reflect the sellers' momentum, but the oversold situation can provoke a local rebound — growth is possible only with a breakout of 1.1550.
The 1.1650 level is a historically significant barrier. It coincides with the 50% Fibonacci correction and a number of moving averages. Its breakout will open the way to the 1.1700–1.1750 zones. Otherwise, a rollback to 1.1580–1.1530–1.1500 is likely.

EUR/USD Robbery Blueprint Bear Strike Activated!💣🎯Operation Fiber Down: EUR/USD Robbery Blueprint (Day Trade Edition) 💰🔫
🚨 Thieves, Hustlers & Chart Bandits Assemble! 🚨
🌍 Hi! Hola! Ola! Bonjour! Hallo! Marhaba! 🌍
Welcome back to another Thief Trading Operation, where the money never sleeps—and neither do we. Let’s break into the vault of EUR/USD “The Fiber” with surgical precision. 🧠💼🕶️
🧨 THE MASTER ROBBERY PLAN: EUR/USD SHORT STRIKE 🔍💸
💀 Market Bias: Bearish – Trend Reversal + Supply Trap Setup
🎯 Target: 1.14600
🛑 Stop-Loss: Near Swing High (around 1.16700 – 4H chart view)
🕓 Timeframe Focus: 15m / 30m / 3H
🧭 ENTRY ZONE:
👣 Plan your entry from recent high retests—that’s where the big money bulls get trapped.
🎯 Use Sell Limit Orders (DCA style / Layered Limit Orders) like a true thief setting up tripwires.
💼 RISK STRATEGY:
💡 SL should match your lot size and order count—not one-size-fits-all!
📌 Place above key structure or swing level (e.g. 1.16700) based on timeframe.
🔍 BEHIND THE SCENES – THE WHY:
The EUR/USD "Fiber" pair is showing all the classic signs of a trend shift and bear raid setup, including:
📰 Fundamentals weakening the Euro
💣 COT Report reveals institutional exits
🍂 Seasonal Bias points to downward trend
📉 Intermarket Pressure from bond yields & USD strength
📊 Sentiment turning overly bullish = trap zone
⛽ Storage & Inventory imbalances adding fuel
📌 Reminder: Before any robbery, study the layout—Macro, Fundamentals, Sentiment, and Intermarket are your blueprint.
🚨 HEIST ALERT – PROTECT THE LOOT:
🕰️ High-Impact News Events? Tighten up!
💼 Don’t take fresh entries during releases.
🔐 Use Trailing SLs to lock in profits.
🎯 Exit with grace before the sirens start.
⚡🔥JOIN THE CREW, BOOST THE LOOT🔥⚡
💥 Smash the Boost Button 💥 if you're vibing with the Thief Trading Movement.
We ain’t just trading—we’re executing strategic robberies on the market’s weaknesses.
🧠💪 Every like = more power to the crew. Every comment = a new map to a vault.
We rob, retreat, and repeat. Let’s make money with skill, not luck. 🕶️💰🚁
⚠️ LEGAL COVER (For the Lawyers 😏):
This plan is not investment advice, just an organized heist blueprint by chart robbers.
Always manage your own risk and update your plan as the market evolves.
🕶️ Stay ready for the next master plan... Until then, keep your charts clean and your stops tight. 🕶️💣📉
– Thief Trader Out 🐱👤🚀

EURUSD trading range. Top-bottom trading strategy✏️ OANDA:EURUSD surged after Nonfarm data. Formed a wide trading range bounded by 2 trendlines. The market needs more momentum to break out of the range. If there is confirmation at the upper and lower bands, it is a top-bottom trading signal for this pair.
📉 Key Levels
SELL trigger: reject resistance 1.175
BUY trigger: reject support 1.145
Leave your comments on the idea. I am happy to read your views.

EURUSD - Current technical pictureCurrent technical picture
The euro strengthened after weak US employment data and broke above 1.1670, which greatly improved its technical sentiment
The pair is currently testing its 200-hour moving average (≈1.1578) - stability above this level indicates confident interest in the euro
The price has broken the 50% retracement level of the decline from the July 1 high (≈1.16098) and has already reached the 61.8% level (≈1.1661), which previously served as resistance in mid-July

EUR/USD Rises 2.3% Since the Beginning of AugustEUR/USD Rises 2.3% Since the Beginning of August
As the EUR/USD chart shows today, the euro has strengthened against the US dollar, climbing above the 1.1670 level, compared to the 1.1400 area at the beginning of the month.
Why Is EUR/USD Rising?
According to Reuters, the US dollar's weakness is being driven by:
→ Expectations of a Federal Reserve rate cut, which intensified following last week's disappointing US labour market data.
→ Anticipation of the upcoming US inflation report, scheduled for release on 12 August at 15:30 GMT+3.
On the other hand, the euro is being supported by growing optimism around a possible resolution of the military conflict in Ukraine, as well as the potential meeting between Donald Trump and Vladimir Putin.
Technical Analysis of the EUR/USD Chart
On 30 July, we noted that after hitting its July low, EUR/USD could stage a recovery — which indeed materialised. But does the chart now look bullish?
A definitive bullish outlook is hindered by the sequence of lower highs and lower lows (A-B-C-D), which continues to form a bearish market structure.
At the same time, the descending channel on the EUR/USD chart has become more pronounced. After a brief period of consolidation near the channel’s median line (marked with a circle), the price moved up towards the upper boundary of the channel. It is worth noting that a sharp decline occurred recently from these same levels (highlighted with an arrow), breaking through the blue support line.
Given these factors, it is reasonable to assume that bearish activity may intensify around current levels, potentially slowing further EUR/USD growth.
This article represents the opinion of the Companies operating under the FXOpen brand only. It is not to be construed as an offer, solicitation, or recommendation with respect to products and services provided by the Companies operating under the FXOpen brand, nor is it to be considered financial advice.
