EURUSD Bears Regain Control as Dollar Strength Holds FirmEURUSD is showing fresh signs of exhaustion after its recent bounce, struggling to hold momentum against a resilient U.S. dollar. Price action has rejected trendline resistance and is now threatening to extend lower toward key demand zones. With the ECB battling slowing growth while the Fed remains cautious but firm, EURUSD faces mounting pressure to the downside.
Current Bias
Bearish – rejection at resistance keeps the pair vulnerable to further downside toward 1.1600 and potentially 1.1410.
Key Fundamental Drivers
U.S. dollar demand supported by safe-haven flows and relatively strong U.S. economic data.
ECB’s dovish tilt as growth falters in the Eurozone, limiting scope for additional rate hikes.
Differentials in monetary policy continue to favor the USD over the EUR in the medium term.
Macro Context
Interest rate expectations: The Fed is expected to keep rates higher for longer, maintaining a hawkish edge, while the ECB faces pressure to slow policy tightening given weak Eurozone growth.
Economic growth: U.S. growth remains more resilient than Europe’s, with Eurozone industrial and consumer sectors showing signs of fatigue.
Commodity flows: Lower European energy demand and potential disruptions in global gas/oil trade leave the euro vulnerable.
Geopolitical themes: Trade tariffs, global slowdown risks, and U.S.–EU policy divergence all weigh on the single currency.
Primary Risk to the Trend
A surprise hawkish shift from the ECB or softer-than-expected U.S. data could reignite EUR upside momentum and squeeze shorts.
Most Critical Upcoming News/Event
ECB policy meeting minutes (guidance on growth vs. inflation trade-off)
U.S. PMI & jobless claims (gauging the Fed’s stance on growth resilience)
Leader/Lagger Dynamics
EURUSD is a leader pair in the FX market, often dictating overall USD sentiment.
Movements here influence correlated assets such as DXY, gold, and EUR-crosses like EURJPY and EURNZD.
Key Levels
Support Levels: 1.1606, 1.1410
Resistance Levels: 1.1710, 1.1797
Stop Loss (SL): 1.1800
Take Profit (TP): 1.1606 (first target), 1.1410 (extended target)
Summary: Bias and Watchpoints
EURUSD continues to lean bearish, with rejection from resistance and a weakening Eurozone macro backdrop providing downside pressure. The bias favors further losses toward 1.1606, with extended downside into the 1.1410 region if bearish momentum accelerates. A stop loss above 1.1800 provides protection against a breakout reversal. Traders should closely monitor ECB commentary and U.S. data releases, as any divergence from expectations could quickly shift momentum. Until then, the path of least resistance remains to the downside.
Eurusdupdate

EURUSD – DAILY FORECAST Q3 | W34 | D22 | Y25📊 EURUSD – DAILY FORECAST
Q3 | W34 | D22 | Y25
Daily Forecast 🔍📅
Here’s a short diagnosis of the current chart setup 🧠📈
Higher time frame order blocks have been identified — these are our patient points of interest 🎯🧭.
It’s crucial to wait for a confirmed break of structure 🧱✅ before forming a directional bias.
This keeps us disciplined and aligned with what price action is truly telling us.
📈 Risk Management Protocols
🔑 Core principles:
Max 1% risk per trade
Only execute at pre-identified levels
Use alerts, not emotion
Stick to your RR plan — minimum 1:2
🧠 You’re not paid for how many trades you take, you’re paid for how well you manage risk.
🧠 Weekly FRGNT Insight
"Trade what the market gives, not what your ego wants."
Stay mechanical. Stay focused. Let the probabilities work.
FX:EURUSD

EURUSD Weekly Forecast – Q3 | W35 | Y25
📊 EURUSD – WEEKLY FORECAST
📈 EURUSD Weekly Forecast – Q3 | W35 | Y25
Much like other USD-cross pairs, EUR/USD ended the week strongly bullish, with the weekly candle closing above the weekly 50 EMA.
This close shifts the higher time frame bias toward long-term buy positions, in line with broader dollar weakness.
🔍 Forecast & Strategy:
Despite the bullish weekly close, I’m anticipating a retracement early in the week — specifically a pullback into the daily imbalance created by Friday’s strong move.
📍 Below that imbalance, there’s a daily order block that aligns with:
The daily 50 EMA
Mid-range and lower-range points of interest
This confluence zone becomes a key area to look for long executions, provided the market gives us confirmation.
🎯 Execution Plan:
Once price enters these zones (both short- and long-term POIs):
Look for a clear Break of Structure (BOS) on the 5M or 15M timeframes before executing.
No BOS = no entry.
📉 Short-Term Shorts – With Caution:
If price offers valid short setups from current highs, target areas will include:
The daily imbalance (first target & partial TP zone)
The daily 50 EMA and the daily order block (final TP and long re-entry zone)
Important: All short positions should be managed aggressively and fully closed by the time price reaches the bullish POI, as the higher time frame bias favors longs.
✅ Bias: Bullish (Higher Time Frame)
⚠️ Shorts are counter-trend and must be managed accordingly
📌 Wait for confirmation before executing either side
Let’s stay patient, let structure lead, and execute only when the market tells us it’s time.
FRGNT
FX:EURUSD

EURUSD shows a bullish rebound after Powell's speechCurrent technical picture
The EUR/USD pair showed a bullish rebound after Powell's speech at the Jackson Hole forum, which weakened the USD - DXY fell by 0.9%, which adds support to the euro. Thus, a double top was formed at 1.1800 and strong support at 1.1600. As a result, the weekly candle was almost unchanged.
FXStreet notes a stable bullish momentum - after a fall to 1.1583, the euro recovered above 1.1700 against the backdrop of a weak dollar.
The analysis shows that the fall to 1.1582 stopped the decline, and the current breakout of the 1.1729 level indicates a continuation of the upward movement. Focus is on the retest of 1.1819. As long as the 1.1582 level holds, the advantage remains with buyers.

EURUSD BUYSM; bullish trending market
w; break of a consolidation zone / making a new structure of HH and HL / BOS / between 0.5 FIB and 0.681 fib / the weekly agrees with the monthly, both in a bullish trend
D; bullish candlestick at weekly key level
4h; wait for price to tap into / MARKET SHIFT HL/retest entry
1h; waiting for 1h bullish engulfing at 4h demand zone / look for mini structure
fundamental:
Monday no news

EURUSD Epic Bearish Breakout!
HI,Traders !
#EURUSD made an epic
Bearish breakout of a very
Strong key horizontal level
Of 1.16304 which is now a
Resistance and the breakout
Is confirmed so we are
Bearish biased and we will
Be expecting a further
Bearish move down !
Comment and subscribe to help us grow !

EUR/USD Holding Above 1.1600 — Outlook Remains BullishHi Everyone,
As highlighted in our previous idea, EUR/USD continues to correct above the 1.16000 zone, which could potentially set the stage for a renewed push higher toward the 1.17889 level. Should price extend lower in search of further demand, the next key area of interest sits around 1.15200, where we anticipate strong buying interest to step in.
The impulsive rally from the 1st August low continues to reinforce our bullish outlook on EUR/USD, and upcoming headlines in what looks to be a decisive week could provide the catalyst for the Fiber to press higher.
Our broader outlook remains unchanged: we continue to expect the pair to build momentum for another leg to the upside. A decisive break above 1.17889 would open the path toward the 1.18350–1.19290 area and ultimately the 1.20000 handle.
We’ll be monitoring price action closely to see whether this recovery gains traction and if buyers can sustain momentum through resistance. The longer-term outlook remains bullish, provided price continues to hold above the key support zone.
We’ll keep you updated throughout the week as the structure unfolds and share how we’re managing our active positions.
Thanks again for all the likes, boosts, comments, and follows — your support is truly appreciated!
All the best for the rest of the week.
Trade safe.
BluetonaFX

Market Analysis: EUR/USD Dips AgainMarket Analysis: EUR/USD Dips Again
EUR/USD declined from 1.1720 and traded below 1.1650.
Important Takeaways for EUR/USD Analysis Today
- The Euro started a fresh decline after a decent move above 1.1680.
- There was a break below a key bullish trend line with support at 1.1650 on the hourly chart of EUR/USD.
EUR/USD Technical Analysis
On the hourly chart of EUR/USD, the pair rallied above the 1.1680 resistance zone before the bears appeared, as discussed in the previous analysis. The Euro started a fresh decline and traded below 1.1660 against the US Dollar.
There was a break below a key bullish trend line with support at 1.1650, and a low was formed near 1.1622. After that, the pair started a consolidation phase.
There was a minor recovery wave above 1.1630. EUR/USD is now trading below 1.1650 and the 50-hour simple moving average. On the upside, the pair is now facing hurdles near the 23.6% Fib retracement level of the downward move from the 1.1692 swing high to the 1.1622 low at 1.1640.
The next key resistance is 1.1655 and the 50% Fib retracement. The main barrier for the bulls could be 1.1665. A clear move above 1.1665 could send the pair toward 1.1690. An upside break above 1.1690 could set the pace for another increase. In the stated case, the pair might rise toward the 1.1720 zone.
If not, the pair might resume its decline. The first major support on the EUR/USD chart is near 1.1620. The next important region for buyers sits at 1.1600. If there is a downside break below 1.1600, the pair could drop toward 1.1550. Any more losses might send the pair toward 1.1500.
This article represents the opinion of the Companies operating under the FXOpen brand only. It is not to be construed as an offer, solicitation, or recommendation with respect to products and services provided by the Companies operating under the FXOpen brand, nor is it to be considered financial advice.

EUR/USD Shows Optimism Ahead of Trump–Putin MeetingEUR/USD Shows Optimism Ahead of Trump–Putin Meeting
The meeting between the Presidents of the United States and the Russian Federation, scheduled for today in Alaska, is a major geopolitical event with the potential to exert a significant influence on financial markets.
Expectations are mounting that the talks could lead to a cessation of hostilities in Ukraine – a prospect acting as a bullish factor for the euro. As a result, the EUR/USD chart has been displaying an upward trajectory this week (highlighted by the blue channel).
The blue arrow indicates that:
→ Yesterday’s release of the highest Producer Price Index (PPI) figures in three years triggered a sharp strengthening of the US dollar – possibly because market participants assumed the Federal Reserve might postpone monetary policy easing in light of rising producer prices (widely considered a consequence of Trump’s tariff measures).
→ However, the lower boundary of the upward channel prevented further decline, and today EUR/USD is showing optimism ahead of the presidential meeting.
EUR/USD Technical Analysis
On 7 August, we plotted a descending channel based on the sequence of lower highs and lows formed over the summer.
From the bearish perspective, the price is currently near a cluster of key resistance levels, which include:
→ the upper boundary of the descending (red) channel;
→ the 1.17145 level (a historical price interaction zone, as shown by the arrows on the left side of the chart);
→ the median line of the ascending (blue) channel.
Conversely, the bulls could be supported by:
→ the lower boundary of the blue channel;
→ the aggressive buying momentum evident in the sharp EUR/USD rally on 12 August (highlighted by the orange arrow).
The bullish case is further reinforced by the fact that buyers managed to fully recover from the decline that began on 28 July.
Given the above, we could assume some consolidation today as the market awaits the outcome of the presidential talks. The fact that the ADX indicator is hovering near its lows and trending downward underscores the current indecision and caution in the market.
However, Monday’s open could prove highly volatile. Be prepared for sharp EUR/USD movements in either direction, depending on statements made by the US and Russian leaders.
This article represents the opinion of the Companies operating under the FXOpen brand only. It is not to be construed as an offer, solicitation, or recommendation with respect to products and services provided by the Companies operating under the FXOpen brand, nor is it to be considered financial advice.

EURUSD - General dynamics and rangesCurrent technical status (Daily/Weekly)
After breaking through the key support at ~1.1445 and then rebounding, EUR/USD is moving up within a steady daily trend, confirmed by the formation of the morning star candlestick pattern, with the short-term target at 1.1800.
The monthly chart shows the development of an upward trend from the October 2025 closing level, with the target of raising prices to 1.1710, but a correction to 1.1588 — the 14.6% Fibonacci retracement level — is possible.
Short-term levels (H1–H4)
Support:
1.1500–1.1480 — the buy zone, from where a reversal has already occurred; the stop level should logically be placed below 1.1440.
Resistance:
1.1600–1.1680 — the near zone, then — 1.1700 and 1.1800 if growth continues.
General dynamics and ranges
The week from August 4 to 8 was characterized by a slowdown in growth, fluctuations in the range of 1.1390–1.1500. The MACD and Stochastic indicators reflect the sellers' momentum, but the oversold situation can provoke a local rebound — growth is possible only with a breakout of 1.1550.
The 1.1650 level is a historically significant barrier. It coincides with the 50% Fibonacci correction and a number of moving averages. Its breakout will open the way to the 1.1700–1.1750 zones. Otherwise, a rollback to 1.1580–1.1530–1.1500 is likely.

EURUSD trading range. Top-bottom trading strategy✏️ OANDA:EURUSD surged after Nonfarm data. Formed a wide trading range bounded by 2 trendlines. The market needs more momentum to break out of the range. If there is confirmation at the upper and lower bands, it is a top-bottom trading signal for this pair.
📉 Key Levels
SELL trigger: reject resistance 1.175
BUY trigger: reject support 1.145
Leave your comments on the idea. I am happy to read your views.

EURUSD - Current technical pictureCurrent technical picture
The euro strengthened after weak US employment data and broke above 1.1670, which greatly improved its technical sentiment
The pair is currently testing its 200-hour moving average (≈1.1578) - stability above this level indicates confident interest in the euro
The price has broken the 50% retracement level of the decline from the July 1 high (≈1.16098) and has already reached the 61.8% level (≈1.1661), which previously served as resistance in mid-July

EUR/USD Rises 2.3% Since the Beginning of AugustEUR/USD Rises 2.3% Since the Beginning of August
As the EUR/USD chart shows today, the euro has strengthened against the US dollar, climbing above the 1.1670 level, compared to the 1.1400 area at the beginning of the month.
Why Is EUR/USD Rising?
According to Reuters, the US dollar's weakness is being driven by:
→ Expectations of a Federal Reserve rate cut, which intensified following last week's disappointing US labour market data.
→ Anticipation of the upcoming US inflation report, scheduled for release on 12 August at 15:30 GMT+3.
On the other hand, the euro is being supported by growing optimism around a possible resolution of the military conflict in Ukraine, as well as the potential meeting between Donald Trump and Vladimir Putin.
Technical Analysis of the EUR/USD Chart
On 30 July, we noted that after hitting its July low, EUR/USD could stage a recovery — which indeed materialised. But does the chart now look bullish?
A definitive bullish outlook is hindered by the sequence of lower highs and lower lows (A-B-C-D), which continues to form a bearish market structure.
At the same time, the descending channel on the EUR/USD chart has become more pronounced. After a brief period of consolidation near the channel’s median line (marked with a circle), the price moved up towards the upper boundary of the channel. It is worth noting that a sharp decline occurred recently from these same levels (highlighted with an arrow), breaking through the blue support line.
Given these factors, it is reasonable to assume that bearish activity may intensify around current levels, potentially slowing further EUR/USD growth.
This article represents the opinion of the Companies operating under the FXOpen brand only. It is not to be construed as an offer, solicitation, or recommendation with respect to products and services provided by the Companies operating under the FXOpen brand, nor is it to be considered financial advice.

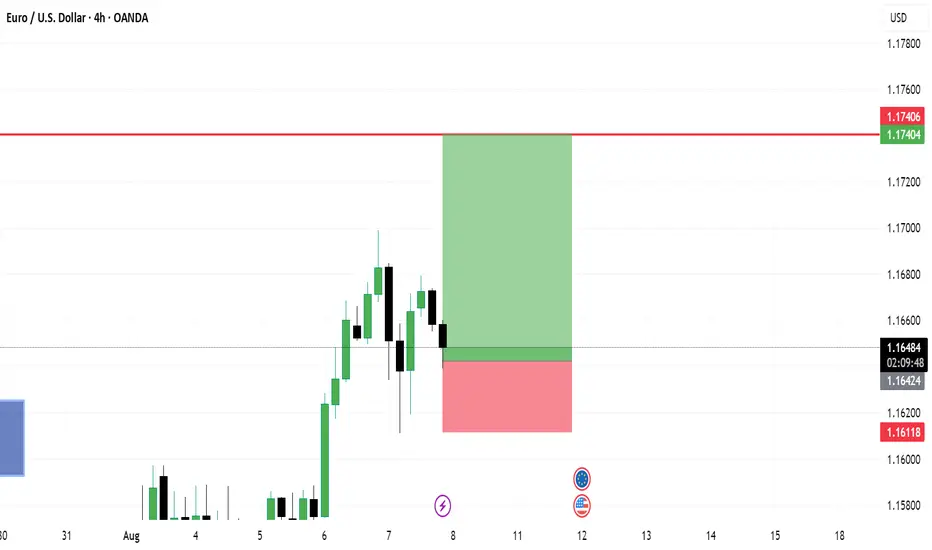
EURUSD – Critical Zone AheadBack on June 29, I shared a buy idea on EURUSD (tagged below this post).
Due to a busy schedule, I couldn't post an update—but as you can see, price reacted to my marked zone, did a quick stop-hunt, and moved up strongly.
Now, the current zone marked on the chart is a potential short area,
but again—we don’t tell the market what to do. We follow it.
📌 If the level breaks upward, we’ll wait for a pullback to go long.
If a valid short signal shows up, we’ll go short.
🔁 Anything can happen—this is why I always remind traders:
Don’t stand in front of the market.
Those who do… often end up like sardines eaten by the whales 🐋—liquidated and out of capital.
Let the market choose the direction, and we simply follow.
📈 Stay flexible. Stay humble. Stay profitable.

EURUSD Bearish Breakout !
HI,Traders !
#EURUSD was trading along
The rising support line but
Now we are seeing a bearish
Breakout so we are bearish
Biased and we will be expecting
A further bearish move down !
Comment and subscribe to help us grow !

EUR/USD Hits Lowest Level Since Early JulyEUR/USD Hits Lowest Level Since Early July
As the EUR/USD chart indicates today, the euro has fallen below the 1.1550 mark against the US dollar, reaching the lows of June 2025. As a result, July may become the first month in 2025 to record a decline in the currency pair.
Why Is EUR/USD Declining?
There are two key factors driving the euro’s weakness relative to the US dollar:
→ Anticipation of the Federal Reserve Meeting. At 21:00 GMT+3 today, the Fed’s interest rate decision will be released. According to Forex Factory, analysts expect the Federal Funds Rate to remain unchanged at 4.25%-4.50%.
→ Market Reaction to the US-EU Trade Agreement. The trade deal signed last weekend between the United States and Europe is being critically assessed by market participants.
As noted in our Monday analysis, signs of a bearish takeover emerged on the chart following the agreement’s signing. Since then, EUR/USD has declined by approximately 1.3%. The question now is whether the downtrend will continue.
Technical Analysis of the EUR/USD Chart
The upward channel that had remained valid since mid-May was decisively broken by bears this week. The nature of the breakout (highlighted by the red arrow) was particularly aggressive, with the price dropping from the 1.1710 level to the D point low without any meaningful interim recoveries.
Key observations include:
→ The drop has resulted in a classic bearish A-B-C-D market structure, characterised by lower highs and lower lows.
→ On the 4-hour timeframe, the RSI indicator has fallen into oversold territory, reaching its lowest point of 2025 so far.
→ Notably (as highlighted by the blue arrow), there was a strong rebound from the 1.1455 support level earlier. Bulls demonstrated significant strength at that time, breaking through the R resistance line.
Given these factors, we could assume that after this week’s sharp decline, EUR/USD may attempt a short-term recovery from the support zone (highlighted in purple). Should this scenario unfold, potential resistance may emerge near the 1.1630 level, as this area aligns with:
→ The 50% Fibonacci retracement of the C→D decline;
→ The breakout point of the lower boundary of the previous ascending channel, indicating a shift in market balance in favour of the bears.
This article represents the opinion of the Companies operating under the FXOpen brand only. It is not to be construed as an offer, solicitation, or recommendation with respect to products and services provided by the Companies operating under the FXOpen brand, nor is it to be considered financial advice.

Market Analysis: EUR/USD Dips FurtherMarket Analysis: EUR/USD Dips Further
EUR/USD extended losses and traded below the 1.1600 support.
Important Takeaways for EUR/USD Analysis Today
- The Euro struggled to clear the 1.1800 resistance and declined against the US Dollar.
- There is a key downward channel forming with resistance at 1.1575 on the hourly chart of EUR/USD.
EUR/USD Technical Analysis
On the hourly chart of EUR/USD at FXOpen, the pair failed to clear the 1.1800 resistance. The Euro started a fresh decline below the 1.1720 support against the US Dollar.
The pair declined below the 1.1660 support and the 50-hour simple moving average. Finally, it tested the 1.1520 level. A low was formed at 1.1519 and the pair is now consolidating losses. The market is showing bearish signs, and the upsides might remain capped.
There was a minor increase toward the 23.6% Fib retracement level of the downward move from the 1.1770 swing high to the 1.1519 low. Immediate resistance on the upside is near the 1.1575 level.
There is also a key downward channel forming with resistance at 1.1575. The next major resistance is near the 1.1665 zone and the 50-hour simple moving average or the 50% Fib retracement level.
The main resistance sits near the 1.1770 level. An upside break above the 1.1770 level might send the pair towards 1.1800. Any more gains might open the doors for a move towards 1.1850.
On the downside, immediate support on the EUR/USD chart is seen near 1.1520. The next major support is near the 1.1465 level. A downside break below 1.1465 could send the pair towards 1.1350.
This article represents the opinion of the Companies operating under the FXOpen brand only. It is not to be construed as an offer, solicitation, or recommendation with respect to products and services provided by the Companies operating under the FXOpen brand, nor is it to be considered financial advice.

EUR/USD: Is the Next Big Correction Already Underway?EUR/USD: After 120 Days Up, Are We Entering a Year-Long Correction? What Market Cycles Reveal.
As EUR/USD traders digest the stunning 120-day, five-wave rally from the January 2025 lows to the July 2025 highs, the big question now is—what's next? The clues are right in front of us, and they suggest we may be headed into an extended corrective phase, one that could last until the very start of 2026.
What the Current Structure Shows
Motive Wave Complete: The impulsive surge just wrapped up a textbook five-wave move, with each leg unfolding cleanly and culminating in a July top. Motive waves like this are the engines of market trends—fast-moving, decisive, and packed with momentum.
Corrective Phase Incoming: But all trends eventually pause, and here the evidence points to a shift. Corrective waves—unlike their trending counterparts—are time-consuming, choppy, and have a tendency to frustrate impatient traders. The completed motive wave took just 120 days, but corrections often take much longer to play out. According to this chart, the probable timeline for this correction extends into December 2025, or possibly beyond.
Why the Count Is Labelled This Way
Wave Duration Clue: One of the most reliable Elliott Wave principles is that corrective phases outlast the sharp, high-energy motive moves that precede them. With the motive wave spanning four months, a comparable correction stretching into late 2025 makes perfect structural sense.
Cycle Awareness, Major Turning Points, and MACD Divergence:
Flip to the weekly turning points chart, and a deeper pattern emerges: Major EUR/USD direction changes consistently cluster around the start of a new year, with minor tops and bottoms often forming near mid-year. Over the last eight years, six out of seven major pivots have landed at those cycle pivots.
Notably, if you look at the weekly chart’s MACD, there’s now a clear bearish divergence—while price clocked new highs into July, the MACD failed to confirm, rolling over and diverging lower. This kind of momentum divergence at a major turning point is classic for trend exhaustion and aligns perfectly with the idea that a correction is not only likely, but perhaps overdue.
This powerful confluence—timing, price structure, and momentum—underscores just how much “cycle” and structure awareness can add to your trading playbook.
What to Watch Next (Trade Planning)
Timing the Correction: If the correction follows historical precedent, expect sideways or choppy price action well into Q4 2025, with the next big directional opportunity around the calendar turn into 2026.
Cycle-Based Strategies: Recognising these cycles lets you prepare for reversals, especially if price is diverging from the MACD at those major timing windows.
Structure > Prediction: The motive phase is where you ride the trend; cycles, structure, and momentum help you avoid exhaustion traps and see when patience is required.

Europe and the US Sign Trade Agreement, EUR/USD DeclinesEurope and the US Sign Trade Agreement, EUR/USD Declines
The past weekend was marked by the official signing of a trade agreement between the United States and Europe, as announced by US President Donald Trump and President of the European Commission Ursula von der Leyen following their meeting in Scotland.
According to reports, the agreement is based on a 15% baseline tariff on goods exported from Europe to the United States, with certain exemptions. As previously reported, a trade agreement with a 15% baseline tariff had earlier been concluded between the US and Japan.
According to President Trump:
→ under no circumstances did he allow the baseline tariff for Europe to fall below 15%;
→ the European Union committed to investing in the US economy, purchasing weapons, and importing energy resources.
The financial markets’ reaction to this news is noteworthy:
→ European stock indices opened the week with a bullish gap, reflecting relief that previously feared tariffs of up to 30% did not materialise;
→ the EUR/USD pair is exhibiting bearish momentum this morning.
Technical Analysis of the EUR/USD Chart
As indicated by the black arrow, bearish sentiment intensified on Monday morning, pushing the pair towards the 1.1700 level, which had previously acted as resistance in mid-July.
From the perspective of the ascending channel (shown in blue), its median line is currently acting as a resistance level – following contact with it, a short-term rally was broken (highlighted in purple). This reinforces the notion that bears are currently in control.
Given the above, we could suggest that, should bearish sentiment persist on the EUR/USD chart, we may soon witness an attempt to break through the 1.1700 support level. A successful breach could open the path for further downside movement of the euro against the dollar, towards the lower boundary of the channel.
This article represents the opinion of the Companies operating under the FXOpen brand only. It is not to be construed as an offer, solicitation, or recommendation with respect to products and services provided by the Companies operating under the FXOpen brand, nor is it to be considered financial advice.

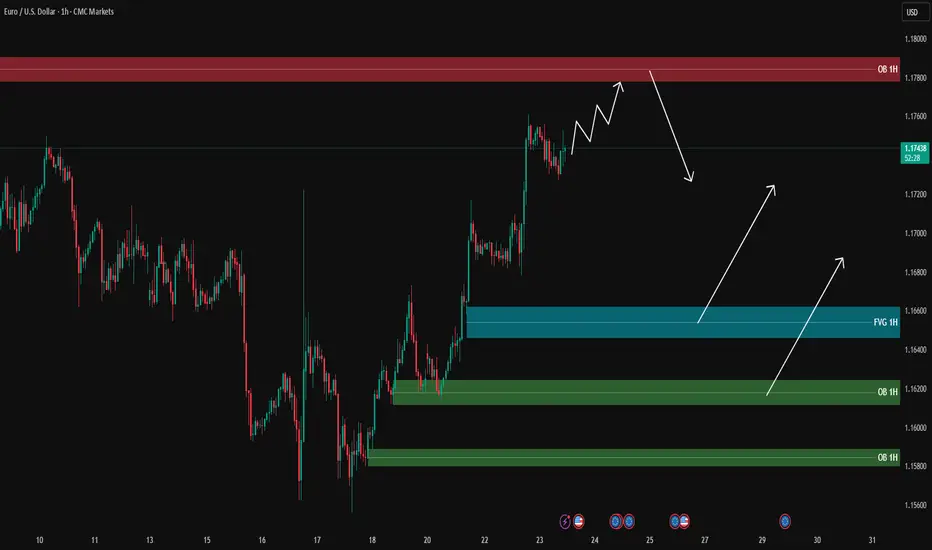
EURUSD analysis - 1H FVG and OB setupsOn the 1H timeframe, price is moving strongly towards the 1H supply zone (around 1.1780), and it is likely to reach this area first before pulling back.
During the pullback, the blue FVG and green OB zones below are key areas for potential long entries:
🔹 FVG 1H around 1.1660
🔹 OB 1H around 1.1620
🔹 OB 1H around 1.1580
📌 Plan:
1️⃣ If the price reaches the upper supply zone, we will look for short scalps with confirmation on the lower timeframe (5M/3M).
2️⃣ After the pullback to lower zones, we will look for long opportunities with PA confirmation.
🎯 Long targets after pullback: 1.1700 – 1.1720, potentially 1.1750.
❌ No entry without confirmation.
EUR/USD Short from the nearby 1hrI’m currently more confident in EU’s bearish setup compared to GU, as price is nearing a clear point of interest (POI) that aligns well with the developing downtrend. The 2hr supply zone has already caused a CHoCH (Change of Character), and price has been approaching it slowly and with reduced momentum — often a strong indication of an upcoming reaction.
While price isn’t near a demand zone yet, I’ll be keeping an eye on the 7hr demand zone below. If price reaches that area, I’ll be looking for a high-probability buy setup in line with the broader market context.
Confluences for EU Sells:
Price has tapped into a 2hr supply zone that caused a CHoCH to the downside
Bearish pressure remains strong, supported by DXY strength
Clean liquidity to the downside that needs to be swept
Slowing momentum and signs of distribution as price approaches supply
P.S. If price continues lower from this point, I anticipate another break of structure, which could form a new supply zone to work with later this week.
Let’s stay patient, follow the flow, and execute smart. 🔥📉💼

EURUSD Massive Bullish Breakout!
HI,Traders !
#EURUSD is trading in a strong
Uptrend and the price just
Made a massive bullish
Breakout of the falling
Resistance line and the
Breakout is confirmed
So after a potential pullback
We will be expecting a
Further bullish continuation !
Comment and subscribe to help us grow !
