How to Trade Morning Star and Evening Star Candlestick Patterns Learn to identify and trade Morning Star and Evening Star candlestick formations using TradingView’s charting tools in this detailed tutorial from Optimus Futures.
Morning and Evening Stars are powerful reversal patterns that often mark turning points in the market. Recognizing them can help you anticipate when momentum is about to shift—and take advantage of new trading opportunities.
What You’ll Learn:
• How Morning Stars signal bullish reversals at the end of a downtrend
• How Evening Stars indicate bearish reversals after extended uptrends
• The three-candle structure of each pattern and what it means for trader psychology
• Why indecision candles (like dojis) play a critical role in confirming momentum shifts
• Using volume confirmation to validate Morning and Evening Star setups
• The importance of context: spotting these patterns at major support and resistance levels
• Setting effective stop losses at the high/low of the pattern for risk control
• Advanced entry tactic: waiting for retracement after confirmation to optimize risk/reward
This tutorial may help futures traders and technical analysts who want to harness candlestick reversal signals to identify potential market turning points.
The strategies covered could assist you in creating structured setups when strong buying or selling pressure appears at key chart levels.
Learn more about futures trading with TradingView:
optimusfutures.com
Disclaimer:
There is a substantial risk of loss in futures trading. Past performance is not indicative of future results. Please trade only with risk capital. We are not responsible for any third-party links, comments, or content shared on TradingView. Any opinions, links, or messages posted by users on TradingView do not represent our views or recommendations. Please exercise your own judgment and due diligence when engaging with any external content or user commentary.
This video represents the opinion of Optimus Futures and is intended for educational purposes only. Chart interpretations are presented solely to illustrate objective technical concepts and should not be viewed as predictive of future market behavior. In our opinion, charts are analytical tools—not forecasting instruments. Market conditions are constantly evolving, and all trading decisions should be made independently, with careful consideration of individual risk tolerance and financial objective
Evening Star

What Is the Evening Star Candlestick Pattern?What Is the Evening Star Candlestick Pattern?
Candlestick patterns offer traders a way to read price action and spot potential changes in momentum. One notable pattern is the evening star, a three-candle formation that signals the start of a possible downtrend. This article breaks down what the evening star looks like, how it works, and how traders typically use it.
What Is the Evening Star Candlestick Pattern?
The evening star is a three-candle pattern that traders watch for after a strong upward move. It’s considered a bearish reversal pattern, signalling that bullish momentum is fading. The setup consists of three candles:
- The first candle is a large bullish candle—it shows a clear upward direction.
- The second is much smaller. This middle candle—the star—reflects hesitation. Buyers and sellers are more balanced, and the market’s pace slows.
- The third candle acts as confirmation. It’s a solid bearish candle that closes deep into the body of the first.
The middle candle also often gaps up from the first, especially in stocks or indices, but gaps aren’t essential. What matters is the sequence: strength, indecision, reversal. The further the final candle closes into the body of the first, the stronger the pattern is considered.
Evening stars can appear on any timeframe, but many traders look for them on the daily chart where the signals tend to be clearer. It’s not a pattern to act on blindly—but in the right context, such as after a sustained bullish trend, it’s a useful sign that buyers might be losing control.
The Psychology Behind the Evening Star
It may be always useful to frame the formations like the evening star candle pattern in the context of market psychology.
Here, the first bullish candle signals buyer confidence. They drive prices higher and the candle closes strongly. The next candle is smaller, suggesting that momentum is slowing. Buyers aren’t pushing as hard, and sellers start to step in.
When the third candle closes strongly bearish, it confirms that sentiment is changing. Sellers are now in control, and previous buying strength fades. This shift often happens at the end of an extended upward movement, where fewer buyers are willing to bid the price up and begin closing positions.
How Traders May Use the Evening Star Candlestick Formation
The evening star may be a useful part of a trader’s toolkit, especially when it lines up with other pieces of analysis.
Opening and Closing a Trade
The evening star pattern candlesticks become more meaningful when they appear around known areas of resistance or previous swing highs. If the market’s been edging closer to a clear level—like a horizontal resistance line, Fibonacci retracement, or trendline—and then an evening star forms, it can add weight to the idea that the rally is weakening. Some traders also watch for patterns forming near round numbers or psychological price points.
If traders notice an evening star pattern occurring at a resistance level, they typically look for confluence using another indicator. The RSI might signal a bearish divergence, the price may be piercing an upper Bollinger Band, or it could also be bouncing from a 200-period EMA. Volume can be another factor—rising volume on the third candle can signal more participation behind the selling.
Once a trader has confidence that a bearish reversal is likely underway, they often use the candles following the third candlestick as an entry trigger. A stop loss might be set above the middle candle’s high, while take-profit targets might be placed at an area where a bullish reversal might occur, like a support level. Some might simply trail a stop to take advantage of the strong downtrend or exit when an indicator/candlestick pattern signals that bearish momentum is fading.
Marking Potential Trend Shifts
Some traders use the evening star to flag potential trend exhaustion. While they may not act on the signal (e.g. they are bullish overall and not willing to take shorts yet), the presence of an evening star can suggest the uptrend is vulnerable. They may prepare to buy a pullback, partially close an existing long position, or start watching for further bearish signals.
Example Trades
In the example above, we see a slight rally in AUD/USD in a broader downtrend (off-screen). Price initially pierces the upper Bollinger Band, with slight rejections visible in the upper wicks. After a brief dip, the market retests highs and finds resistance. At this point, the pattern forms, with confirmation coming from relatively weak candles afterwards. Price then closes through the midline of the Bollinger Bands, providing full confirmation of a bearish reversal.
In this second example, we can see a failed evening star. Here, Amazon (AMZN) gaps up over two consecutive days. That leads the 50-period EMA to slope up and cross above its 200-period counterpart—a clear bullish signal.
In this context, it may be better to ignore the signal. The market continues to move higher in an uptrend with consecutive bullish gaps, confirmed by the EMA crossover, indicating a lower probability the pattern will work successfully. Like any pattern, the evening star is expected to be more reliable when contextual factors align, such as in the AUD/USD example.
Strengths and Limitations of the Evening Star
The evening star has its strengths and limitations. To rely on the evening star in trading, it’s worth being aware of both sides.
Strengths
- Clear visual structure: The three-candle formation is straightforward, especially on higher timeframes.
- Logical: The pattern reflects an evident change in momentum that shifts from buying to selling pressure.
- Useful in a wider toolkit: When combined with other forms of analysis (resistance levels, overbought signals, strong volume), it can help traders pinpoint potential turning points and offer an entry.
Limitations
- Requires confirmation: On its own, the pattern doesn’t confirm a downtrend. It’s a potential signal, but not a guarantee.
- Less reliable in choppy markets: In sideways or low-volume markets, evening stars usually produce false signals.
- Subject to interpretation: Candle size, wicks, and placement can vary, which means not every setup is clean or tradable.
The Bottom Line
The evening star pattern offers traders a structured way to identify potential turning points in the market. Its three-candle formation makes it popular among those seeking greater confirmation than single-candle patterns.
FAQ
What Does an Evening Star Candle Pattern Mean?
It’s a three-candle formation that appears at the end of a solid uptrend. An evening star in trading indicates a potential bearish reversal or a short-term downward movement depending on market conditions and the timeframe used.
Is the Evening Star Bullish or Bearish?
The evening star is considered a bearish pattern that shows buyer exhaustion. A third long bearish candle reflects a change in the market sentiment.
How Do an Evening Star and a Hanging Man Differ?
The evening star is a three-candle pattern showing a gradual change in momentum. The hanging man is a single-candle pattern, with a small body and long lower wick. Both are bearish reversal signals, but the hanging man typically requires greater confirmation.
How Do a Shooting Star and an Evening Star Differ?
The shooting star is a one-candle pattern with a long upper wick and a small body that signals rejection at higher prices. The evening star is a three-candle pattern. Both formations reflect a shift from bullish to bearish sentiment.
This article represents the opinion of the Companies operating under the FXOpen brand only. It is not to be construed as an offer, solicitation, or recommendation with respect to products and services provided by the Companies operating under the FXOpen brand, nor is it to be considered financial advice.
#TAOUSDT #4h (ByBit) Ascending trendline near breakdownBittensor printed an evening doji star deviation, a retracement down to 200 MA support seems next.
⚡️⚡️ #TAO/USDT ⚡️⚡️
Exchanges: ByBit USDT
Signal Type: Regular (Short)
Leverage: Isolated (5.0X)
Amount: 5.0%
Entry Targets:
1) 430.38
Take-Profit Targets:
1) 362.01
Stop Targets:
1) 464.64
Published By: @Zblaba
GETTEX:TAO BYBIT:TAOUSDT.P #4h #Bittensor #AI #DePIN bittensor.com
Risk/Reward= 1:2.0
Expected Profit= +79.4%
Possible Loss= -39.8%
Estimated Gaintime= 1 week

Ethereum Rebounds from Strong Base – ATH in Sight?Hello traders, here’s the CRYPTOCAP:ETH Monthly Outlook
Ethereum is flashing early signs of a bullish reversal, with a clean Morning Star candlestick pattern forming right above the $1,050–$1,200 support zone, a historically strong base.
After bouncing hard from this level, ETH is now approaching the major resistance area at $3,400–$3,800, the same zone that previously rejected upward moves.
If ETH can break and close above this resistance, we could see the start of a fresh bullish leg. But until then, this zone remains a major hurdle.
Keep an eye on the monthly close, it could confirm a shift in long-term momentum.
DYOR, NFA
Thanks for following along — stay tuned for more updates!

XRP Analysis==>>Correction Signs!!!XRP ( BINANCE:XRPUSDT ) is moving in the Resistance zone($2.63-$2.50) .
In this post, I want to show you some signs that XRP may still need to be corrected in a one-hour time frame :
1 -Regarding Classical Technical Analysis , XRP seems to have succeeded in forming the Rising Wedge Pattern .
2 -The formation of the Evening Star Candlestick Pattern in the Resistance zone can signify the reverse of XRP .
3 -The formation of the Bearish Gartley Harmonic Pattern can also be another sign of the decline of XRP .
4 -According to Elliott wave theory , XRP seems to be completing the main wave 4 .
I expect XRP to break the lower line of the Rising Wedge Pattern , which should drop to at least $2.38 . If the Support line is broken, the next target will be the Support zone($2.25-$2.17) .
⚠️Note: If XRP manages to break the Resistance zone($2.63-$2.50), we can expect an XRP pump.⚠️
XRP Analyze (XRPUSDT), 1-hour time frame⏰.
🔔Be sure to follow the updated ideas.🔔
Do not forget to put Stop loss for your positions (For every position you want to open).
Please follow your strategy and updates; this is just my Idea, and I will gladly see your ideas in this post.
Please do not forget the ✅' like '✅ button 🙏😊 & Share it with your friends; thanks, and Trade safe.

DIXON Short Setup: Evening Star & Potential HNS with Trendline Weekly Analysis
Pattern Observed: Evening Star on Weekly Timeframe
Additional Insights
- The Evening Star pattern tends to be more reliable on Daily and Weekly timeframes, making this setup particularly noteworthy for swing traders.
Trade Setup
1. Entry: Enter after a decisive break below the low of the third (red) candle in the Evening Star pattern.
- Alternatively, you may enter on the fourth candle if it signals a reversal, with a stop loss set according to your risk tolerance.
2. Stop Loss (SL): Can be set based on your risk preference, usually just above the high of the Evening Star pattern.
3. Target (TGT): Consider scaling out at key support levels or use the measured HNS target as detailed below if the formation completes.
---
Potential Head and Shoulders (HNS) Formation
Trade Setup for HNS Pattern:
1. Entry : Enter when price decisively breaks below the neckline on a closing basis.
2. Target (TGT): Measure the distance from the top of the head to the neckline and project it downwards from the neckline for your target.
3. Stop Loss (SL): Place the stop above the head of the HNS pattern.
---
Additional Confirmation
I've drawn a trendline to monitor for a potential breakdown. If either the Evening Star or HNS pattern aligns with a trendline break, it would serve as an additional confirmation for a short position.
---
This setup combines a confluence of technical factors, making it robust for weekly trading decisions. Comments and thoughts welcome!
IMPORTANT THINGS TO REMEMBER
1. Don't be fooled by opearators Theyll try it take it up to sell
2. Don't be a hero, follow SL with 1% extra loss max. (as setup is on Weekly TF)

Goatseus Maximus(GOAT) Ready to FALL!!!(Alert)!!!Today, I want to analyze the Goatseus Maximus(GOAT) memecoin, which has increased almost 😱+1500%😱 in less than 12 days .
What is Goatseus Maximus (GOAT)!?
Goatseus Maximus (GOAT) is a meme coin within the Solana( BINANCE:SOLUSDT ) ecosystem, which has gained significant attention due to its AI-driven features and strong community backing. Its recent surge in price has been driven by multiple factors, including listings on major exchanges.
⚠️Regarding the GOAT memecoin , I must warn that as if the team members of GOAT are NOT known, the specific website or social media(just X Platform) related to GOAT that have been approved by the project team CANNOT be found . As a result, please pay more attention to capital management before buying GOAT .⚠️
In terms of Technical Analysis , GOAT is moving near the lower line of the Ascending Channel and Potential Reversal Zone(PRZ) .
Also, the Evening Star Candlestick Reversal Pattern in PRZ and the Huge volume of the third candle of this pattern again indicate the return and fall of GOAT .
Also, Regular Divergence(RD-) between Consecutive Peaks .
I expect GOAT to drop at least 🚨 -50% 🚨 after breaking the lower line of the ascending channel, according to the explanation above .
⚠️Note: If GOAT can trade above $1.00 for 2-3 days, we can expect an increase.⚠️
Goatseus Maximus Analyze ( GATEIO:GOATUSDT ), 1-hour time frame⏰.
🔔Be sure to follow the updated ideas.🔔
Do not forget to put Stop loss for your positions (For every position you want to open).
Please follow your strategy and updates; this is just my Idea, and I will gladly see your ideas in this post.
Please do not forget the ✅' like '✅ button 🙏😊 & Share it with your friends; thanks, and Trade safe.

SPY: A Critical Inflection Point! (D&W charts)In our last analysis last week, we had already identified a critical support point around $565, which is once again acting as a support, as expected. However, in the light of new evidence, we have to update the central point of the idea, and draw up possible scenarios for us to work on next.
The link to our prevous analysis on SPY is below this post, as usual.
Daily Chart (Left):
Previous Top at $574.71: This level represents the recent all-time high, which has become a point of resistance after the price failed to maintain above it.
Current Support at $565.16: The price is testing the $565.16 support area, which was previously a resistance level. It is now, for the second time, a crucial level to hold for the continuation of the uptrend. This is the most important inflection point for the SPY.
21-day EMA Support: The price is hovering around the 21-day EMA, adding more significance to this support zone. A daily close below this line could indicate a deeper pullback.
Weekly Chart (Right):
Possible Evening Star Pattern: The recent weekly candles form a potential evening star pattern, which is typically a bearish reversal signal, especially after a strong uptrend. This pattern is characterized by a small-bodied candle (potential reversal sign) followed by a bearish candle.
Key Support Areas: The first support to watch is $565.16, aligning with the daily timeframe, followed by a more significant support at $539.44 if the evening star pattern confirms.
Trend Continuation: If the pattern fails to confirm, a weekly close back above $574.71 would invalidate the bearish scenario and signal strength in the current trend.
Conclusion:
The SPY chart is at a critical juncture. The daily chart shows support holding at $565.16, which is a critical support level and inflection point for the SPY, as a break below this line could trigger a sharper sell-off. The potential evening star pattern on the weekly chart adds bearish pressure, and we should closely monitor the $565.16 level for further clues. If the evening star confirms, the $539.44 support could come into play as a downside target. For bullish continuation, holding above $565.16 and reclaiming the $574.71 level are essential.
For more detailed technical analyses and insights like this, be sure to follow my account. Your support helps me continue providing valuable content to help you make informed trading decisions.
Remember, real trading is reactive, not predictive, so let's stay focused on the key points described above and only trade when there is confirmation.
“To anticipate the market is to gamble. To be patient and react only when the market gives the signal is to speculate.” — Jesse Lauriston Livermore
All the best,
Nathan.

Apollo Tyres, Bearish Reversal with Divergences & Evening StarStock : Apollo Tyres
CMP : 499
Timeframe : Monthly
Pattern : Bearish Reversal with Divergences & Evening Star
Trade Type : Short
Price Action & Technical Analysis
- Bearish Divergence
- MACD Down
- Price is below 5 Moving Average
Target 1 - Rs. 436
Target 2 - Rs. 366
Stoploss - Rs. 520
Disclaimer : "The information provided in this content is for educational purposes only. Please do your own research and consult with a professional financial advisor before making any investment or trading decisions. The author is not responsible for any financial losses incurred as a result of applying the information contained in this material."

SPX Bull Run May Be OverHi Traders!
SPX looks to have fallen short of the record high, and there could potentially be a big pullback that is about to occur.
Here are the details:
There is an evening star candle pattern currently on the 1W chart, and this is the first week the market's weekly open price has opened substantially lower than the previous week's closing price in about 8 weeks.
We are looking for a pullback to test the previous resistance break at 4637.30, which is now the support, and if the market breaks below that, then the next level will be trendline support at 4331.90, which lines up with the 38.2 Fibonacci retracement level at 4311.69.
Preferred Direction: Sell
Technical Indicators: 20 EMA
Resistance: 4818.62
Support: 4637.30
Trendline Support: 4331.90
38.2 Fibonacci Support: 4311.69
Please make sure to click on the like/boost button 🚀 as your support greatly helps.
Trade safely and responsibly.
BluetonaFX

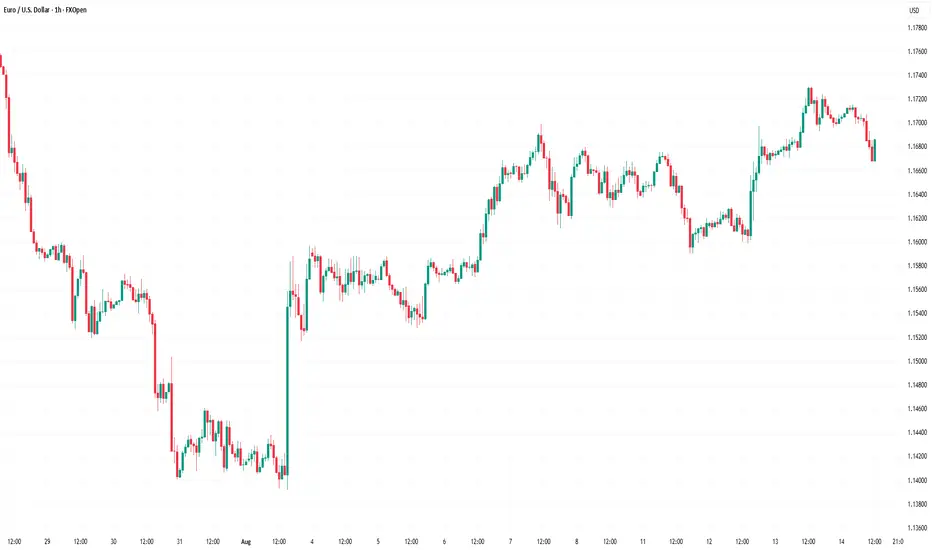
#EURGBP selling opportunityEURGBP exhibits a valid bearish market structure in the 1-hour timeframe, as illustrated in the chart. This structure begins after the price tested an important daily resistance and was subsequently rejected.
With this ongoing bearish move, we are inclined to take sell positions in this pair as long as the current structure persists.
Upon closer examination, the price tested the bearish trendline and formed a 1-hour engulfing candlestick pattern . When combined with the preceding candles, it resulted in an evening star candlestick pattern.
The occurrence of this pattern within a resistance area enhances the likelihood of its significance.
The formation of this pattern leaves us with a clean-break area, which serves as an important supply zone where traders may consider selling this pair.
Additional bearish confluences include the price testing the 1-hour and 30-minute 200 EMA.
For selling this pair, the optimal area to place your stop-loss would be above the previous high. If the price reaches that point, it indicates the end of the bearish trend, and we would then be dealing with a bullish trend.
If you've found this analysis helpful, please take a moment to like, comment, or share your thoughts with me.

MSTR Evening Star Poses Whipsaw Risk"Evening stars" are not as reliable as they used to be. They occur after heavy speculation and a steep angle of ascent. A few days ahead of earnings, NASDAQ:MSTR could not break through the resistance above.
The Gap up was HFT driven. This stock has a lot of retail interest at the moment, with every eye on AI. But the selloff from last quarter's reporting season is creating resistance on the daily scales. It is a very pricey stock for this market condition and the emotional state of most investors.
MSTR is likely to gap on earnings news as there are leaks out that it is going to be a blockbuster earnings report.

usdjpy reversal signal at retest highAfter a 1 hour variation of an evening star during the London session this morning, I was alert during the New York session to see if price would be strong enough to push beyond its latest high; especially after a bullish engulfing. Price merely closed off with some buy exhaustion only to followed by a doji. This set-up looks like a false break of a major resistance level which is why I decided to take advantage of the retest during the best time of the day. Although the dollar yen is still overall bullish, there are sellers coming in to keep price from pushing higher. I've shorted the highs, no lower low yet except for intraday 5min. which is my entry point. Stop loss just above the high.

Shorting a Daily shooting star re-testAUDUSD provided a daily shooting star on Monday which signaled that intraday it may become bearish. This re-test is after a Bearish Engulfing was confirmed on the prior touch. The 4H failed to break beyond a monthly resistance. I took a 1H evening star short beneath resistance.

Catching Falling Knife Series= "IZMO"In this Knowledge Nugget, I have explained logic behind my own trade in "IZMO" which rallied 50% + from its swing low in just days. I am found of entering such stocks for one round of buying at support level with my own set up logic.
This is for educational purpose & please do not copy this trade without understanding risk & position sizing.

Ethereum is retracing to create its lower highIt's a great thing we're no longer fooled by big big candles being a big move. Proce closed pretty Bullish on Sunday only adding to the combination of randomness . Anytime price created a lower low, I project and expect it tush lower after a retest. This is exactly what price is doing, a reversal candlestick at a key area suggests its almost time to short. If anything price has determined where it wants to slow down. This 61.8 retracement is no surprise considering the fact that the weekly was rejected earlier when price attempted to break it. It seems price wants another crack at rejection. I'll short here since the 30min and 1H is already creating lower lows and lower highs upon reaching that area.

XAU/USD Swing Trade PlanHello Guys.
Hope you have good times and great trades too!
Today i'm going to explain why GOLD will fall to at least 1930 in coming days.
First of all as you can see in my chart we see a strong Bearish Divergence Between
RSI and price in Daily TF , that i show them with white lines.
Next , We can see a Evening Star Pattern in this strong Resistance level(2050 $).
After that we pass through 20 and 50 MA 's and according to Pullback to MA50 ,
I personally predict we can continue downside.
as you can see we have a trendline base don the pervious two bottoms.
And this Trendline Overlap with MA100(Green line).
So i think this is the first Target for the price in the way of going down.
For later happenings we should follow chart and see what candles shape in this area.
But Don't forget to SET a Good Stoploss in Lower timeframe , if you want to catch this Fish :)
Hope you Enjoy my opinion and
PLEASE
Share me your idea in comments , Let me Learn something from you.
THANKS all my friends.
Good Luck.

A Four Hour Evening Star Formed at 38.2Weekly momentum may suggests that intraday momentum is bullish. Last week closed out a very strong bullish engulfing from the low of a weekly range. However The Daily is currently at a key reversal area despite its attempt to create a higher high. The 4 hour has been uptrending with high highs and higher lows despite many weak bullish candles. I believe price is relativelty close to topping out at its high for a reversal given that a confirmed evening star formed at a zone, resistance and the major 38.2 level. The one hour has already broken a bullish correction trendline and the 8MA has crossed to the downside of the 21SMA. 0.67872 is a key area for a short re-test as well as the wick of the evening star. There a monthly resistance right above this new high. I'll be monitoring the 4 hour timeframe for more signs of bear strenth. I'll be looking to enter on a 30MIN or 1 hour set up.

TSLA Looks Exhausted; Flashes a Reversal SignalA few months ago, SquishTrade wrote a bearish technical analysis on TSLA that forecasted a drop to a series of targets that were all reached. TSLA's downward move was more violent and rapid than anyone may have expected. Indeed, TSLA broke down from a huge head-and-shoulders pattern. Supplementary Chart A is the head and shoulders pattern that broke through its neckline in October 2022. It backtested and chopped for a bit, then fell like a stone. What seemed to be a move that would take several months to a year happened in about 2 short months.
Supplementary Chart A
Now, meme mania and the most-shorted stock list has lead the massive rally from October 2022 lows. This list includes stocks like TSLA, and investors filled with fear of missing out on the next massive moon event have piled into this stock. They've been helped by short-covering hedge funds who were like pigs lined up at the feeding trough but gorged a bit too long for their own health.
TSLA now looks exhausted. Note that this does not mean it heads straight back to lows. It could—it already made an unexpectedly massive down move from October to December 2022, and that was after a not so pretty decline in the first half of 2022. Markets and major stocks have been inflicting pain on traders of all stripes this year, so even if TSLA decides to make new lows underneath 2022 lows, it may not do so in an obvious or expected fashion.
Several technical points suggest that price will soon reverse. TSLA's price has likely exhausted this current rally higher. What happens next depends on the broader equity markets' direction, the nature of risk appetite relative to risk-free assets (government bonds such as the 10-year Treasury note, the 30-year Treasury bond, the macro environment (inflation, recession, price of money / interest rates) and TSLA's fundamentals as consumers' spending power likely begins to suffer from the rising price of money.
Note the orange rectangle, which is a major supply and resistance zone. Price has rallied right up to it without consolidating for any significant time beyond a day or two. This major resistance (formerly supply under the concept of parity) coincides with the 50% retracement of the last major wave of decline (green line).
A gravestone doji, evening doji star, shooting star, or spinning top has formed. Each candlestick pattern mentioned could be applied to this (perhaps the spinning top is a stretch). But the label isn't as important as what the implication it provides. It shows indecision right at a time when major resistance has been reached. Indecision is not the kind of state in which price action should be when it approaches such a significant level. But it arrived here too sharply, too fast. So it's exhausted right when it shouldn't be, right when extra momentum and vigor is needed for buyers to push through this level. Note that patterns containing the term "star" are not valid unless a third confirmation candle pushes down into the body of the candle that preceded the star.
A negative divergence appears using the Bollinger Bands. The divergence is more apparent using the %B indicator rather than the Bollinger Bands themselves. This shows that while price has made higher high on February 8-9, 2023, in terms of standard deviation, the high is actually a lower high as shown by the fact that the Bollinger Bands were not pierced by the highs over the last few days. Further explanations appear on Supplementary Chart B below.
Supplementary Chart B
Next, consider price targets, assuming price reverses here or a just bit higher. The most obvious target is the 50% to 61.8% retracement of the current rally. Those Fibonacci levels lie on either side of the huge gap fill area, another obvious target, shown by the magenta rectangle on the Primary Chart. The list of price targets follows:
Target 1: $200 (most conservative)
Target 2: $171.14 (somewhat conservative)
Target 3: $157.91 (moderately aggressive)
Target 4: $144.67 (fairly aggressive)
Target 5: $125.82 (aggressive)
No one can be certain in trading, investing, and forecasting. But traders can be sleuths, examining the charts for bits of evidence to see if they tilt the probabilities in one direction or the other. The probabilities here are tilted lower in the short-term and intermediate term. Yes, price could pull back and then make a higher high after that, or price could pull back and fall to retest / break December 2022 lows. A linear regression channel from the highs suggests that the downtrend could continue this year, but that is not as certain as the likelihood of a near term reversal and decline in price that ends the current rally.
Finally, consider the long-term view. The uptrend remains intact. But don't be deceived by that if you bought at $150-$180 over the last couple weeks and are counting your profits. The uptrend line remains down at $39-$45 depending on the time when it would be tagged (over the remainder of 2023).
Supplementary Chart C
________________________________________
Author's Comment: Thank you for reviewing this post and considering its charts and analysis. The author welcomes comments, discussion and debate (respectfully presented) in the comment section. Shared charts are especially helpful to support any opposing or alternative view. This article is intended to present an unbiased, technical view of the security or tradable risk asset discussed.
Please note further that this technical-analysis viewpoint is short-term in nature. This is not a trade recommendation but a technical-analysis overview and commentary with levels to watch for the near term. This technical-analysis viewpoint could change at a moment's notice should price move beyond a level of invalidation. Further, proper risk-management techniques are vital to trading success. And countertrend or mean-reversion trading, e.g., trading a rally in a bear market, is lower probability and is tricky and challenging even for the most experienced traders.
DISCLAIMER: This post contains commentary published solely for educational and informational purposes. This post's content (and any content available through links in this post) and its views do not constitute financial advice or an investment or trading recommendation, and they do not account for readers' personal financial circumstances, or their investing or trading objectives, time frame, and risk tolerance. Readers should perform their own due diligence, and consult a qualified financial adviser or other investment / financial professional before entering any trade, investment or other transaction.


SBUX daily evening star reversal in between weekly moving averagSBUX daily evening star reversal in between weekly moving averages

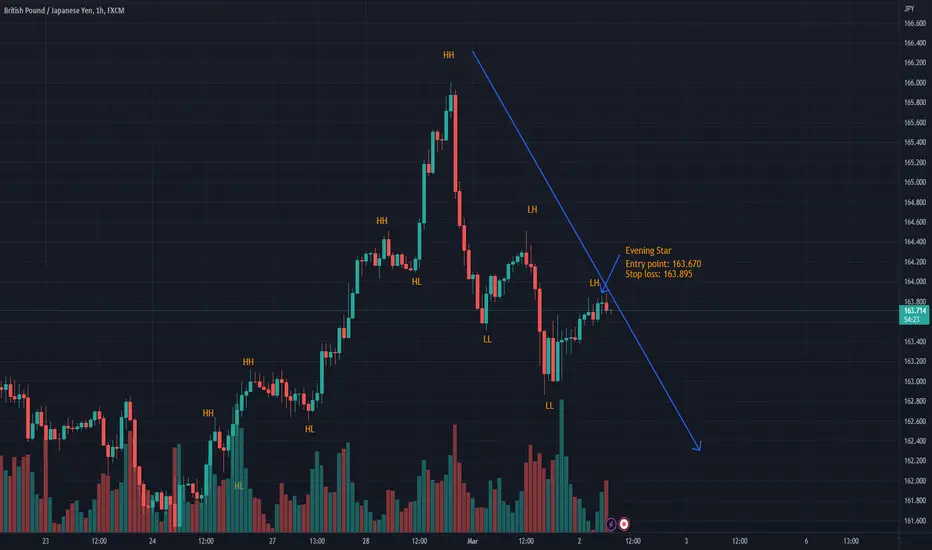
Short entry for GBPJPYManage your levels accordingly.Always use stop loss.In Bearish trend its looking a good entry.