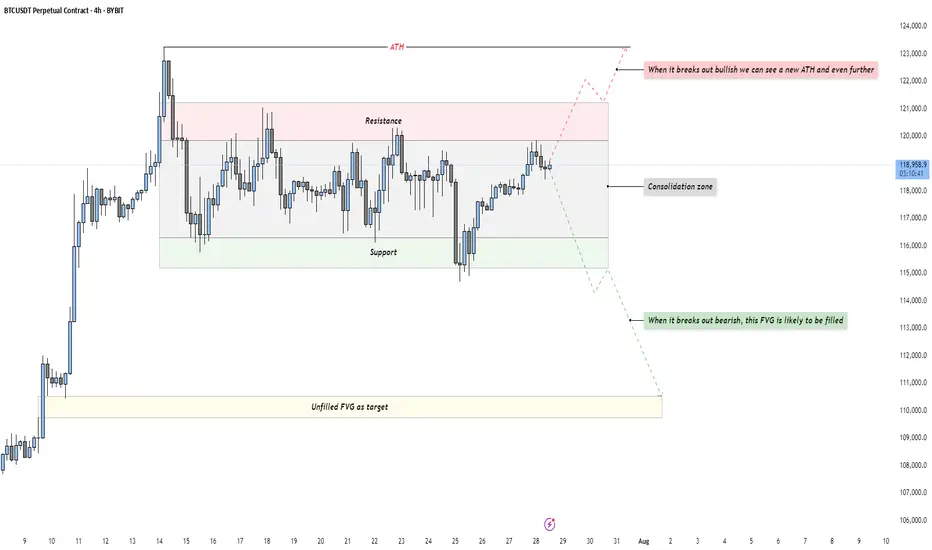
BTC - Bulls vs Bears: who will win?Market Context
Bitcoin is trading in a tight consolidation just below its all-time high after a strong impulsive rally. This phase represents a balance of power between buyers and sellers, with neither side able to take control yet. Such a pause in momentum at this key level often builds pressure for a breakout move as liquidity pools accumulate above and below the range.
Consolidation Phase
The current range is clearly defined by a resistance area at the top and a support area at the bottom. Price has been oscillating within these boundaries without any sustained breakout attempts. This range-bound behavior is an essential part of the market cycle, as it allows larger players to build or distribute positions. The longer price stays in this box, the more significant the breakout that follows tends to be.
Bullish Breakout Scenario
If price breaks out decisively above resistance, it would indicate buyers have absorbed all the supply at these levels. Such a breakout opens the path to a new all-time high and could potentially extend far beyond as trapped shorts are forced to cover. For traders, a retest of the breakout level on lower timeframes could provide a low-risk entry point for continuation to the upside.
Bearish Breakout Scenario
On the flip side, if support fails, the market will likely gravitate toward the unfilled Fair Value Gap left behind during the previous rally. This inefficiency becomes a natural draw for price, offering a logical downside target for a corrective move. A clean break below the range followed by a retest from underneath could present shorting opportunities for those aiming to capture that move into the FVG.
Final Words
Patience and precision are key when dealing with setups like this. Let the market come to your level — and react with intent.
If you found this breakdown helpful, a like is much appreciated! Let me know in the comments what you think or if you’re watching the same zones.
F#forex
EURUSDHello Traders! 👋
What are your thoughts on EURUSD?
EUR/USD kicked off the week with a sharp drop of nearly 200 pips, driven by renewed concerns over U.S. tariff policies. This strong bearish momentum signals intensified selling pressure across the board.
The pair is now approaching a support zone, which has previously triggered bullish reactions.
However, given the current strong bearish sentiment, there is a real risk this support may not hold.
Our bias remains bearish overall.
If the pair finds temporary support at this level, a short-term corrective bounce is possible.
But ultimately, we expect a continuation of the downtrend toward lower support levels after the correction completes.
Can this support zone stop the bleeding, or is more downside coming? Let us know your thoughts! 👇
Don’t forget to like and share your thoughts in the comments! ❤️

XAU/USD | Gold Below $3345 – Key Demand Awaits at $3282–$3296!By analyzing the gold chart on the 4-hour timeframe, we can see that after dropping to the $3301 area, strong demand came in, helping the price stabilize above $3300 and rally up to over $3334. Currently, gold is trading around $3331. If the price fails to break and hold above $3345 within the next 8 hours, we may see a price correction soon. A key demand zone lies between $3282–$3296, where a strong bullish reaction could occur if price revisits this area. Important supply levels to watch are $3366, $3382, $3393, and $3404.
Please support me with your likes and comments to motivate me to share more analysis with you and share your opinion about the possible trend of this chart with me !
Best Regards , Arman Shaban

AUDUSD Potential UpsidesHey Traders, in today's trading session we are monitoring AUDUSD for a buying opportunity around 0.64900 zone, AUDUSD is trading in an uptrend and currently is in a correction phase in which it is approaching the trend at 0.64900 support and resistance area.
Trade safe, Joe.

EURUSD Breaks Trendline: Bearish Momentum in PlayHello guys!
After months of climbing steadily along the ascending trendline, EURUSD has finally broken below support. The trendline breach, followed by a tight consolidation (yellow circle), hinted at a loss of bullish strength, and now the breakdown is in full motion.
Broken ascending trendline
Clear rejection after retest
Bearish continuation underway
Target area: 1.1400–1.1440 zone
If sellers maintain control, the price could descend toward the next major demand area.

EUR/USD | Sweeps Liquidity and Rebounds – Eyes on 1.16700!By analyzing the EURUSD chart on the 4-hour timeframe, we can see that after our previous analysis, the price continued its decline and eventually swept the liquidity below 1.15580. Following that, strong demand kicked in, and the pair is currently trading around 1.15810. If the price can hold above this level, we can expect further bullish movement. The next potential targets are 1.1600, 1.16280, 1.16430, and 1.16700.
Please support me with your likes and comments to motivate me to share more analysis with you and share your opinion about the possible trend of this chart with me !
Best Regards , Arman Shaban

EUR/USD Bullish Reversal Setup – 1H ChartEUR/USD 1H Chart Setup:
The chart shows a potential bullish reversal setup after a downtrend. Entry is marked near 1.15867 with a target at 1.17953 and a stop loss set at 1.15092. The trade anticipates a strong upward move following the downward pressure.

USDCAD: a long positionHello guys.
Divergence:
A bullish RSI divergence is noted, price made lower lows while RSI formed higher lows, signaling a potential bullish reversal.
Price Action:
Price has bounced strongly from around the 1.3570–1.3580 zone and is now approaching a descending trendline resistance.
Trade Setup:
Entry: 1.3718
Stop Loss: Below the breakout candle, near 1.3686
Take Profit: Around 1.3782
Risk-to-Reward: 1:3

Bullish Sentiment Returns to Gold?Hello everyone, what are your thoughts on XAUUSD?
From a technical perspective, XAUUSD has just retested its long-term ascending trendline and formed a bullish reaction candle, suggesting that buying pressure may be returning.
Recently, a survey of 206 investors revealed that market sentiment remains optimistic, with 66% expecting gold prices to continue rising, 19% predicting a decline, and 15% anticipating a sideways market.
What do you think? Share your opinion in the comments!

GBPAUD Reverses from Key Zone – Long Setup in Play!Today I want to share with you a Long position on GBPAUD ( OANDA:GBPAUD ).
GBPAUD started to rise well from the Important Support line , Support zone(2.032 AUD-1.987 AUD) , and Potential Reversal Zone(PRZ) and managed to close the 4-hour candle above 2.053 AUD (important) .
In terms of Elliott wave theory , GBPAUD seems to have completed the main wave 4 . The main wave 4 structure was a Double Three Correction(WXY) .
Also, along the way, we can see a Bullish Marubozu candle , which could indicate a continuation of the uptrend .
I expect GBPAUD to break the Resistance lines soon and attack the Resistance zone(2.078 AUD-2.066 AUD) .
First Target: 2.065 AUD
Second Target: 2.076 AUD
Note: Stop Loss(SL): 2.040 =Worst SL
Please respect each other's ideas and express them politely if you agree or disagree.
British Pound/ Australian Dollar Analyze (GBPAUD), 4-hour time frame.
Be sure to follow the updated ideas.
Do not forget to put a Stop loss for your positions (For every position you want to open).
Please follow your strategy and updates; this is just my Idea, and I will gladly see your ideas in this post.
Please do not forget the ✅' like '✅ button 🙏😊 & Share it with your friends; thanks, and Trade safe.

ETH/USDT | at a Crossroads – Hold Above $3440 or Sharp Fall!By analyzing the Ethereum chart on the weekly timeframe, we can see that after reaching $3940 and touching the key supply zone, ETH entered a slight correction and is currently trading around $3756. The key question now is whether it can hold above $3440 by the end of the week and push past $4000. If it does, we can expect another bullish leg toward $4100 and $4470. However, if the $3440 support fails, a sharp decline may follow — so this level is critical.
Please support me with your likes and comments to motivate me to share more analysis with you and share your opinion about the possible trend of this chart with me !
Best Regards , Arman Shaban
Euro will rebound from support line of wedge to resistance levelHello traders, I want share with you my opinion about Euro. After breaking out decisively from a prior downward channel, the euro initiated a significant structural shift, moving from a clear downward trend into a new and more volatile market condition. This transition has led to the development of a large broadening wedge pattern, which is characterised by higher highs and lower lows, indicating an expansion in volatility as both buyers and sellers fight for control. The boundaries of this struggle are well-defined by a major buyer zone around 1.1650 and a formidable seller zone near 1.1750. Currently, the pair is in a corrective phase, moving downwards within the wedge after a recent upward rebound was rejected from the upper resistance line. The primary working hypothesis is a long scenario, which anticipates that this downward correction will find strong support at the confluence of the wedge's ascending support line and the horizontal buyer zone around 1.1650. A confirmed bounce from this critical area of support would validate the integrity of the broadening wedge pattern and likely trigger another powerful upward rotation. Therefore, the TP is strategically placed at the 1.1750 resistance level. Please share this idea with your friends and click Boost 🚀
Disclaimer: As part of ThinkMarkets’ Influencer Program, I am sponsored to share and publish their charts in my analysis.

GOLD falls on USD and trade talks, big data weekSpot OANDA:XAUUSD ended its rally this week on Friday (July 25) and closed down nearly 1%, mainly affected by the recovery of the US Dollar TVC:DXY and progress in trade negotiations that weakened safe-haven demand.
DXY recovered 0.27% on Friday to close at 97.642, ending a two-week low, making gold less attractive than its direct correlation.
Earlier, news of a US-Japan trade deal and a breakthrough in US-EU talks weakened the market's demand for safe-haven assets.
For the content of the US-Japan trade deal, readers can review it in the daily publications during the past trading week.
Data and Fed Expectations
The latest US jobless claims fell to a three-month low, suggesting the job market remains solid. This gives the Federal Reserve reason to maintain interest rates at 4.25%-4.50%, despite President Trump once again pressuring Powell to cut rates.
However, in the short term, the fundamental direction of gold may need to wait for the Federal Reserve to announce more policy signals at its meeting next week.
Speculative Longs Hit High Near April Peak
Data from the U.S. Commodity Futures Trading Commission (CFTC) showed that as of the week of July 22, the speculative net long position in COMEX gold rose by 27,211 lots to 170,868 lots, the highest level since April. This shows that as gold prices fall again, buyers are still actively deploying, waiting for more guidance from policy and data.
Last Week Review and This Week’s Fundamental Outlook
Last week, gold prices initially rose and then fell. Due to risk aversion and volatility in the US dollar, gold prices surpassed the $3,400/ounce mark at the start of the week, but as trade optimism increased and profit-taking emerged, gold prices fell back, trying to stay above $3,300/ounce.
Investors will face several major events this week:
Federal Reserve policy meeting (Wednesday): Markets expect interest rates to remain unchanged, but Powell’s speech could influence market expectations for a rate cut this year.
Macro data will be released in batches: including ADP employment data on Wednesday, PCE price index on Thursday and non-farm payrolls report on Friday. These data will determine the next move of gold.
Global central bank trends: The Bank of Canada and the Bank of Japan also hold policy meetings next week. Investors will be watching to see if their policy signals cause volatility in the US dollar and gold prices.
Technical Outlook Analysis OANDA:XAUUSD
On the daily chart, gold is in a rather important position after 3 consecutive corrective declines. However, the bearish momentum still keeps gold above the base price, which is an important psychological point for the bullish expectation of 3,300 USD.
In terms of position and indicators, gold has not completely lost the ability for a bullish outlook. Specifically, gold is still in a short-term rising channel and supported by the EMA21. On the other hand, it is still supported by the horizontal support level of 3,310 USD, followed by the psychological level of 3,300 USD and the 0.382% Fibonacci retracement.
Gold will only qualify for a bearish cycle if it sells below the 0.382% Fibonacci retracement level, then the target will be around 3,246 USD in the short term, more than the 0.50% Fibonacci level.
RSI is sloping down, but has not yet crossed the 50 level, and in the current case, the 50 level acts as a momentum support for the RSI. It shows that there is still room for an increase in price, and if RSI sloping up from 50, it will provide a bullish signal with relatively wide room.
If gold rises above the 0.236% Fibonacci retracement level (3,371 USD), it will be eligible for a new bullish cycle with a target of around 3,400 USD in the short term, more than 3,430 – 3,450 USD then the all-time high.
In the coming time, in terms of position and indicators, gold still has a technical outlook leaning more towards the upside and the notable points will be listed as follows.
Support: 3,310 – 3,300 – 3,292 USD
Resistance: 3,350 – 3,371 – 3,400 – 3,430 USD
SELL XAUUSD PRICE 3371 - 3369⚡️
↠↠ Stop Loss 3375
→Take Profit 1 3363
↨
→Take Profit 2 3357
BUY XAUUSD PRICE 3303 - 3305⚡️
↠↠ Stop Loss 3299
→Take Profit 1 3311
↨
→Take Profit 2 3317
XAUUSD under pressure – Is the downtrend just beginning?Hello everyone! What do you think about XAUUSD right now?
Yesterday, XAUUSD extended its decline and is currently trading around 3,315 USD.
The recent drop in gold prices was mainly triggered by a stronger US dollar, following a trade agreement between the US and the European Union (EU).
From a technical perspective, the short-term outlook shows the beginning of a new downtrend. Notably, we see a bearish crossover in the EMA 34 and 89, along with a break of the previous upward trendline—both reinforcing the current bearish momentum.
If there’s a pullback before the next leg down, the 0.5–0.618 Fibonacci retracement zone (which also aligns with resistance and the EMAs) will be a key area to watch. This could be an ideal level for potential trade setups.
Looking ahead, the next support target is around 3,300 USD. If that level breaks, gold might aim for the 32XX region.
Do you think XAUUSD will continue to fall? Drop your thoughts in the comments!
Wishing you successful and profitable trades!

GBPJPY starts corrective downtrend. Ready to SELL✏️ OANDA:GBPJPY has broken the trendline structure and broken the disputed zone. Price is heading towards the support zone ahead around 197.000. This is considered a breakout zone for DCA rather than BUYing at this zone. The downtrend of GBPJPY may extend to the bottom of last week.
📉 Key Levels
SELL now GBPJPY 198.000
SELL trigger: Break support zone 197.000
Target 195.500
Leave your comments on the idea. I am happy to read your views.

GOLD The Target Is UP! BUY!
My dear subscribers,
This is my opinion on the GOLD next move:
The instrument tests an important psychological level 3317.7
Bias - Bullish
Technical Indicators: Supper Trend gives a precise Bullish signal, while Pivot Point HL predicts price changes and potential reversals in the market.
Target - 3326.4
My Stop Loss - 3313.0
About Used Indicators:
On the subsequent day, trading above the pivot point is thought to indicate ongoing bullish sentiment, while trading below the pivot point indicates bearish sentiment.
Disclosure: I am part of Trade Nation's Influencer program and receive a monthly fee for using their TradingView charts in my analysis.
———————————
WISH YOU ALL LUCK
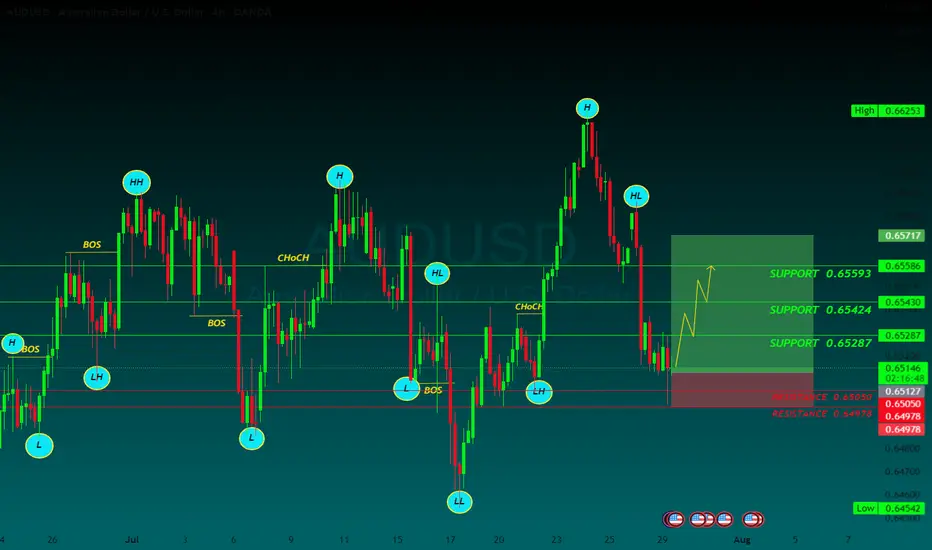
AUDUSD BUYThe AUD/USD pair is trading around 0.6520 on Tuesday. The daily chart’s technical analysis indicates a prevailing bullish bias as the pair remains within the ascending channel pattern. However, the 14-day Relative Strength Index (RSI) has moved below the 50 mark, indicating that a bearish bias is active. Additionally, the pair is positioned below the nine-day Exponential Moving Average (EMA), indicating that short-term price momentum is weaker.
The US and EU reached a framework trade agreement on Sunday that sets 15% tariffs on most European goods, taking effect on August 1. This deal has ended a months-long stand-off, per Bloomberg.
Traders keep their eyes on further developments in the US-China trade talks. The discussions are set to resume on Tuesday after top economic officials from both nations held over five hours of negotiations in Stockholm on Monday. The purpose of this meeting is to resolve ongoing disputes and extend their trade truce by another three months.
US Treasury Chief Scott Bessent met with China’s Vice Premier He Lifeng at Sweden’s Rosenbad government offices. The meeting comes ahead of an August 12 deadline to finalize a long-term tariff agreement with the Trump administration, building on preliminary deals reached in May and June that had helped ease tensions.
The US Federal Reserve (Fed) is widely expected to keep the benchmark interest rate steady between 4.25% and 4.50% at its July meeting. The FOMC press conference will be observed for any signs that rate cuts may start in September.
The Reserve Bank of Australia (RBA) is expected to closely watch the June labor force data and second-quarter inflation figures before deciding on a potential rate cut. Both the monthly and quarterly CPI reports are scheduled for release later this week.
SUPPORT 0.65593
SUPPORT 0.65424
SUPPORT 0.65593
RESISTSNCE 0.65050
RESISTANCE 0.64973
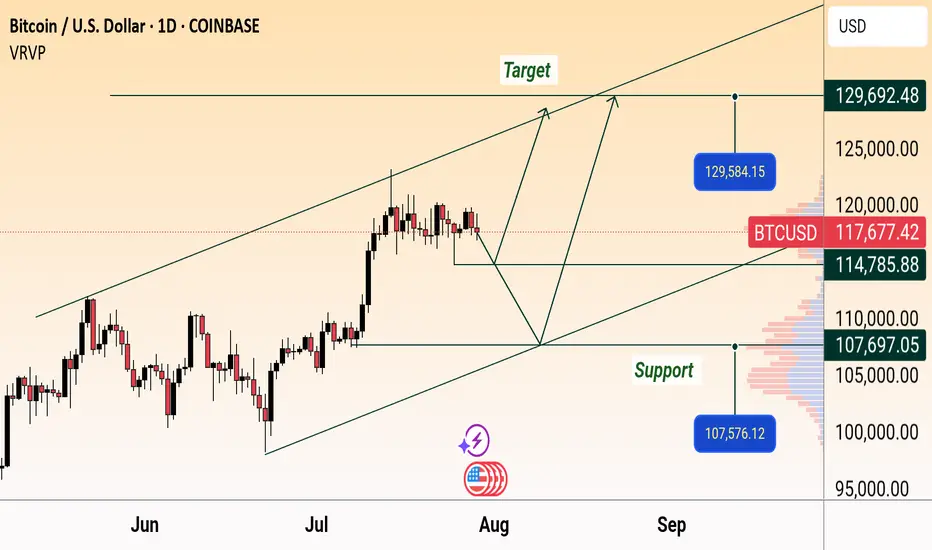
BTC/USD Daily Outlook: Support & Target Levels IdentifiedBitcoin (BTC/USD) Daily Chart Analysis:
Price is currently at $117,758.70, showing a slight decline. Key support levels are marked at $114,785.88 and $107,576.12, while targets are projected near $129,584.15 and $129,692.48. Chart suggests a possible upward channel, with both bullish and bearish scenarios mapped.
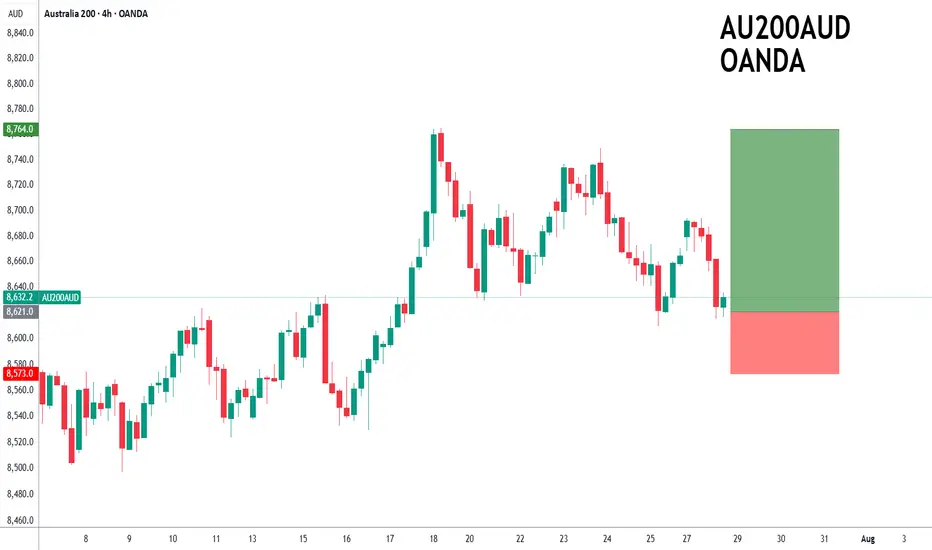
ASX200 to find support at current market price?ASX200 - 24h expiry
The primary trend remains bullish.
Price action continues to trade around the all-time highs.
20 1day EMA is at 8619.
Offers ample risk/reward to buy at the market.
Our outlook is bullish.
We look to Buy at 8621 (stop at 8573)
Our profit targets will be 8764 and 8794
Resistance: 8670 / 8694 / 8749
Support: 8610 / 8570 / 8524
Risk Disclaimer
The trade ideas beyond this page are for informational purposes only and do not constitute investment advice or a solicitation to trade. This information is provided by Signal Centre, a third-party unaffiliated with OANDA, and is intended for general circulation only. OANDA does not guarantee the accuracy of this information and assumes no responsibilities for the information provided by the third party. The information does not take into account the specific investment objectives, financial situation, or particular needs of any particular person. You should take into account your specific investment objectives, financial situation, and particular needs before making a commitment to trade, including seeking, under a separate engagement, as you deem fit.
You accept that you assume all risks in independently viewing the contents and selecting a chosen strategy.
Where the research is distributed in Singapore to a person who is not an Accredited Investor, Expert Investor or an Institutional Investor, Oanda Asia Pacific Pte Ltd (“OAP“) accepts legal responsibility for the contents of the report to such persons only to the extent required by law. Singapore customers should contact OAP at 6579 8289 for matters arising from, or in connection with, the information/research distributed.
GBPCAD - Long-Term Long!Hello TradingView Family / Fellow Traders. This is Richard, also known as theSignalyst.
📈GBPCAD has been overall bullish trading within the rising wedge pattern marked in blue.
This week, GBPCAD has been retesting the lower bound of the wedge.
Moreover, the red zone is a strong weekly structure.
🏹 Thus, the highlighted blue circle is a strong area to look for buy setups as it is the intersection of the lower blue trendline and red structure.
📚 As per my trading style:
As #GBPCAD approaches the blue circle zone, I will be looking for trend-following bullish reversal setups (like a double bottom pattern, trendline break , and so on...)
📚 Always follow your trading plan regarding entry, risk management, and trade management.
Good luck!
All Strategies Are Good; If Managed Properly!
~Rich
Disclosure: I am part of Trade Nation's Influencer program and receive a monthly fee for using their TradingView charts in my analysis.

Xauusd bullish setupGold (XAU/USD) is approaching a key support zone around 3,285.82. The chart suggests a potential bullish reversal from this level, targeting resistances at 3,376.35 and 3,431.08. Price action may form a double bottom before moving upward.

EURUSD: Bullish Continuation is Expected! Here is Why:
Remember that we can not, and should not impose our will on the market but rather listen to its whims and make profit by following it. And thus shall be done today on the EURUSD pair which is likely to be pushed up by the bulls so we will buy!
Disclosure: I am part of Trade Nation's Influencer program and receive a monthly fee for using their TradingView charts in my analysis.
❤️ Please, support our work with like & comment! ❤️

GBPCHF: Bearish Movement Confirmed 🇬🇧🇨🇭
GBPCHF looks bearish after the news today.
The price tested a solid rising trend line on a daily
and formed a confirmed bearish Change of Character
on an hourly time frame.
I think that the price will continue falling and reach 1.0702 level.
❤️Please, support my work with like, thank you!❤️
I am part of Trade Nation's Influencer program and receive a monthly fee for using their TradingView charts in my analysis.
