Stop!Loss|Market View: GOLD🙌 Stop!Loss team welcomes you❗️
In this post, we're going to talk about the near-term outlook for GOLD ☝️
Potential trade setup:
🔔Entry level: 4167.192
💰TP: 3900.356
⛔️SL: 4370.061
"Market View" - a brief analysis of trading instruments, covering the most important aspects of the FOREX market.
👇 In the comments 👇 you can type the trading instrument you'd like to analyze, and we'll talk about it in our next posts.
💬 Description: After breaking out of the accumulation in a symmetrical triangle, gold prices formed an accumulation near the 4200 level, indicating the emergence of a potential limit seller who, after breaking out of the accumulation, will sell the instrument to those willing to buy at the breakout. Against this backdrop, a downward movement is likely expected, and given the potential volatility this week, two scenarios are being considered.
Thanks for your support 🚀
Profits for all ✅
Fed

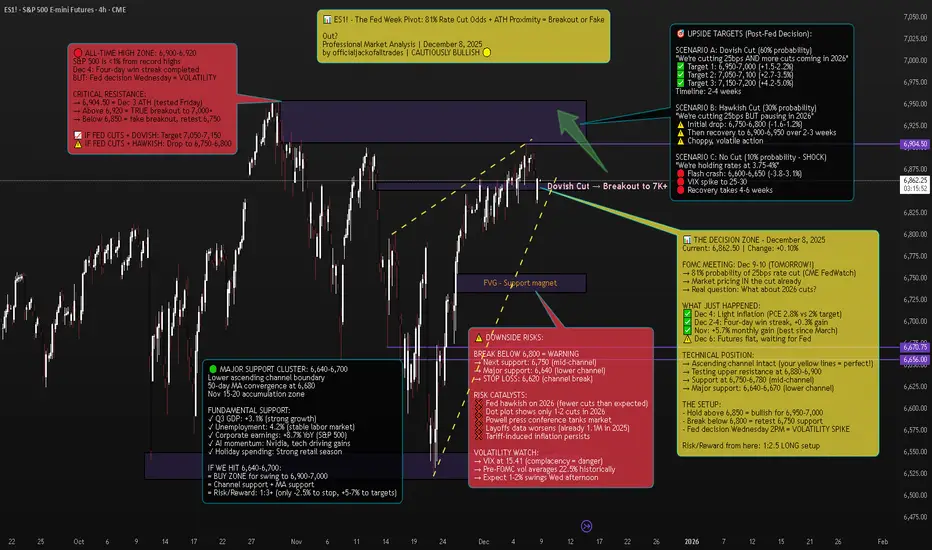
ES1! S&P 500 E-mini Futures - The Fed Week Pivot📈 Executive Summary - The Setup
Current Price: 6,862.50 | Date: December 8, 2025 | Change: +6.75 (+0.10%)
The S&P 500 E-mini futures are sitting less than 1% from all-time highs on the eve of the Federal Reserve's most anticipated meeting of 2025. After a four-day win streak that added 0.3% to the index, markets are now in a classic consolidation pattern at resistance, waiting for Wednesday's 2PM ET catalyst.
The Technical Picture:
Pattern: Ascending channel (intact since November)
Current Position: Testing upper resistance at 6,880-6,900
ATH: 6,904.50 (December 3) - 0.6% away
Support: 6,750-6,780 (mid-channel), 6,640-6,670 (lower channel)
The Fundamental Backdrop:
FedWatch shows a near-90% probability the FOMC will cut the target range for the federal funds rate by another 25 basis points. But here's what markets are REALLY pricing: not just the cut itself (that's a given), but Powell's guidance on 2026.
Minutes from the October meeting showed "many" FOMC members saying no more cuts are needed at least in 2025. Yet the market now indicates an 80% likelihood of a December rate cut, following dovish statements from NY Fed President John Williams and Fed Governor Christopher Waller.
The Trade: This is a tactical long from 6,850-6,870 targeting 6,950-7,050, with stop at 6,820. Risk/reward: 1:2.5.
But the real opportunity? Buying any Fed-induced dip to 6,750-6,800 for a swing to 7,000+.
🔎 Market Context - What's REALLY Happening
The Pre-Fed Calm
US stock futures stall as traders wait for the Fed meeting, with the S&P 500 just below record highs. This is textbook behavior: The indexes have quietly stitched together consistent gains. The Dow and Nasdaq scored back-to-back positive weeks; the S&P 500 added another 0.3% and now sits only a touch from record territory.
S&P 500 futures (ES) traded around 6,880-6,885, roughly 0.1% higher by 6:00-7:30 a.m. ET on Monday.
But don't mistake the calm for weakness. Even after November's wobble, dip-buyers came back as shutdown fears faded and AI jitters cooled.
The Fed's Dilemma
The Federal Reserve is in an impossible position:
Argument FOR cutting:
Concerns about a softening labor market
Employers cut more than 1.1 million jobs through November, the most since 2020 and a 54% increase from the same period a year ago
Job growth remains too low to keep up with labor supply growth and a rising unemployment rate
Argument AGAINST cutting:
Latest inflation scorecard, the Fed's preferred PCE index, is running at 2.8 percent a year, close to its 2 percent goal but not quite there
The annualized inflation rate grew to 3% in September from 2.9% in August and 2.7% in July
Officials expressing skepticism about the need for an additional cut that markets had been widely anticipating, with "many" saying that no more cuts are needed at least in 2025
The Missing Data Problem:
Here's something CRITICAL that most traders don't know: The U.S. central bank will have to make its decision without some key government data. Hiring data for November and the latest inflation number have been delayed until mid-December, after the Fed's meeting, because of the U.S. government shutdown.
The meeting minutes indicated the decision-making was complicated by a lack of government data during the 44-day federal government shutdown. Powell himself compared this to "driving in the fog".
Translation: The Fed is making a $28 TRILLION (SPY market cap) decision BLIND.
The Internal FOMC War
"It's difficult to recall a time when the Federal Open Market Committee has been so evenly divided about the need for additional rate cuts than the upcoming December meeting," Michael Pearce, chief U.S. economist at Oxford Economics, said.
Jerome Powell faces a credibility issue as he tries to satisfy hawks and doves on the most divided Fed in recent memory.
The October meeting vote was 10-2, but the 10-2 vote was not indicative of how split officials were at an institution not generally known for dissent. The minutes revealed multiple camps:
Some favored cutting
Some supported cutting but could have supported holding
Several were against cutting
For December, Mericle expects at least two dissents in favor of no rate cut as well as one in favor of a larger rate cut.
📊 Technical Analysis - The Ascending Channel At Decision Point
The Pattern: Ascending Channel (Bullish Structure)
Your chart annotation is PERFECT. The yellow dashed ascending channel captures the exact structure driving ES1! since the November bottom.
Channel Characteristics:
Lower Support: 6,640 (tested Nov 15, Nov 29) → 6,670 (current)
Upper Resistance: 6,850 (Nov 25) → 6,900 (Dec 3-6) → 6,920 (projected)
Angle: ~25° (strong bull trend)
Tests: 6 touches (3 upper, 3 lower) = highly reliable pattern
Current Position: We're at the UPPER boundary of the channel, testing 6,880-6,900 resistance.
Key Technical Levels:
🔴 RESISTANCE (Selling pressure zones):
6,880-6,900: Current test, upper channel boundary
6,904.50: All-time high from December 3
6,920-6,950: True breakout zone (if we clear ATH)
7,000: Psychological milestone
🟢 SUPPORT (Buying interest zones):
6,850: Immediate support, bull/bear line
6,800-6,820: Minor support cluster + FVG
6,750-6,780: Mid-channel support + 23.6% Fib
6,700-6,720: 38.2% Fib retracement
6,640-6,670: Major support (lower channel + 50-day MA + November accumulation)
Technical Indicators:
Moving Averages:
50-day MA: ~6,680 (rising, bullish)
200-day MA: ~6,450 (rising, bullish)
Golden Cross: Active since mid-November = long-term bullish
RSI (Relative Strength Index):
Current: 58-60 (neutral/slightly bullish)
Not overbought (room to run to 70+)
Not oversold (not panic selling)
Interpretation: Healthy consolidation before next leg
Volume Analysis:
Declining volume into Fed decision = normal pre-FOMC behavior
Stock volatility averages around 22.5% in the month preceding rate cuts, compared with roughly 15% during normal periods
Expect volume spike Wednesday 2PM-4PM (100K+ contracts)
VIX (Fear Index):
VIX at 15.41, down -0.37 (-2.34%)
This is LOW = market complacency
Pre-FOMC, VIX typically rises to 18-22
IF VIX spikes to 20+ Wednesday = sell signal
🎯 Scenario Analysis - Three Possible Outcomes
SCENARIO A: Dovish Cut (60% Probability) - BULLISH
What Happens:
Fed cuts 25bps to 3.50-3.75% range ✓
Dot plot shows 3-4 more cuts in 2026 ✓
Powell says "labor market concerns outweigh inflation" ✓
Balance sheet runoff stops as planned (December 1) ✓
Market Reaction:
Immediate: ES pumps 1-1.5% to 6,930-6,950
Day 1-3: Consolidation at 6,920-6,950
Week 1-2: Breakout to 7,050-7,100
Month 1: Target 7,150-7,200 (+4.2%)
Sector Leaders:
Small caps (Russell 2000) +2-3%
Tech (Nasdaq) +1.5-2%
Financials +1-1.5%
Trade Setup:
Enter: ANY dip to 6,850-6,870 before Fed
Add: On breakout above 6,910 with volume
Target: 7,050 (+2.7%), 7,150 (+4.2%)
Stop: 6,820 (-0.6%)
Risk/Reward: 1:4
SCENARIO B: Hawkish Cut (30% Probability) - NEUTRAL/CHOPPY
What Happens:
Fed cuts 25bps to 3.50-3.75% range ✓
BUT dot plot shows only 1-2 cuts in 2026 ❌
Powell says "we're near neutral, will pause to assess" ❌
Market had priced in 3-4 cuts for 2026 = DISAPPOINTMENT
Market Reaction:
Immediate: ES drops 0.8-1.2% to 6,790-6,820
Day 1: Volatility, chop between 6,780-6,850
Week 1-2: Dip-buying brings it back to 6,870-6,900
Month 1: Grind back to 6,950-7,000 (+1.3%)
Sector Rotation:
Small caps (Russell 2000) -1.5-2%
Tech holds up better (mega-caps)
Defensives (utilities, staples) outperform
Trade Setup:
DO NOT chase before Fed (risk of -1.2% drop)
Buy: Dip to 6,750-6,800 (mid-channel support)
Target: 6,900-6,950 (+2-3% from dip entry)
Stop: 6,720 (-1%)
Risk/Reward: 1:2
SCENARIO C: No Cut OR Very Hawkish (10% Probability) - BEARISH
What Happens:
Fed HOLDS at 3.75-4% range (SHOCK) ❌
OR cuts but says "this is the last one for 6+ months" ❌
Powell cites inflation persistence, tariff risks ❌
Market has 90% priced in for cut = PANIC
Market Reaction:
Immediate: ES flash crashes 2-3% to 6,650-6,750
Day 1: Volatility, VIX spikes to 25-30
Week 1-2: Bounce attempt to 6,750-6,800 fails
Month 1: Retest 6,600, then recovery to 6,800-6,850
Sector Carnage:
Small caps (Russell 2000) -3-4%
Tech -2-3%
Everything bleeds
Trade Setup:
Exit ALL longs immediately on no-cut announcement
Wait for VIX to spike above 25
Buy: Capitulation at 6,600-6,650 (lower channel)
Target: Recovery to 6,850-6,900 (+3-4%)
Risk/Reward: 1:3 (but high stress)
🎯 THE TRADE SETUP - Professional Execution Plan
🟢 PRIMARY LONG SETUP: BUY ES1!
Entry Strategy (Scale In):
Option A: Conservative (Wait for Fed)
50% at 6,750-6,780 (IF hawkish cut dips)
50% at 6,720-6,750 (IF deeper dip)
Best for: Risk-averse traders
Option B: Tactical (Enter Now)
40% at 6,860-6,870 (current - small position)
30% at 6,820-6,840 (IF pre-Fed dip)
30% at 6,750-6,780 (IF post-Fed dip)
Best for: Experienced traders comfortable with volatility
Stop Loss: 6,620 (HARD STOP)
Below 6,620 = channel break on daily close
Below this = technical structure invalidated
Max loss from 6,862 entry: -3.5%
Take Profit Targets:
TP1: 6,950-7,000 (Probability: 70%)
Initial breakout above ATH
Psychological 7,000 level
Action: Take 40% profit, move stop to 6,850
Gain: +1.3-2.0% | Risk/Reward: 1:2
TP2: 7,050-7,100 (Probability: 50%)
Momentum continuation
Channel projection
Action: Take 30% profit, trail stop to 6,920
Gain: +2.7-3.5% | Risk/Reward: 1:3
TP3: 7,150-7,200 (Probability: 30%)
Full breakout extension
TradingView puts it, with a potential breakout in S&P 500 futures above the 6,900 area
Action: Take 20% profit, let 10% ride
Gain: +4.2-4.9% | Risk/Reward: 1:4
Entry Confirmation Checklist:
Before entering, CHECK:
✅ Price holding above 6,850 (bull/bear line)
✅ Volume spike on bounce (80K+ contracts on 15min)
✅ RSI crosses above 60 (momentum shift)
✅ VIX drops below 16 (fear subsiding)
✅ Fed announces 25bps cut (as expected)
✅ Powell's tone is dovish or neutral (not hawkish)
WAIT FOR 4/6 BEFORE FULL POSITION
Fed Day Volatility Protocol:
December 10, 2PM ET - Fed Announcement:
1:45 PM: Tighten stops to 6,830 (before announcement)
2:00 PM: Fed statement released - READ IMMEDIATELY
2:00-2:05 PM: Algorithmic reaction (ignore, volatile)
2:05-2:30 PM: Human digestion of statement
2:30 PM: Powell press conference begins - WATCH LIVE
2:30-3:15 PM: Powell Q&A determines direction
3:15-4:00 PM: Final positioning for overnight
IF DOVISH: Add to position on dip to 6,900
IF HAWKISH: Cut 50%, trail rest tight at 6,820
Weekly Monitoring:
Check EVERY DAY:
Fed speakers: Any 2026 guidance changes
Economic data: Jobs (Dec 16), CPI (Dec 18)
Technical levels: Is channel intact?
VIX: Spikes above 20 = warning
Volume: Declining = weak trend
Emergency Exit Conditions:
❌ Daily close below 6,620 = EXIT ALL (channel break)
❌ VIX spikes above 25 = EXIT 50%, tight stop on rest
❌ Fed announces NO cut (10% scenario) = EXIT ALL immediately
❌ Powell says "this is the last cut for 2026" = EXIT 50%
❌ ES gaps down >1.5% overnight = reassess, likely exit
📊 Fundamental Analysis - Why This Matters
CATALYST #1: The Fed's Impossible Position
Federal Reserve policymakers are expected to cut interest rates at this week's meeting despite inflation remaining above their target amid concerns about a softening labor market.
This is the classic Fed dual mandate dilemma:
Mandate #1: Maximum employment (FAILING - 1.1M layoffs in 2025)
Mandate #2: Stable prices (FAILING - inflation at 2.8% vs 2% target)
They can't fix both. So they have to choose.
David Mericle, chief U.S. economist at Goldman Sachs notes job growth remains too low to keep up with labor supply growth and a rising unemployment rate.
My take: The Fed will prioritize employment over inflation. That's dovish = bullish for stocks.
CATALYST #2: Corporate Earnings Remain Strong
Despite all the macro noise, corporate profits are SOLID:
S&P 500 earnings: +8.7% YoY
Tech sector leading: +12-15% earnings growth
AI spending driving margins higher
Q4 guidance mostly positive
Carvana (CVNA) stock rose 8% before the bell on Monday following news on Friday that it will join the S&P 500 as part of the index's quarterly rebalancing.
Translation: Fundamentals support higher prices, Fed just needs to cooperate.
CATALYST #3: Seasonal Tailwinds
Could spark a "year-end melt-up", as TradingView puts it, with a potential breakout in S&P 500 futures above the 6,900 area.
December-January has positive seasonality:
Holiday spending strong
Tax-loss selling done (Nov-early Dec)
January effect (fresh capital inflows)
Pension/401k rebalancing (buy equities)
Historically, S&P 500 averages +1.3% in December and +1.1% in January.
CATALYST #4: Institutional Positioning
Bloomberg's interviews with 39 investment managers show that most are still planning for a risk-on 2026, citing expectations of continued AI-driven productivity and earnings growth.
But here's the key: Asset managers such as EFG Asset Management and BNP Paribas Asset Management caution that with 2025 already a strong year, they are reluctant to increase equity exposure into thin year-end liquidity, preferring instead to wait for better entry points in early 2026.
Translation: Institutions are WAITING to buy. Any Fed-induced dip to 6,750-6,800 will be AGGRESSIVELY bought.
⚠️ Risk Factors - The Bear Case
RISK #1: Hawkish Powell Tanks Market
Feroli noted that the firm is anticipating at least two dissents in favor of no rate cut as well as one in favor of a larger rate cut.
If Powell leans hawkish to appease the dissenting hawks, market could drop 1-2%.
RISK #2: Tariff-Induced Inflation
Minutes mentioned Trump's tariff policies in forecasts they provided in early September, projecting higher inflation and unemployment, slower growth and a lower federal funds ratel.
If inflation accelerates in 2026 due to tariffs, Fed might have to HIKE again = very bearish.
RISK #3: Labor Market Deterioration
Employers cut more than 1.1 million jobs through November, the most since 2020 and a 54% increase from the same period a year ago.
If this accelerates, could trigger recession fears.
RISK #4: Technical Breakdown
Break below 6,620 = channel invalidated → target 6,500-6,550 (-4.5-5.2%)
🔥 The Bottom Line
Here's what I KNOW on December 8, 2025:
✅ 81% probability of 25bps cut Wednesday
✅ S&P 500 less than 1% from ATH
✅ Your ascending channel is PERFECT technical structure
✅ 39 investment managers planning risk-on 2026
✅ Corporate earnings strong (+8.7% YoY)
✅ Seasonal tailwinds (December +1.3% avg)
✅ Support at 6,750-6,800 = institutional buy zone
Here's what I DON'T know:
Will Powell be dovish or hawkish?
How many 2026 cuts will dot plot show?
Will Q&A reveal recession concerns?
But here's what the MATH says:
Risk: 6,862 → 6,620 = -3.5% (if channel breaks)
Reward: 6,862 → 7,050 = +2.7% (base case)
Extended: 6,862 → 7,150 = +4.2% (bull case)
Risk/Reward: 1:2.5 minimum
The Play:
Small position NOW at 6,860-6,870 (20-30% of intended size)
IF hawkish dip to 6,750-6,800 → ADD 50-70%
IF dovish → ADD on breakout above 6,910
Stop at 6,620 (non-negotiable)
Target 7,050, then 7,150
This is a PROBABILITY game. 60% dovish, 30% hawkish, 10% shock. Position accordingly.
📍 Follow officialjackofalltrades for institutional-grade technical analysis, professional risk management, and trades backed by data.
Drop a 📊 if you're trading the Fed decision.
Drop a 🎯 if this helped your ES1! analysis.
Drop a 💰 if you're ready for 7,000+ SPX.
German Industrial Production Surges, but the Euro Remains UnderToday's Industrial Production s.a. (MoM) data for October surprised to the upside, showing a strong increase of 1.8%, compared to expectations of -0.4% and a previous reading of 1.1%. This marks one of the strongest monthly performances of the year, indicating renewed stabilization in Europe's largest economy.
The indicator, released by the Statistisches Bundesamt Deutschland, is a key measure of the health of the manufacturing and mining sectors-core drivers of the German economy. Typically, higher industrial production is considered positive for the euro, signaling better growth prospects within the Eurozone.
Market Reaction - A Brief Spike Followed by Reversal
Immediately after the release, the euro jumped approximately 20 pips against the US dollar. However, the move was short-lived. During the European morning session, the USD regained all losses and strengthened further, pushing EUR/USD back toward 1.1650, with continued bearish momentum on the single currency.
This price action suggests that investors remain unconvinced that a single positive data point is enough to change the broader negative outlook for the Eurozone.
Geopolitical Pressure and Investor Sentiment
Market sentiment today was influenced not only by economic indicators but also by political commentary. Recent criticism of the European Union by Elon Musk and Donald Trump-including claims that the EU should "return to nation-states"-has added to investor caution regarding European assets.
Although such remarks do not directly affect short-term indicators, they contribute to a broader environment of skepticism toward the Eurozone's long-term stability.
World-Signals Outlook for EURUSD
According to World-Signals, the euro is likely to remain under pressure in the coming days. Expectations of a Federal Reserve interest rate cut toward the end of the year are currently viewed by markets as a supportive factor for the US dollar, signaling continued resilience in the American economy.
Given this backdrop, a move in EURUSD toward 1.1700 appears unlikely in the near term. Instead, USD strength is expected to dominate, with potential for the pair to test lower levels if negative sentiment toward the Eurozone persists.

BTC Range Play: ISPD Cluster Holds, Eyes on FOMCMarket Overview
__________________________________________________________________________________
Bitcoin is consolidating just above a tightly packed multi-timeframe demand cluster, with price boxed between well-defined supports and the 92k–92.5k ceiling as the market waits for the FOMC catalyst.
Momentum: Neutral with a slight bullish tilt while 89,100–89,400 holds; sellers continue to defend 92,000–92,500.
Key levels:
- Resistances (HTF): 91,000–91,400; 92,000–92,500; 99,000–100,000
- Supports (HTF): 89,100–89,400 (multi‑TF cluster); 87,800–88,200 (pivot low); 86,000
Volumes: Moderate on intraday and HTF; no sustained extremes.
Multi-timeframe signals: 1D/12H neutral; 6H/4H/2H lean neutral‑buy at the ISPD floors; LTFs remain choppy under 91k.
Harvest zones: 89,400 (Cluster A) / 89,100–89,300 (Cluster B) — ideal dip‑buy zones for inverse pyramiding with confirmation.
Risk On / Risk Off Indicator context: Sell bias (risk‑off) dominates; it contradicts the mild buy tilt at support and argues for patience into FOMC.
Trading Playbook
__________________________________________________________________________________
The dominant structure is a range with demand control at 89.1k–89.4k and supply at 91k–92.5k; adopt a reactive stance, buying confirmed reversals at the floor and fading clean rejections at HTF resistance.
Global bias: Neutral‑buy above 89,100–89,400; invalidation on a sustained break below 87,800.
Opportunities:
- Buy the dip: 2H+ bullish reversal at 89,100–89,400; partial size, add only on confirmation.
- Breakout buy: Close and hold above 92,500 opens 95k–100k; enter on retest that holds.
- Tactical sell: Fade rejection at 91,000–91,400 (or 92,000–92,500) only with bearish candle + weak volume.
Risk zones / invalidations: A daily/12H close below 87,800 would invalidate the neutral‑buy and expose 86,000; failure to follow through within 48–72h after entry also invalidates.
Macro catalysts (Twitter, Perplexity, news): FOMC with a widely expected 25 bps cut; JOLTS/CPI and Powell’s tone to steer liquidity; gold firm and USD/yields steady keep risk sensitivity elevated.
Harvest Plan (Inverse Pyramid):
- Palier 1 (12.5%): 89,400 (Cluster A) + reversal ≥2H → entry
- Palier 2 (+12.5%): 85,800–84,000 (-4/-6% below Palier 1) → reinforcement
- TP: 50% at +12–18% from PMP → recycle cash
- Runner: hold if break & hold first R HTF (91,400)
- Invalidation: < HTF Pivot Low (87,800) or 96h no momentum
- Hedge (1x): Short first R HTF on rejection (91,400) + bearish trend → neutralize below R
Multi-Timeframe Insights
__________________________________________________________________________________
Across TFs, price is coiling above a dense demand cluster while capped by layered supply into 92k–92.5k.
1D/12H: Sideways/neutral under 92k–92.5k; structure constructive above 87,800 with a clean pivot low; a decisive close above 92,500 is needed to unlock 95k–100k.
6H/4H/2H: Compression above 89,100–89,400 ISPD floors; repeated defenses signal high‑quality demand, but upside needs volume through 91,000–91,400 to avoid another lower high.
1H/30m/15m: Noisy mean‑reversion inside 89,250–91,000; intraday reversals work best when aligned with ≥2H signals. Confluence at the ISPD floors is the edge; macro risk is the main divergence.
Macro & On-Chain Drivers
__________________________________________________________________________________
Macro risk dominates into the FOMC while the external risk regime tilts risk‑off; that keeps Bitcoin’s range intact until a decisive post‑Fed move.
Macro events: Markets largely price a 25 bps cut; Powell’s guidance on path/duration is key. CPI/JOLTS add event risk; gold is firm and USD/yields steady, keeping risk assets sensitive.
External Macro Analysis: Risk On / Risk Off Indicator = sell regime with late‑cycle tone; speculative appetite and credit show stress while semis/small caps are conflicted. This supports a cautious technical bias until confluence improves.
Bitcoin analysis: Bounce from 86–87k reclaimed 90k; 87,800–88,200 is the HTF pivot low; 91k–92.5k caps. Structural resumption needs sustained strength toward 99k–100k. ETF daily inflow positive, but 7‑day average muted.
On-chain data: Demand modest; capital momentum slightly positive; 96–106k quantile remains pivotal for trend resumption; holding the ISPD cluster stabilizes, a breakdown opens an air pocket.
Expected impact: Risk‑off macro tempers upside until post‑FOMC; a supportive Powell could unlock a push through 92.5k, while a hawkish surprise risks losing the 89k cluster.
Key Takeaways
__________________________________________________________________________________
BTC is range‑bound into FOMC, with demand clustered at 89.1k–89.4k and supply stacked at 91k–92.5k.
The overall trend is neutral with a mild buy bias above the ISPD floors. The most relevant setup is buying a confirmed 2H+ reversal at 89.1k–89.4k, then adding only as 91k–91.4k breaks on volume. A risk‑off macro regime into FOMC argues for patience and hard invalidations. Stay nimble and let the post‑Fed move define the next leg; harvest volatility, don’t chase it.

EUR/USD Is Walking Into a Trap: Liquidity Sweep is coming!Price Action & Structure
The current structure shows a corrective rally unfolding within an ascending channel (green dashed lines).
Price action is printing higher highs without fresh momentum, a typical sign of “distribution during a pullback.”
The market is now trading in the upper half of the channel, approaching a daily premium zone just below 1.1700–1.1750.
Daily RSI sits around 60–65, which aligns with an extended pullback, not the beginning of a true bullish trend.
COT Analysis
EUR Futures (CME)
Large speculators are increasing shorts more aggressively than longs → bearish reading on the euro.
Commercials
Commercial traders are adding longs while reducing shorts.
→ This is classic hedging behavior during extended bullish corrections.
USD Index COT
Non-Commercial:
Positioning shows speculators are covering USD longs, but not turning bullish on the euro.
This suggests a temporary squeeze, not a structural trend reversal.
Retail Sentiment
70% SHORT EUR/USD
30% LONG
Retail traders are heavily short and consistently squeezed during upside moves.
This is a classic setup for a fake bullish rally into premium zones, after which larger players typically reverse price.
EUR/USD Seasonality (December)
December is statistically bullish, with average performance between +0.8% and +1.4%.
Seasonal curves show a rise into mid/late December, followed by:
→ a pullback near month-end
→ a bearish setup after January 3rd (typical early-year USD strength)
Thus, the current rally aligns perfectly with seasonality:
December rally → distribution → January drop.
Conclusion
EUR/USD is completing a structural bullish pullback, not forming a new bullish trend.
The move toward 1.1700–1.1750 looks like:
✔️ a liquidity grab
✔️ seasonal pump
✔️ exhaustion before reversal

Bank of Japan Losing Credibility. USDJPY eyes breakout. Continued or large scale QE, capped yields and reluctance to normalise (or being forced back in to easing during a downturn) would anchor Japanese yields far below peers encouraging capital outflows and undermining confidence in the currency.
A shrinking and ageing population chronic fiscal deficits very high public debt and history of trade deficits in recent years represent structural headwinds that can justify a weaker Yen if investors start to question long-run debt sustainability.
With a wide and persistent rate gap, leveraged global players can keep borrowing Yen to buy higher yield assets abroad.
If markets begin to doubt the BOJ's ability to manage the government bond market without either monetisation or financial repression, investors may demand a steep currency discount rather than high nominal yields, instead of typical "higher rates, Stronger FX" reaction.
Global risk: If the dollar regains or maintains "only game in town" safe-haven status in a world of repeated shocks - while the Yen loses it's traditional safe haven status because of Japan's Macro position - USDJPY can behave more like a one way-risk trade than a mean reverting pair.

Gold Eyes 4,207 Rebound as USD Softens & Venezuela Tensions RiseHey Traders, in today’s trading session we are monitoring XAUUSD for a potential buying opportunity around the 4,207 zone. Gold continues to trade within a broader uptrend, and the current pullback is bringing price into a key support–resistance confluence aligned with the ascending trend structure.
Fundamentals:
The US Dollar remains under pressure, with markets increasingly leaning toward a dovish shift from the Federal Reserve, reinforcing gold’s classic negative correlation with the USD. A softer Dollar environment typically boosts demand for metals, and this week’s macro flow continues to point in that direction.
At the same time, geopolitical tensions between the U.S. and Venezuela are escalating, increasing global uncertainty and driving markets toward safe-haven assets. Gold is already reflecting this risk premium, and any further escalation could accelerate flows into XAU.
Next Step:
We’re watching price reaction closely around 4,207 for a potential continuation of the broader bullish structure.
Trade safe,
Joe.

XAUUSD | Broke Symmetrical Triangle pattern --> Bullish BiasMacro:
- Gold prices advanced this week as renewed demand for hedges and expectations for Fed rate cuts offset still‑elevated US yields. Persistent geopolitical risks and concerns about the global growth outlook continued to underpin safe‑haven interest in gold.
- This week’s gains were supported by softer US data, including weaker private payroll indicators, which strengthened expectations that the Fed will deliver a rate cut at its upcoming meeting. These developments have weighed on the dollar at times, helping gold prices hold near recent highs, even as benchmark US Treasury yields hover around 4.10% rather than falling decisively. Structural drivers also remain in place, with investors and central banks maintaining exposure to gold as a hedge against policy missteps and inflation surprises.
- Gold prices may stay supported if upcoming US inflation data and Fed communication confirm a path toward easier policy and a softer dollar. Any downside surprise in inflation or a more dovish‑than‑expected Fed stance would likely reinforce that narrative. At the same time, a hawkish shift or stronger‑than‑expected data could prompt a temporary pullback. Gold may also react sharply to any escalation in geopolitical tensions or negative growth surprises that tighten financial conditions, as both factors tend to boost safe-haven demand and influence real-yield expectations.
Technical:
- XAUUSD broke the Symmetrical Triangle pattern and rose toward the resistance at 4245 before consolidating within a tight range of 4200-4245. The price is above EMA21, indicating an upward momentum remains.
- If XAUUSD breaches above 4245, the price may surge and retest the ATH area at around 4365.
- Conversely, closing below 4200 may prompt a further correction toward EMA21 area.
Analysis by: Dat Tong, Senior Financial Markets Strategist at Exness

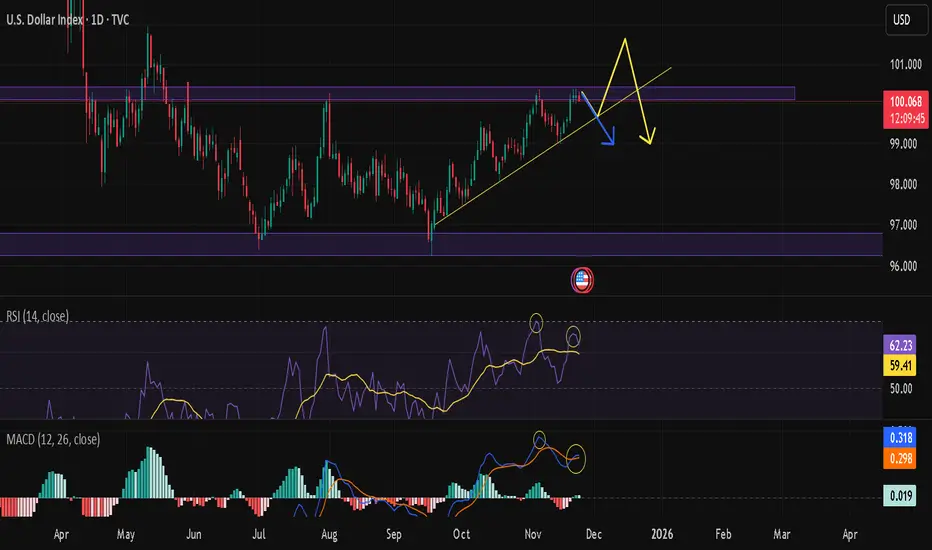
DXY at a KEY “Decision Point” on the Supply ZoneAfter an extended bullish duration, the DXY is now challenging a technically critical “Supply Zone” (100.150 – 100.600). Further away from key levels, both pump and dump up and down, momentum oscillators on all time frames give us mixed signals of exhaustion from buyers and that we are near to making a big decision in the direction of our market.
A comprehensive technical look that includes the broader structures and multi-month macroeconomic supply-demand analysis.
TECHNICAL OUTLOOK
Critical Resistance (Purple Zone): We are currently sitting right inside that 100.150 – 100.600 corridor. This is a level we know well—it’s packed with strong selling pressure and smart money order blocks. Think of this zone as a huge mental hurdle for the bulls; trying to go "Long" here without seeing a clean, high-volume breakout is just asking for trouble with a bad risk/reward setup.
Trend Structure: That ascending yellow trendline connecting the lows since September has been holding the price up so far. But look closer—the space between the price and this trend support is squeezing tight (Compression). This usually tells us one thing: volatility is kicking in and a big move is brewing.
Negative Divergence (RSI) : Here’s the warning sign. While the daily chart is trying to make new highs or just hanging on at resistance, the RSI is losing steam and making lower highs. This "Bearish Divergence" is a classic signal that the trend is running on fumes.
Momentum (MACD) : The MACD histogram is fading out, which confirms the bulls are getting tired. It hints that profit-taking—and the sellers taking over—is likely just around the corner.
MACROECONOMIC AND FUNDAMENTAL DYNAMICS
Fed Expectations : The market is scrambling to rethink the Fed's rate path for 2025. We are watching the data like hawks right now; even a small sign of cooling in jobs or PMI data could spark a rejection from this resistance and send the DXY correcting downwards.
Bond Yields : Any pullback in the US 10-Year Treasury Yields (US10Y) is going to add fuel to the fire for sellers on the Dollar Index.
Liquidity Hunt: Watch out for the "fakeout." Market makers might try to push the price just above that 100.600 level to grab liquidity and hunt the stops of early shorters before slamming it back down. Keep your eyes peeled on the Price Action here.
STRATEGY AND OUTLOOK
Since we are banging our heads against resistance, opening new long positions here just isn't juicy enough risk-wise.
Bearish Scenario: If we see a hard crash with volume breaking that ascending yellow trendline, that seals the deal for a reversal. If that happens, we’re looking at intermediate supports first, with the main target being that 96.50 level down low.
Bullish Scenario : Unless we get a solid daily candle close above 100.800, any rallies should be looked at as opportunities to sell. If the price stays above that level, then this idea is dead in the water.
Conclusion: It’s a "sit on your hands" moment. Waiting for that trend support to break is the safest confirmation we can get before jumping in.
Disclaimer : Just sharing my personal notes and educational analysis here, not financial advice.
DXY | Price Action - Awaiting a Clear BreakoutMacro approach:
- US dollar index has traded slightly weaker so far this week, pressured by rising expectations of another Fed rate cut and soft US data at the start of Dec. Sentiment toward the greenback has been cautious amid a pullback in US yields and ongoing repricing of the Fed’s policy path.
- Markets are increasingly discounting a high probability of a Dec FOMC cut as recent communication and prior easing have reinforced the view that policy is moving deeper into an easing cycle, undermining the US dollar’s yield advantage. At the same time, the latest ISM manufacturing release showed activity remaining in contraction territory, adding to concerns over US growth momentum and limiting support for the currency. Risk appetite in equities and metals has also improved, further reducing near‑term safe‑haven demand for the dollar.
- US dollar index may remain under pressure if the upcoming US labor market data and services surveys indicate further cooling, reinforcing the case for additional Fed easing. Key catalysts include this week’s jobs indicators, the ISM Services Index release, and fresh Fed speeches, which could potentially shift rate-cut expectations and drive renewed volatility in the index.
Technical approach:
- DXY consolidated within the range of 99.00-100.28. The index is between both EMAs, indicating a sideways movement remains intact.
- If DXY breaches above 100.28, the price may rise toward the following resistance at 101.70.
- Conversely, closing below EMA78 and 99.00 may prompt a further decline toward the subsequent support at 97.60.
Analysis by: Dat Tong, Senior Financial Markets Strategist at Exness

Bitcoin Squeeze Into HTF Cap: Harvest Zones MappedMarket Overview
Bitcoin ripped from the 80,620 daily pivot low into a stacked multi‑timeframe cap at 93,105. The bounce is strong, but on 12H/1D it remains a counter‑trend rally pressing a decision point as macro risk tone is still cautious.
Momentum: Bearish bias with a counter‑trend squeeze into 93,105; trend filters (12H/1D) remain down while weekly stays up.
Key levels:
- Resistances (HTF): 93,100–93,105 (720/240 PH), 107,462 (1D PH), 126,219 (1W PH)
- Supports (HTF/MTF): 91,700–90,300 (240 PH/PL zone), 89,300 (240 PL), 80,600 (D Pivot Low + ISPD cluster)
Volumes: Very high volume on the daily rebound; normal to moderate intraday — powerful buy response, but treat it as a catalyst into resistance.
Multi-timeframe signals: 1D/12H down vs 1W up; intraday (1H/30m/15m) up but compressing under 93,105 — aligns with fade‑the‑rip unless 93,105 is reclaimed with persistence.
Harvest zones: 80,600 (Cluster A) / 83,800–84,500 (Cluster B) — ideal dip‑buy zones for inverse pyramiding only with ≥2H reversal signals.
Risk On / Risk Off Indicator context: NEUTRE VENTE — confirms a cautious, sell‑the‑rally stance unless we see multi‑day improvement.
Trading Playbook
__________________________________________________________________________________
With HTF trend filters down, favor a defensive stance: fade strength into 93,105 and only buy confirmed reversals at deep floors.
Global bias: Neutral‑sell while price is below 93,105; invalidation on sustained acceptance above 93,105 (12H–1D).
Opportunities:
- Tactical sell: Fade 93,100–93,300 on rejection; targets 91,700 then 90,250; invalidate on 12H acceptance above 93,105.
- Tactical buy: 2H reversal at 84,500–83,800 (Cluster B); first TP 89,300; invalidate on 2H close beneath the acted floor.
- Strategic buy: 2H+ reversal at 80,600 (Cluster A) for a swing back toward 93,105.
Risk zones / invalidations: A break below 84,500 opens 80,600; daily acceptance above 93,105 flips risk toward 96,000–101,000.
Macro catalysts (Twitter, Perplexity, news): Expansionary PMIs with softer oil and tame Swiss CPI support risk; FOMC ahead can flip the Risk On / Risk Off Indicator; spot ETF inflows are modestly positive but not decisive.
Harvest Plan (Inverse Pyramid):
- Palier 1 (12.5%): 80,600 (Cluster A) + reversal ≥2H → entry
- Palier 2 (+12.5%): 77,400–75,800 (-4/-6% below Palier 1)
- TP: 50% at +12–18% from PMP → recycle cash
- Runner: hold if break & hold first R HTF (93,105)
- Invalidation: < HTF Pivot Low 80,600 or 96h no momentum
- Hedge (1x): Short first R HTF (93,105) on rejection + bearish trend → neutralize below R
Multi-Timeframe Insights
__________________________________________________________________________________
Across TFs, price is pressing a multi‑TF pivot at 93,105 while lower clusters remain the highest‑quality demand.
1D/12H/6H/4H/2H: Counter‑trend rally into 93,105; structure remains heavy below this cap, with first pullback support at 91,700–90,300 and deeper floors at 89,300 and 80,600.
1W: Uptrend intact; reclaim and hold above 93,105 would unlock 96,000–101,000, keeping the larger cycle constructive.
1H/30m/15m: Local uptrend but compressing under 93,105; watch for false break wicks to fade or a clean reclaim + retest to follow higher.
Confluence: 80,600 aligns multi‑TF ISPD floors, AGG(Median) and the D Pivot Low; 93,105 is a 720/240 PH cluster — the key decision gate.
Macro & On-Chain Drivers
__________________________________________________________________________________
Macro reads lean cautiously risk‑on (PMIs >50, softer oil, cool Swiss CPI) but the tech risk regime remains unfavorable, keeping BTC sensitive to policy tone.
Macro events: Broadly expansionary PMIs, oil softer, and subdued Swiss CPI ease inflation impulse; the market awaits the Fed decision, which can reprice risk quickly.
External Macro Analysis: Risk On / Risk Off Indicator master read is bearish with credit stress (HYG) and high‑beta weakness (ARKK) confirmed; semis/small caps in conflict — a mid‑cycle mix that argues for prudence and choppy volatility.
Bitcoin analysis: Modest spot‑ETF inflows and widening institutional access (Vanguard, BoA) add a tailwind, but not enough to overrule HTF resistance without confirmation.
On-chain data: Fresh stablecoin mints suggest dry powder, while some very old coins moving adds supply risk; options skew remains defensively tilted at longer tenors.
Expected impact: Macro/on‑chain backdrop tempers the squeeze; favors selling the 93k rip and buying only confirmed dips at 83.8–84.5k and 80.6k until the regime improves.
Key Takeaways
__________________________________________________________________________________
BTC is squeezing into a heavy HTF cap at 93,105 while the risk regime stays NEUTRE VENTE.
The broader trend is bearish on 12H/1D, so the highest‑probability setup is to fade 93,105 and accumulate on confirmed reversals at 83.8–84.5k and 80.6k. Macro is mixed: PMIs supportive but the risk regime and credit tone remain cautious. Stay patient at the gate and let the level decide the next run.

Kiwi in 5th wave, then buy-the-dip?Kiwi looks to have put in a provisional bottom around 0.5570 and is grinding higher toward the 0.58 handle, a key resistance zone that could either cap this fifth wave or unlock further upside.
In this video, we look at how a weaker US dollar and a slightly more hawkish RBNZ are supporting NZD/USD, and why 0.58 is such an important decision point. We then map out the buy‑the‑dip zone for a potential continuation higher and the levels that would flip the script to shorts.
Key drivers
RBNZ recently cut by 25 bps but signalled the easing cycle is likely over, while new governor Anna Breman is perceived as relatively hawkish and focused on inflation, which helps underpin the Kiwi.
Fed December cut odds around 85–90% after a run of softer US data keep the dollar under pressure, providing a tailwind for NZDUSD on rallies and pullbacks.
On the 4‑hour chart, price is pushing up toward 0.58 with emerging RSI divergence, suggesting this move is likely a fifth wave into resistance and setting up a corrective pullback rather than an immediate trend reversal.
Primary idea : Look to buy the dip if price reacts lower from 0.58 into the 0.5690–0.5660 zone (between the 38.2% and 61.8% Fib of the latest leg and prior support), targeting 0.5910, 0.60 and potentially 0.61, while a break below ~0.5640 and the channel base would instead open the door to deeper downside and short opportunities.
Trading Kiwi here? Share how you’re planning to trade the 0.58 resistance and buy‑the‑dip zone in the comments, and follow for more macro‑plus‑technicals swing setups.
This content is not directed to residents of the EU or UK. Any opinions, news, research, analyses, prices or other information contained on this website is provided as general market commentary and does not constitute investment advice. ThinkMarkets will not accept liability for any loss or damage including, without limitation, to any loss of profit which may arise directly or indirectly from use of or reliance on such information.

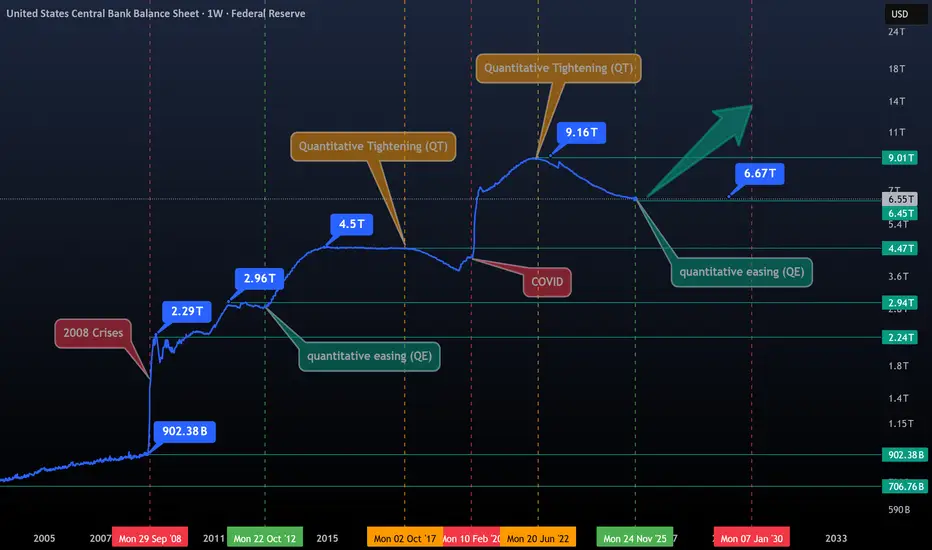
The Era of Gentle Money (QE)- This chart features labels for all key dates, offering a clear and comprehensive overview, including trillions in money creation, QT and QE phases, crises, and flash printing events.
- To truly understand stocks, cryptocurrencies, or precious metals, you first need to understand the monetary system and how it drives inflation.
- The market has been heavily suppressed since June 2022, when the Fed began its Quantitative Tightening (QT), the Fed kicked off a new QE phase on December 1, 2025.
- This is the primary driver behind yesterday’s BTC market surge.
- To complement this, we will soon have a new Fed President, Most likely, they will continue cutting rates, printing more money, and Banks will increase lending, encouraging people to take more risks, which could drive markets higher. Bearish sentiment is premature at this stage.
The heart of truth beats in the printer and in the river of liquidity !
Happy Tr4Ding !
GBPUSD wave 2 pullback? Buy the dip or sell the Rachel rally?Sterling surged over 1% last week on UK budget relief, the so-called "Rachel Rally", but profit-taking kicked in at resistance. With both the BOE and Fed now 90% expected to cut in December, the dollar is under more pressure, making Cable pullbacks attractive buying opportunities.
Key drivers:
"Rachel Rally" profit-taking after Sterling's best week since August led to double top at 1.3275 resistance.
BOE December rate cut priced at 90%, creating short-term headwinds.
Fed December cut odds surged to ~90% after ISM Manufacturing fell to 48.2, the ninth straight month of contraction, keeping dollar weak.
Both central banks are cutting, but USD is under more pressure right now, supporting GBPUSD on pullbacks.
Wave structure : Five-wave leg complete from 1.30 low, now in Wave 2 correction. Key support zone between 38.2% and 61.8% Fibonacci (around 1.3150–1.3130). If this holds, buying the dip for Wave 3 of Wave 3 (or Wave 3 of C) targeting 1.3275, then 1.3315 and higher.
Alternative : Losing 1.31 increases risk of continuation lower toward previous low and potentially 1.2847.
Looking to buy the GBPUSD dip? Share your Wave 2 entries in the comments and follow for more macro-plus-technicals trade ideas.
This content is not directed to residents of the EU or UK. Any opinions, news, research, analyses, prices or other information contained on this website is provided as general market commentary and does not constitute investment advice. ThinkMarkets will not accept liability for any loss or damage including, without limitation, to any loss of profit which may arise directly or indirectly from use of or reliance on such information.

Bulls Hang Tough - US Data and Holiday Trading Make or BreakThanksgiving week delivered a nice rally to help November finish higher than October
It's now December and we have a myriad of US News hitting the headlines before Christmas and New Year's bring us into 2026
ADP Non-Farm
US PMI
US Core PCE
Non-Farm
CPI / PPI
FOMC (December Rate Cut Likely)
Price action is truly key. November ended with a nice stable rally with broad market pumps encouraging an equal weight comeback trade for now (nearly 60% of S&P stocks > 50 period moving average, and 60% of S&P stocks > 200 period moving average)
If the markets avoid a major slip or disruption to end the year, animal spirits may remain optimistic enough to keep the party going in 2026 and continue to climb the wall of worry as sentiment remains pessimistic
US Market Key Levels
1) Oct 10 and Nov 20 candle lows
2) 200 period moving average
3) February 2025 all-time highs area
Sector rotation is pretty clear. Broader market rotation is pretty clear, but overall the markets need to continue to show stable and steady earnings growth and trends and keep the AI narrative glowing with a positive outlook

BTC Risk-Off Drop: 84.6k Floor or 80.6k Test?
__________________________________________________________________________________
Market Overview
__________________________________________________________________________________
Bitcoin just absorbed a high-energy risk-off flush from the 90–92k supply shelf and is sliding toward a dense 84.6k demand cluster. Momentum remains down on HTFs; bounces are corrective unless key resistances are reclaimed.
Momentum: Bearish bias with a corrective bounce attempt; structure prints lower highs across HTFs and rejects 90–92k.
Key levels:
- Resistances (HTF): 88,500–89,000 (breakdown block) / 90,248–91,969 (4H supply) / 95,358 (1D Kijun).
- Supports (HTF): 86,000–86,200 (minor shelf) / 84,568–84,629 (ISPD cluster) / 80,619 (D Pivot Low).
Volumes: Very high on the daily selloff; moderate-to-normal on intraday rebounds.
Multi-timeframe signals: 1D/12H/6H/4H/2H/1H trends are Down; only notable exception is a 1D ISPD “BUY” context at 84.6k that requires a clear reversal signal to act.
Harvest zones: 84,600 (Cluster A) / 79,100–79,600 (Cluster B). These are the preferred dip-buying locations for inverse pyramiding when a ≥2H reversal prints.
Risk On / Risk Off Indicator context: NEUTRE VENTE — confirms the downside momentum and argues for fading rallies unless 88–88.5k is reclaimed with strength.
__________________________________________________________________________________
Trading Playbook
__________________________________________________________________________________
With HTFs pointing Down, the stance is defensive: fade rallies into supply and only buy the 84.6k floor on confirmed reversal.
Global bias: NEUTRAL SELL while below 90,248–91,969; invalidation for shorts on sustained daily close above 92,000.
Opportunities:
- Tactical buy: 84,568–84,629 test only on ≥2H bullish reversal; scale out into 86,200 then 87,600–88,000.
- Breakout buy: Reclaim and hold above 88,000–88,500 with follow-through into 90.2–92.0k; manage risk tightly.
- Tactical sell: Fade rejections at 87,600–88,000 or 90,248–91,969; targets 86,200 → 84,600 → 80,600 if momentum persists.
Risk zones / invalidations: A sustained close below 84,200 likely opens 80,619 then 79,100–79,600; a sustained daily close above 92,000 negates the near-term bearish read.
Macro catalysts (Twitter, Perplexity, news): BOJ tightening risk and yen volatility keep risk premia elevated; FOMC/dot plot can flip tone — wait for post-event persistence; ETF 7d flows negative despite a small daily inflow, limiting macro support.
Harvest Plan (Inverse Pyramid):
- Palier 1 (12.5%): 84,600 (Cluster A) + reversal ≥2H → entry
- Palier 2 (+12.5%): 81,200–79,500 (-4/-6% below Palier 1; Cluster B included) → reinforcement
- TP: 50% at +12–18% from PMP → recycle cash
- Runner: hold if break & hold first R HTF 90,248–91,969
- Invalidation: < 80,600 HTF Pivot Low or 96h no momentum
- Hedge (1x): Short first R HTF on rejection + bearish trend → neutralize below R
__________________________________________________________________________________
Multi-Timeframe Insights
__________________________________________________________________________________
Across the stack, structure is bearish with a corrective rebound; the 84.6k floor is the key battleground.
1D/12H group: Rejected 90–92k; drifting toward 84.6k. A clean ≥12H reversal at 84.6k could fuel a tradable bounce; failure exposes 80,619 then 79.1–79.6k.
6H/4H/2H group: Lower-high sequence intact; best sells at 88.5–89.0k and 90.2–92.0k. Breakdown retests under 86.0k stay valid with momentum.
1H/30m/15m group: Bounce is corrective into supply; very high volume printed on the leg down. Intraday long only on confirmed reversal at 84.6k; otherwise fade into resistance.
Major confluence: 84.6k is a tight 1D+30m floor cluster; 90.2–92.0k is dominant HTF supply. This confluence frames the range to harvest.
__________________________________________________________________________________
Macro & On-Chain Drivers
__________________________________________________________________________________
Risk-off impulses were amplified by yen-carry tremors and soft Asia data, while crypto flows remain mixed.
Macro events: BOJ tightening risk (2Y JGB near 1%) and USD/JPY volatility spilled into risk assets; FOMC/dot plot ahead can reset the volatility regime; energy/geopolitical tension adds a risk premium.
External Macro Analysis integration: The Dashboard flags the Risk On / Risk Off Indicator as BEAR with stress in credit (HYG) and high beta (ARKK) — this confirms the technical NEUTRAL SELL bias.
Bitcoin analysis: ~$4k air-pocket drop, ~$300M long liquidations; traders eye 82–80k on further stress versus an 88k reclaim to neutralize near-term risk; ETF 7d flows remain negative.
On-chain data: Liquidity thin; options skew defensive with heavy puts near 84k and elevated IV into December — rallies prone to fade without spot absorption.
Expected impact: Macro/on-chain backdrop supports a cautious, sell-rallies stance unless 88–88.5k is reclaimed and funding/spot absorption improves.
__________________________________________________________________________________
Key Takeaways
__________________________________________________________________________________
BTC is in a risk-off downswing, probing toward a high-quality 84.6k floor while HTFs remain bearish.
The trend is bearish-to-neutral below 90.2–92.0k; the most relevant setup is buying a confirmed 84.6k reversal or fading rejections at 88.5–89.0k and 90.2–92.0k. Macro risk from BOJ/FOMC and weak ETF flows argues for patience and tight risk. Stay methodical — harvest volatility, don’t chase.

BTC Playbook: Rebound into Supply, Cluster A Prime__________________________________________________________________________________
Market Overview
__________________________________________________________________________________
Bitcoin rebounded strongly from the 80k area and is now pressing into stacked higher-timeframe supply near 93k–96k amid thin liquidity and cautious macro flows. The short-term bounce runs into HTF headwinds while higher-quality demand sits lower.
Momentum: Bearish tilt within a corrective rebound; price is testing HTF resistance while higher-timeframe trend filters remain down.
Key levels:
- Resistances (HTF): 93,000–96,000 (12H/1D supply), 107,500 (1D pivot high)
- Supports (HTF/MTF): 91,000–91,300 (local pivot), 89,300 (240 PL), 84,600–82,600 (1D/12H floors)
Volumes: Very high on the daily rebound; normal to moderate intraday, which argues against chasing into supply.
Multi-timeframe signals: 1D/12H down; 6H/4H/2H neutral-to-down into resistance; 1H/30m up but at supply. This aligns with fading 93k–96k and reserving longs for deeper, confirmed floors.
Harvest zones: 80,600 (Cluster A) / 79,700–80,000 (Cluster B) — prime dip-buy area for inverse pyramiding if reached and confirmed.
Risk On / Risk Off Indicator context: Neutral Sell; it contradicts the short-term bounce and supports a cautious “sell rips, buy only quality dips” approach.
__________________________________________________________________________________
Trading Playbook
__________________________________________________________________________________
The dominant higher-timeframe trend is still down; adopt a tactical stance: fade 93k–96k unless the market reclaims and holds above it, and reserve dip-buys for confirmed floors.
Global bias: Neutral Sell while below 96,000; invalidation of the bearish tilt on a sustained 1D/12H close and hold above 96,000.
Opportunities:
- Tactical sell: Fade 93,000–96,000 rejections on a 4H/12H bearish close; targets 91,300 then 89,300.
- Breakout buy: Only on 1H/4H close and hold above 96,000; buy the retest toward 100k.
- Dip buy: 84,600–82,600 flush or 80,600–79,700 Cluster A with ≥2H bullish reversal; scale on confirmation.
Risk zones / invalidations: Clean acceptance above 96,000 invalidates near-term shorts; a daily close below 84,600 raises odds of revisiting Cluster A.
Macro catalysts (Twitter, Perplexity, news):
- CME outages and thin post-holiday liquidity raise whipsaw/gap risk, favoring patience at edges.
- Hard-asset strength (silver ATH; gold bid) and Eurozone disinflation support a rate-cut narrative but do not negate HTF supply overhead.
- US spot ETF 7-day flows are still negative, tempering risk appetite into month-end.
Harvest Plan (Inverse Pyramid):
- Palier 1 (12.5%): 80,600 (Cluster A) + reversal ≥2H → entry
- Palier 2 (+12.5%): 77,400–75,800 (-4/-6% below Palier 1)
- TP: 50% at +12–18% from PMP → recycle cash
- Runner: hold if break & hold first R HTF (96,000)
- Invalidation: < 79,700 (HTF Cluster A floor) or 96h no momentum
- Hedge (1x): Short first R HTF on rejection + bearish trend → neutralize below R
__________________________________________________________________________________
Multi-Timeframe Insights
__________________________________________________________________________________
Across timeframes, short-term momentum is fighting into higher-timeframe supply while the broader trend filters stay bearish.
1D/12H: Downtrend intact; price sits beneath the 96k daily Kijun and the 96k supply band. Acceptance above 96k is required to unlock 100k+.
6H/4H/2H: Neutral-to-down; the rebound leg is pressing 93k with layered supply up to 96k. Best risk-reward is fading into that band or waiting for deeper pullbacks.
1H/30m/15m: Up but at resistance; strong daily volume on the bounce helps, yet intraday signals should not override HTF filters at 93k–96k.
__________________________________________________________________________________
Macro & On-Chain Drivers
__________________________________________________________________________________
Macro remains cautiously supportive of hard assets, but market plumbing and liquidity are fragile, which can amplify moves at technical edges.
Macro events: CME outages/resumptions and a holiday-thin session increase gap/whipsaw risk; silver printed an all-time high and Eurozone disinflation aids rate-cut expectations; overall risk tone is mildly constructive but fragile.
Bitcoin analysis: Above roughly 91.5k, technicians eye a path toward upper resistance; 93k is the first gate, with a medium-term retrace band floated at 107k–117k if upside confirms.
On-chain data: Liquidity remains fragile with defensive positioning; options skew shows heavy puts near mid-80s and calls into 100k; elevated realized losses warn against chasing.
Expected impact: Technical bias stays Neutral Sell unless 96k is reclaimed; macro is a tailwind to hard assets but not yet strong enough to overrule HTF supply.
__________________________________________________________________________________
Key Takeaways
__________________________________________________________________________________
The market is in a corrective rebound into HTF supply.
- Trend: Broadly bearish on HTF while intraday momentum is positive into resistance.
- Setup: Fade 93k–96k on weakness; buy only confirmed dips at 84.6–82.6k or 80.6–79.7k.
- Macro: Hard-asset bid and disinflation help, but ETF outflows and thin liquidity argue for patience.
Stay nimble at the edges; wait for the market to show its hand at 93k–96k or on a quality drop into Cluster A.

EUR/GBP: Smart Money Unwinding Begins — The Pullback Trap1. Price Action (Daily Chart)
At the moment, EUR/GBP is moving through a bearish correction within a broader medium-term bullish structure. Price has cleanly rejected the 0.8800–0.8850 supply zone, which aligns with the upper boundary of the ascending channel.
The breakdown of the inner trendline and the daily close below the channel’s midline signal that momentum has shifted to sellers.
RSI is deeply oversold, so I expect a technical rebound before any continuation of the sell-off. The first level I’m watching for a retest is 0.8780–0.8800, a former support → now resistance.
As long as we remain below that zone, I maintain a short bias, targeting the 0.8680–0.8650 confluence, where the channel support, daily demand, and previous structural levels align.
A sustained reclaim above 0.8810–0.8830 would invalidate this scenario.
2. Sentiment (Retail Positioning)
Sentiment data shows 74% retail short and only 26% long.
As a contrarian trader, this makes me cautious about selling lows: the crowd is already on the move, usually late. This doesn’t invalidate the downside bias, but it reinforces the idea of waiting for a proper pullback before considering new short entries.
3. COT (Commitment of Traders)
The COT report sends a clear message: we may be entering a distribution phase on the cross.
On the EUR side, Non-Commercials remain strongly net-long (243k vs 135k) but are reducing long exposure.
On the GBP side, Non-Commercials remain net-short (79k vs 91k) and are aggressively cutting long positions.
This tells me the market had been positioned long EUR / short GBP, and is now unwinding that consensus — a classic signature of a correction after a mature bullish trend.
Commercials, as often seen at potential turning points, are doing the opposite: accumulating GBP and distributing EUR, suggesting that current EUR/GBP levels are no longer attractive from a hedging/fundamental standpoint.
4. Seasonality
November seasonality is historically moderately bearish for EUR/GBP across the 10-, 15- and 20-year studies.
December, on the other hand, shows a much stronger positive seasonal tendency.
For me, this creates a clear narrative:
• expected weakness into late November,
• potential accumulation zone in early December,
• likely seasonal recovery in the second half of the month.

BTC Playbook: 93k Pivot vs 98k Path__________________________________________________________________________________
Market Overview
__________________________________________________________________________________
Price is pressing into a well-defined 92,800–93,500 resistance band while macro leadership stays risk-off, making this a decision area. Momentum is rebuilding off 89k supports, but higher timeframes lean cautious until acceptance above 93,150.
Momentum: Bearish-to-neutral with a tactical counter-trend bounce; sustained strength needs a clean break-and-hold above 93,150.
Key levels:
- Resistances (HTF): 92,800–93,500 (240 Pivot High zone), 98,115 (W Pivot Low), 107,474 (D Pivot High)
- Supports (HTF/ITF): 90,500–90,800 (recent base), 89,012 (240 Pivot Low), 86,261 (240 Pivot Low)
Volumes: Moderate on 1D/12H; normal on intraday (6H/4H/2H/1H).
Multi-timeframe signals: 1D Up vs 12H/6H/4H/2H Down; intraday 1H Up but into HTF resistance. Defer to 12H Down unless 93,150 is accepted with persistence.
Harvest zones: 80,200 (Cluster A) / 76,600–77,100 (Cluster B) — ideal deep dip-buying areas for inverse pyramiding if market overreacts.
Risk On / Risk Off Indicator context: Neutral sell — confirms the cautious stance under resistance and argues for patience on longs.
__________________________________________________________________________________
Trading Playbook
__________________________________________________________________________________
The dominant read is neutral-sell into HTF resistance; adopt a reactive approach: fade failed breakouts, flip to long only on confirmed acceptance.
Global bias: Neutral-sell while below 93,150; bias flips constructive on ≥2H/4H acceptance above 93,150. Invalidation of the fade: sustained hold above 93,150.
Opportunities:
- Tactical sell: Fade 92,800–93,500 if 2H/4H prints rejection and volume fades; add on loss of 91,000 toward 89,012.
- Breakout buy: Engage on ≥2H/4H close above 93,150 with successful retest; first target 98,115.
- Reactive buy: Probe 89,012 only on strong reversal signal (≥2H) with improving volumes.
Risk zones / invalidations:
- Break below 89,012 would invalidate reactive longs and opens 86,261 risk.
- Sustained hold above 93,150 would invalidate shorts from the 92,800–93,500 fade zone.
Macro catalysts (Twitter, Perplexity, news):
- Liquidity tailwind: PBOC injections + equities <2% from ATH, but thin holiday liquidity can distort moves.
- ETFs: 7-day BTC spot ETF flows negative despite a small daily inflow — headwind near resistance.
- Rates: Elevated Fed cut odds support dips, but headline risks (stablecoins/geopolitics) can spark risk-off spikes.
Harvest Plan (Inverse Pyramid):
- Palier 1 (12.5%): 80,200 (Cluster A) + reversal ≥2H → entry
- Palier 2 (+12.5%): 75,400–77,000 (-6%/-4% below Palier 1) (Cluster B included) → reinforcement
- TP: 50% at +12–18% from PMP → recycle cash
- Runner: hold if break & hold first R HTF (93,150)
- Invalidation: < HTF Pivot Low (not provided) or 96h no momentum
- Hedge (1x): Short first R HTF (93,150) on rejection + bearish trend → neutralize below R
__________________________________________________________________________________
Multi-Timeframe Insights
__________________________________________________________________________________
Higher timeframes are mixed with 1D Up versus 12H Down; execution should respect the 12H filter until 93,150 is reclaimed with persistence.
12H/6H/4H/2H: Downtrend bias pressing into 92,800–93,500 supply; rejection here favors a rotation to 91,000 then 89,012. Acceptance and hold above 93,150 unlocks 98,115.
1D/1H: 1D Up but capped by 93,150; 1H Up is counter-trend into HTF resistance, so expect chop under 93k unless volume expands on breakout.
Confluences/divergences: Persistent HTF resistance at 93,150 aligns with risk-off macro; 1D strength is an exception that requires flow/volume confirmation to extend.
__________________________________________________________________________________
Macro & On-Chain Drivers
__________________________________________________________________________________
Macro is cautiously constructive on liquidity, but BTC-specific flows are not yet a tailwind, keeping technical resistance meaningful.
Macro events: PBOC liquidity injections aid risk; S&P 500 near ATH with thin US holiday liquidity; elevated cut odds into December create a soft landing narrative but headline risk persists.
Bitcoin analysis: BTC reclaimed 90k with negative/neutral funding; overhead supply 91.9–93k; ETF 7-day flows negative, dampening confidence at resistance.
On-chain data: Liquidity pockets discussed around low 80ks; heavy puts near mid-80ks; recovery impulses need stronger demand inflow and key cost-basis reclaims.
Expected impact: If ETF flows stabilize and price accepts above 93,150, path opens toward 98,115; otherwise the 92,800–93,500 zone favors tactical fades.
__________________________________________________________________________________
Key Takeaways
__________________________________________________________________________________
BTC is testing a critical resistance while macro risk-on is tentative and flow support is uneven.
- Trend: Neutral-to-bearish below 93,150; constructive only on confirmed acceptance above.
- Setup: Fade 92,800–93,500 rejections; switch long on ≥2H/4H hold above 93,150 targeting 98,115.
- Macro: ETF 7-day flows remain negative, capping conviction at resistance despite broader liquidity support.
Stay patient at the boss gate; wait for a clean unlock above 93,150 or harvest the rejection.

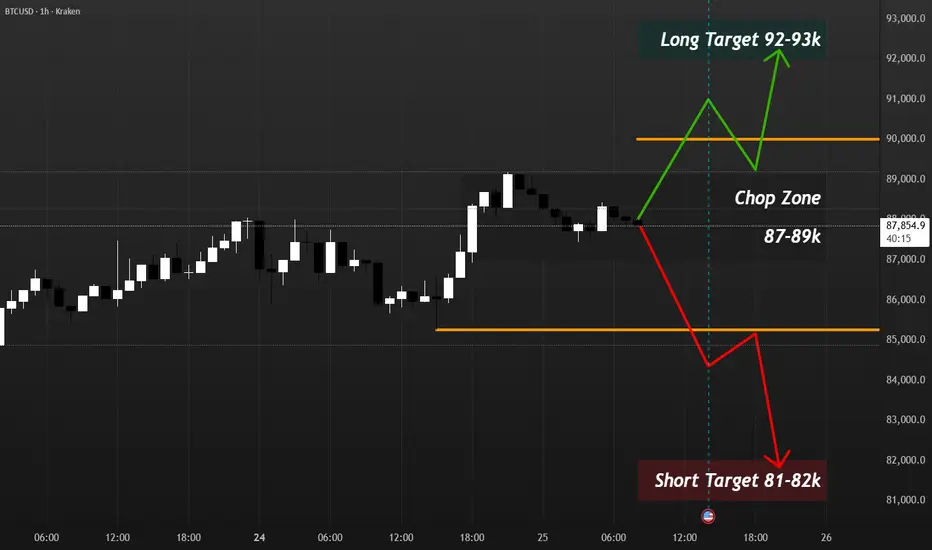
BTC FED Week Map - Daily WrapNo trades for the second day: BTC stayed inside the 87–89k chop zone and the weekly roadmap is unchanged.
Key levels into the FED:
• 90k – squeeze line; post-FED acceptance above opens room toward 92–93k.
• 85.3k – breakdown line; clean loss + failed reclaim points toward 82–81k.
• 87–89k – intraday no-trade box until the dust settles.
Flat into the event. Map, not signal.
If you find this intraday map useful, hit 👍 and follow for updates.
Share your alternative levels or invalidation ideas in the comments — I’m here for discussion, not signals.

GBPUSD | Opportunities Before UK Autumn Budget DataMacro approach:
- The pound appreciated against the US dollar as markets focus on the UK Autumn Budget and shifting expectations for US data and Fed policy this week.
- The UK Autumn Budget is the key event, with uncertainty over possible tax rises and spending cuts undermining confidence and keeping the pound under pressure. Recent data showing UK inflation easing to about 3.6% in Oct has boosted expectations of a BoE rate cut in Dec, which also weighs on the pound.
- On the US side, expectations for a Fed rate cut in Dec have climbed to 80%, putting downward pressure on the US dollar and US yields.
- Contrarian view: while the upcoming UK Autumn Budget (scheduled for 26 Nov) is a significant risk, the negative sentiment may have been fully "priced in" by earlier declines. Markets are in a "wait-and-see" mode. The lack of fresh negative news today has allowed the pound to stabilize and edge higher as traders square positions before the actual budget announcement.
Technical:
- GPBUSD is retesting the broken descending trendline, which is slightly above the key support at 1.3100. The price is between both EMAs, awaiting a clear breakout to determine the short-term trend.
- If GBPUSD breaches above EMA78, the price may continue heading toward the following resistance at 1.3215.
- Conversely, closing below the key support at 1.3100 may prompt a downward momentum to retest the previous swing low at 1.3040.
Analysis by: Dat Tong, Senior Financial Markets Strategist at Exness

Bitcoin 2026History doesn’t repeat like a record player — but it rhymes.
By tracking patterns critically (not fatalistically), we can:
1. Spot early warnings of past mistakes.
2. Identify where old models fail or not.
3. Make more informed choices about the future.
I'll make 12 updates ahead and we will find out how this patterns works in case of btc/usd.
Key Questions to Test Over 12 Months
Do halving cycles still drive price action, or has the market “priced it in”?
Does BTC is still just a “risk tech” (correlated with Nasdaq)?
Core Metrics to Track Monthly
a) Price & Volatility
BTC/USD closing price (monthly average).
30‑day volatility (standard deviation of daily returns).
Compare to past cycles (2013, 2017, 2021 peaks/bottoms).
b) On‑Chain Activity
Active addresses (network usage).
Exchange inflows/outflows (signaling accumulation vs. selling).
Hash rate (miner confidence).
c) Macroeconomic Context
U.S. inflation rate and Fed policy (interest rates, QT/QE).
Global liquidity conditions (M2 money supply, T‑bill yields).
Risk‑on/risk‑off sentiment (S&P 500, gold, USD index).
d) Regulatory & Adoption Shifts
New crypto regulations (U.S., EU, Asia).
Institutional adoption (spot ETF flows, corporate treasury allocations).
Tech updates (Bitcoin protocol changes, Lightning Network growth).
Meanwhile we will focus on charts.
The information and publications are not meant to be, and do not constitute, financial, investment, trading, or other types of advice or recommendations.

FED days are for levels, not direction.FED days are for levels, not direction. Above 90k I respect the squeeze; below 85.3k I respect the breakdown. Map, not signal.
KRAKEN:BTCUSD BTC is chopping around 88k just under a 1h channel top into FED today/tomorrow. ETF flows look soft and options positioning still leans defensive.
I’m not opening new trades into the announcement. Anything stuck between 87–89k post-FED is a no-trade chop zone for me.
Post-FED: if BTC holds above 90k I’ll only look for pullback longs with 92–93k as context; if it loses 85.3k and can’t reclaim, I’ll lean into shorts toward 82–81k. Map, not signal.