NVDA Head and Shoulders- Dec Rate Cuts has changed setupNvidia’s setup has shifted. With the Fed signaling a likely rate cut on December 10th, the market will start baking that optimism into asset prices ahead of time. When monetary conditions ease, high-valuation tech often gets an extra tailwind, which means the expected head-and-shoulders pattern on NVDA may fail to play out cleanly. The chart might still roll over, but the macro backdrop now works against a decisive breakdown. Short positions here demand caution.
Original post
Nvidia’s bear case rests on one core idea: the stock price assumes a flawless, world-eating AI future, and markets almost never deliver on “perfection narratives.” NVDA trades at extreme valuation multiples for a hardware-driven, highly cyclical business. Those multiples only hold if AI infrastructure spending keeps compounding at its current breathtaking pace for years. But that demand is dangerously concentrated in a handful of hyperscalers who are spending now and rationalizing later. Michael Burry’s recent argument sharpens this point: he claims true end-demand for AI horsepower is vastly overstated, and that much of the current GPU frenzy is a self-reinforcing loop of capital, hype, and accounting gimmicks rather than broad, organic need. If boards pause to question real ROI, or if the circular funding loop breaks Nvidia’s revenue curve can flatten quickly, dragging the valuation down with it.
Competition, long dismissed by NVIDIA bulls, is another structural headwind. AMD is now shipping accelerators that hyperscalers are actually integrating, and every major cloud provider is building in-house silicon to reduce dependence on NVDA’s margins. Even if Nvidia maintains leadership, it doesn’t need to lose the crown to lose the multiple, slight shifts in workload allocation or a handful of missed design wins are enough to pressure margins. And Burry’s critique deepens this point: he argues Nvidia’s reported profitability is flattered by depreciation assumptions and massive stock-based compensation that buybacks have failed to offset, meaning the “true” economic profit is less bulletproof than headlines suggest. Add to that the fact that U.S. export controls have effectively erased the China data-center market, once 20–25% of revenues and expectations of a seamless global TAM look increasingly unrealistic.
Technically, NVDA is doing exactly what a euphoric, overowned stock does when gravity starts tugging: momentum is fading, the price is slipping under short-term moving averages, and reactions to spectacular earnings have been strangely sluggish. That’s often the early signature of distribution rather than accumulation. And this lines up directly with Burry’s broader thesis: when a narrative becomes crowded and reflexive, the slightest wobble triggers violent air pockets. NVDA has become the ultimate proxy for the AI boom, the most crowded long in the market, meaning it’s the first thing funds sell when risk appetite cools, and the last thing buyers chase during corrections.
Put simply, Nvidia is a phenomenal company priced as if nothing can ever go wrong, while Burry is arguing that much of what looks “perfect” is not what it seems. The bear case isn’t that Nvidia collapses. It’s that the AI boom normalizes, competition accelerates, accounting realities catch up, margins slip toward something earthbound, and investors recalibrate how much they’re willing to pay. In that world, NVDA doesn’t need bad news to fall. It only needs the news to arrive slightly less euphoric than the fantasies currently baked into the price.
#NVDA #Bearish #HeadandShoulders #MichaelBurry
Fed

BTC 1D: watching 64–73k box for Nov 25–26 FED weekBearish channel intact unless 80k is reclaimed. Map, not signal.
Key idea: the bearish channel guides price into 64–73k. If we drift there by Nov 25–26, FED could trigger the next major move.
Not advice: I act only if price respects the box and vol/volume confirm. Until then this is a roadmap, not a signal.
Which side of 64–73k breaks first?

S&P500 crashes! Due relief rally or further pain?Nvidia delivered impressive earnings, but the stock reversed and closed nearly 3% lower, triggering heavy selling across tech and risk assets as odds for a December rate cut have collapsed to just 34%, with policy uncertainty amplified by the cancelled October NFP report. Despite a strong market and rising unemployment in September's NFP report, traders remained defensive and fuelled the declines.
Key drivers:
Nvidia beat earnings, but post-report selling intensified sector losses.
The Fed’s odds for a December rate cut have dropped to 34%, amplifying caution.
The abrupt cancellation of the October NFP means the market lacks fresh labour data, fuelling defensive positioning.
S&P 500, Nasdaq, and Bitcoin broke major supports, confirming risk-off conditions.
Right now, the S&P 500 has broken below channel support near 6,600 and failed to climb back in. If prices stay below this threshold, expect another sharp move lower targeting 6,500 and possibly 6,350. There’s potential for upside, given momentum divergence on the RSI 4-hour chart. If we see a short-term bounce and a return to the channel, a move toward 6,682 is possible, which sets up a tactical short opportunity.
Trade idea:
Entry: Midpoint of 23.6/38.2 Fibonacci (6,655–6,682 area)
Stop-loss: Above 61.8% Fib (6,775)
Take Profits: TP1 6,500 (recent low/support), TP2 6,440 (major support), TP3 trail stop to 6,170 (long-term support)
Risk-off drivers are in control. Earnings reversals, Fed uncertainty, and cancelled NFP data are fuelling this price action. Technically, it comes down to whether we see a return inside the channel for a relief bounce or a sharp continuation downward.
Watch your levels, remain nimble, and let fundamentals and technicals, not emotions, guide your trade.
Let me know your setups in the comments, and follow for more high-action technical and macro trade ideas.
This content is not directed to residents of the EU or UK. Any opinions, news, research, analyses, prices or other information contained on this website is provided as general market commentary and does not constitute investment advice. ThinkMarkets will not accept liability for any loss or damage including, without limitation, to any loss of profit which may arise directly or indirectly from use of or reliance on such information.

US500 retreated on a hawkish Fed shift and a tech-sector fall
September nonfarm payrolls rose by 119k (cons. 51k), but August was sharply revised down to -4k from 22k, while continuing jobless claims increased by 28k from the prior week. The unemployment rate climbed to 4.4% (prev. 4.3%, cons. 4.3%), the highest in four years, further weighing on sentiment.
Fed commentary added to the pressure. Cleveland Fed President Mester noted that, despite signs of labor-market cooling, inflation remains elevated. Chicago Fed President Goolsbee also cautioned that inflation has not yet reached the 2% target, signalling reluctance toward additional rate cuts.
Today’s PMI and consumer expectations data will be key indicators of current US economic conditions.
US500 broke below the lower boundary of the ascending channel, extending its sharp decline. The diverging bearish EMAs indicate a potential continuation of the downtrend.
If US500 breaks below 6500, the index could retreat toward the next support at 6430.
Conversely, if US500 closes above 6650, where EMA21 intersects, the index may advance toward the following resistance at 6700.

NZDJPY: Premium Short Setup Below 89.00 – Seasonality + COT1. Macro Outlook
NZDJPY remains a cross strongly driven by risk dynamics: NZD typically behaves as a risk-on currency, while JPY is a classic risk-off safe haven. The current global environment — characterized by slowing economic momentum, yield volatility, and speculative position rotation — generally supports downside pressure on the cross, although with less linearity compared to the previous quarter.
2. COT (Commitments of Traders)
JPY
Non-commercial traders remain clearly net-long JPY, reflecting a structural preference for Yen strength.
However, weekly changes show:
• –8,589 long contracts closed
• +9,446 new short contracts added
→ This indicates profit-taking and a reduced bullish aggressiveness on the Yen.
NZD
Speculators remain heavily net-short NZD (44k shorts vs 23k longs).
But last week’s flows show:
• +11,287 new longs
• +10,792 new shorts
→ A rebalancing phase rather than a trend reversal; signals uncertainty.
COT Conclusion:
The structural bias remains bearish for NZDJPY, but the pro-Yen speculative impulse is slowing. This increases the likelihood of a short-term bullish retest before further downside continuation.
3. Seasonality
JPY
Historically strong in November–December.
NZD
Neutral-to-weak in November; slightly positive in December but unstable.
The seasonal differential favors NZDJPY weakness between late November and early December, consistent with a move back toward autumn lows.
4. Retail Sentiment
• 83% short
• 17% long
This extreme bearish clustering among retail traders increases the probability of a short-term upside squeeze before macro-consistent downside resumes.
Implication:
⚠️ Avoid selling in the middle of the range
✔️ Only sell from premium levels and with confirmation
5. Price Action
Since August, the pair has been trading inside a structural 84.8–89 range, with highs losing quality and repeated lows — a classic distributive profile.
The recent bounce into 88 pushed price back into upper supply without breaking bullish structure, creating an ideal setup for selling rallies.
RSI remains neutral/slightly bullish but fails to confirm a new high, suggesting a potential bearish divergence that supports the short bias.
🔻 Primary Bias: SHORT below 88.70–89.00

USDJPY breakout: Can the rally extend toward 155?The dollar-yen pair smashed through 150 with one of the strongest breakouts recently, confirming a new technical phase as it trades above the 61.8% Fib retracement. Here’s what’s fuelling the move and what traders should watch next:
Dollar strength returned as safe haven flows dominate, even with a US government shutdown, while Japan’s new prime minister’s dovish signals are sending the yen into freefall.
Key drivers
Safe haven flows : Investors seek shelter in the dollar as global uncertainty rises; DXY index hit a 6-week high.
Yield differentials : The Fed/BOJ spread powers further carry trade buying as Japanese rates remain ultra-low.
Japanese political shift : PM Takaichi’s win spurs fiscal stimulus and pushes back market hopes for BOJ tightening, deepening yen weakness.
Technical breakout : Clean break above multi-year resistance and 61.8% Fibonacci retracement; watch for support validation and continuation toward the next 78.6% Fib at 154.80.
What to watch
Holding above 150 and 61.8% Fib support sets the stage for a bullish continuation.
Profit taking is possible near 153.25–154.80, as RSI shows signs of overbought.
Tonight’s FOMC minutes, Thursday’s BoJ/Ueda speech, and political headlines could trigger sharp moves.
Cross-pair momentum : EURJPY at record highs, GBPJPY surging, confirming broad-based yen weakness.
The bulls are in control as long as USDJPY stays above 151.15–150.50. Pullbacks to support offer opportunities to buy dips, with 154.80 as the next bullish target. Keep stop losses disciplined, and don’t ignore the chance for sharp reversals if intervention or a dramatic shift in sentiment emerges.
For more actionable FX insight, follow ThinkMarkets.
This content is not directed to residents of the EU or UK. Any opinions, news, research, analyses, prices or other information contained on this website is provided as general market commentary and does not constitute investment advice. ThinkMarkets will not accept liability for any loss or damage including, without limitation, to any loss of profit which may arise directly or indirectly from use of or reliance on such information.

Gold softens after Fed minutes as smokestacks cap every rally Is there any way we can get a December rate cut now?
Gold has softened after the release of the minutes from the Federal Reserve's last interest rate decision.
The minutes show there’s no unified push toward cutting, which could make a December move unlikely.
Several Federal Reserve officials supported lowering rates in October, but others preferred keeping policy unchanged, and some pushed back firmly against easing.
Technically, XAUUSD continues to form smokestacks, printing repeated double-top structures. The price is now hovering around 4,070, sitting under possible short-term resistance at 4,150. XAUUSD losing the 50-day MA further could shift bias more decisively lower.

NVDA Earnings, FOMC Minutes, US Non-Farm OH MY!!!All eyes on NVDA and earnings - they matter (a lot)
More important than a beat or miss is the price action around NVDA earnings
-bulls have a long ways to go to reclaim all-time highs
-bears have pressured NVDA enough that it seems like major support could break
FOMC Minutes today
-CME Fed Watch Tool is literally 50/50 on the December rate cut outlook
-if the FED doesn't cut in December, they will likely be cutting in early 2026
US Employment Data
-Remember Non-Farm Payroll? Well it's back with a Thursday release
-58k forecasted, 4.3% unemployment forecasted
-let's see how the release is taken by the markets
Although it feels like "the brink" in many ways, my thoughts as expressed in the video
are I believe the market can win both ways and just provide wild volatility but no real direction or follow through. Negative sentiment is truly awful and it rarely rewards the bears with a sustainable down move. Seasonality is expected but perhaps bulls have grown too complacent. Therefore, the market is comfortable making everybody uncomfortable
More to come later this week when the smoke clears or the dust settles
Thanks for watching!!!
CP

EURUSD Breakout and Potential RetraceHey Traders, in today's trading session we are monitoring EURUSD for a buying opportunity around 1.15700 zone, EURUSD was trading in a downtrend and successfully managed to break it out. Currently is in a correction phase in which it is approaching the retrace area at 1.15700 support and resistance area.
Trade safe, Joe.

USDCAD: Patient Fed & oil drop support iH&S projection to 1.4370USDCAD is building an interesting medium-term setup as crude oil weakness combines with Fed patience and supports dollar strength against the loonie, with an inverse head-and-shoulders pattern pointing to a measured-move target near 1.4370.
Crude oil recently broke below $60, directly pressuring the Canadian dollar since Canada is a major commodity exporter. Meanwhile, the Fed's cautious stance on rate cuts, despite labour market softness ahead of a potential partial NFP on Friday, keeps the buck bid as investors hold dollars for yield.
The technical structure confirms what the macro backdrop suggests: USDCAD has room to run higher from current levels.
Key drivers
Oil breakdown hurts CAD: crude slipped below $60 recently, and every time oil weakens, the commodity-linked loonie follows. This correlation has been tracking cleanly since July, when USDCAD turned higher alongside the energy sell-off.
Fed patience supports USD: Despite labour-market weakness signals from existing data releases, the Fed isn't rushing to cut in December, and a patient central bank typically supports the dollar because investors can hold dollars and earn decent carry while awaiting clarity on policy.
Inverse H&S pattern: The technical setup shows a head near 1.3537, a neckline breakout near 1.3900, and a clean retest at 1.3985 (former 2022 resistance turned support). The measured move from head to neckline brings 1.4370 into play, with intermediate targets at swing levels.
RSI reset above 50: After showing flat divergence at the recent highs, the RSI has reset by bouncing cleanly off the 50 line on the daily chart, suggesting momentum has room for another leg higher before any overbought concern.
Use 1.3985 as your line in the sand, consider longs above this level with the first target at the peak of 1.4145 (validation of the breakout), the second at 1.4250, and trail stops toward 1.4370 if momentum holds. Watch for oil to remain below $60 and Fed messaging to stay cautious, as a daily close below 1.3985 would shift the bias to consolidation, while full pattern invalidation sits at 1.3720.
This content is not directed to residents of the EU or UK. Any opinions, news, research, analyses, prices or other information contained on this website is provided as general market commentary and does not constitute investment advice. ThinkMarkets will not accept liability for any loss or damage including, without limitation, to any loss of profit which may arise directly or indirectly from use of or reliance on such information.

DXY firmed between the hawkish Fed and Waller call of cuts.
The dollar strengthened despite the contrast between the Fed’s overall hawkish tone and Waller’s support for rate cuts.
Cleveland Fed President Hammack noted that policy must remain somewhat restrictive to bring inflation back to target, while St. Louis Fed President Musalem also emphasized that any policy easing should proceed cautiously.
In contrast, Fed Governor Waller said he is not concerned about a renewed acceleration in inflation and argued that several months of labor-market softness justify additional rate cuts. He added that tariffs are unlikely to have a lasting impact on inflation and that restrictive policy is increasingly weighing on the economy, particularly on lower- and middle-income households.
DXY briefly tested the support at 99.30 before climbing above both EMAs. The converging EMAs indicate a potential shift toward a bullish trend.
If DXY closes above both EMAs, the index may advance toward 99.80.
Conversely, if DXY breaks below both EMAs and 99.30, the index could retreat toward the next support at 99.00.

US500 slipped on AI-bubble fears and the Hawkish Fed
Stocks weakened last week as the Fed’s revived hawkish tone and mounting concerns over stretched AI valuations outweighed strong earnings from major AI names.
Despite upbeat 3Q results, fears of an AI bubble continued to build. AMD CEO Su highlighted insatiable demand for AI chips, projecting the data-center market to reach 1tln USD by 2030 and forecasting an average annual growth rate of 35% for AMD over the next five years.
Morgan Stanley warned of an impending power shortage within a year as AI expansion accelerates. while Microsoft CEO Nadella pointed out that the biggest bottleneck is not compute capacity but power, noting that parts of the company’s GPU inventory lack sufficient power connectivity.
US500 briefly retested the support at 6650 before rebounding. EMA21 has death-crossed EMA78, indicating a potential shift toward a bearish structure.
If US500 fails to close above the support at 6700, the index could retreat toward 6650. Conversely, if US500 breaches above both EMAs and the resistance at 6800, the index may advance toward the following resistance at 6920.

BITCOIN 2025 - MAKE OR BREAKBTC is coiling. Liquidity is tightening. Momentum is fading. The market is soon to decide whether we break higher toward the next resistance leg… or lose key support and trigger a broader correction.
Two key dates stand out: November 6 and November 17.

USDCAD: Institutions Accumulating? Perfect Pullback Into FVG1. MACRO & COT FRAMEWORK
COT – CAD
→ Speculators remain heavily net short on CAD.
The Canadian dollar shows a massive net-short imbalance, exceeding 100k net contracts.
Speculators are still selling CAD aggressively → supportive for upside continuation on USD/CAD.
COT – USD
→ USD is still net short overall, but positioning is shifting.
The dollar is beginning to reverse positioning: fewer shorts + more longs = improving USD strength.
→ Overall COT environment favors further upside for USD/CAD.
2. RETAIL SENTIMENT
Retail Longs: 51%
Retail Shorts: 49%
Retail is almost evenly split, slightly long.
This is mostly neutral, but historically, when sentiment is balanced, price tends to follow institutional flows → which remain long USD/CAD.
Sentiment confirms a bullish bias.
3. SEASONALITY (USD/CAD – November)
November is historically a slightly bullish month for USD/CAD.
The 20-year, 15-year, and 10-year composites all show a positive seasonal tendency.
The current month is tracking a similar pattern.
Seasonality supports a long bias into the second half of November.
4. TECHNICAL ANALYSIS
The pair remains in a structurally bullish uptrend with a clean ascending channel.
Higher highs and higher lows confirm trend integrity.
Price is currently correcting toward the mid-range of the channel.
The market is entering a Daily FVG between 1.3950 – 1.3980.
A prior sweep has already tapped the lower trendline, adding confluence.
Immediate Support Zone
1.3950 – 1.3980 (FVG + structural support)
→ ideal area for long accumulation.
Upside Target:
1.41500 → clear liquidity level above previous swing high.
RSI remains above 40 and cooling off, indicating a healthy pullback within a bullish trend.

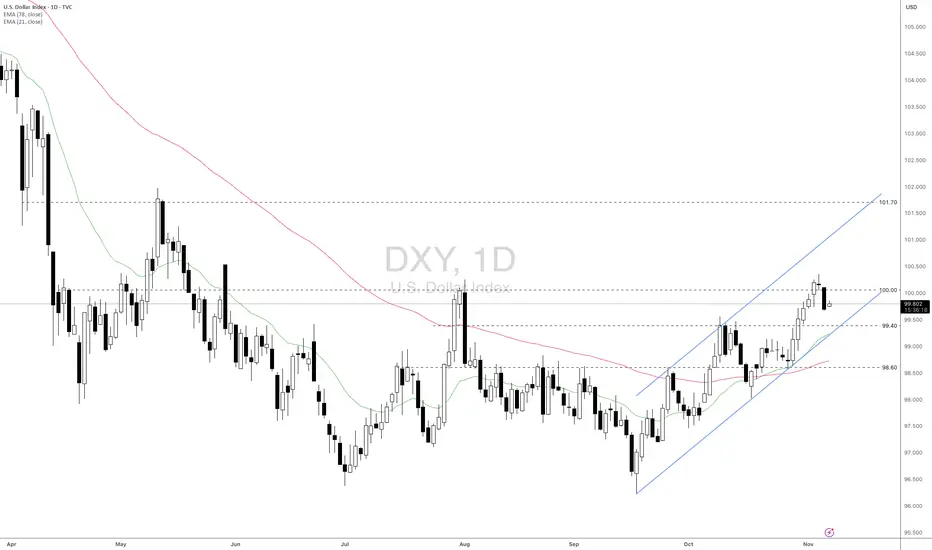
DXY: Is it going to break the 100 level or not?Fundamental approach:
- The US Dollar Index (DXY) traded sideways this week amid stronger global risk sentiment and fading demand for safe-haven assets. The continued US government shutdown delayed key data releases.
- At the same time, the ISM Services PMI rose to an eight-month high, and the ADP report showed stronger-than-expected private job gains, supporting a cautious Fed outlook on further rate cuts. Nevertheless, weak consumer sentiment and rising weekly jobless claims reinforced downside pressure on the dollar index.
- Underlying drivers this week included mixed US data, with upbeat labor and service sector figures contrasting with deteriorating consumer and business sentiment. Investors trimmed bets on imminent Fed rate cuts.
- Looking forward, the DXY may remain heavy as long as safe-haven demand stays muted and official US data is delayed due to the shutdown.
Technical approach:
- DXY retested the psychological level at around 100 and rejected. The price is above both EMAs, indicating upward momentum is still intact.
-If DXY remains below 100, the price may retest the following support at 99.40, which is confluenced with the lower bound of the ascending channel.
- Conversely, breaching above 100 may prompt a conviction to retest the next resistance at 101.70.
Analysis by: Dat Tong, Senior Financial Markets Strategist at Exness
The dollar softens as weak data boosts Fed rate-cut expectations
According to ADP data, US companies laid off an average of 11,250 employees per week in October, reaffirming how quickly labor market conditions have softened over the past two weeks.
Meanwhile, the NFIB Small Business Optimism Index fell for a second straight month to 98.2 (prev. 98.9, cons. 98.3), marking the lowest level since April’s reciprocal tariff announcement. The NFIB noted that the government shutdown and tariffs have weighed on business sales.
The dollar may stay range-bound, awaiting fresh price catalysts between hopes for a shutdown resolution and further Fed rate cuts.
DXY briefly tested the ascending channel's lower bound before rebounding slightly. The index remains between both EMAs, suggesting a potential extension of the consolidation trend.
If DXY closes above EMA21, the index may advance toward the following resistance at 99.80.
Conversely, if DXY breaks below EMA78 and the support at 99.50, the price could fall below the channel’s lower bound.

EURAUD: Institutional Buying Pressure & Bullish November SetupThe pair has broken out of the descending channel and is now forming a new ascending structure.
Price reacted strongly from the 1.7550–1.7600 demand zone, which aligns with a key structural support and an oversold RSI area.
The current consolidation phase is unfolding below a daily inefficiency (gap) around 1.7800–1.7920, which represents the first bullish target.
If the bullish structure holds, we could see a three-wave move towards 1.7920, with a potential mid-term pullback to 1.7700 before the next impulsive leg.
🔹 2. COT Report
Euro (EUR)
Non-commercials: 252k long vs 138k short → net long
Commercials: strongly net short
Weekly change: +2.6k shorts / -789 longs → slightly reduced bullish momentum
➡️ EUR remains fundamentally strong, though speculative momentum has slightly cooled.
Australian Dollar (AUD)
Non-commercials: 42k long vs 101k short → deeply net short
Shorts increased by +10k this week, indicating renewed institutional bearish pressure.
➡️ AUD remains weak with a clear bearish bias.
👉 Overall COT bias: favors EUR strength and AUD weakness, supporting a bullish view on EURAUD.
🔹 3. Seasonality
EUR typically strengthens in November, especially during the last 10 days of the month (+0.003 / +0.004 average).
AUD historically shows November weakness across 10Y, 5Y, and 2Y averages.
➡️ Seasonal patterns support the bullish case for EURAUD, aligning with COT positioning.
🔹 4. Retail Sentiment
70% short vs 30% long
➡️ Retail traders are heavily short, providing a contrarian bullish signal.
📈 Conclusion
The medium-term bias remains bullish on EURAUD, with potential upside extension toward 1.7920, and possibly 1.8050 if macro momentum persists.
The key support to defend lies at 1.7600 / 1.7550.
A daily close below this level would invalidate the bullish scenario and reopen the path toward 1.7400.

EUR/USD at the Edge: Bounce Before Breakdown?🧩 Macro & COT Context
(Note: data frozen as of September 23 due to CFTC shutdown)
The latest available COT report showed non-commercial traders still net long on EUR (≈ +114K contracts), but with a steady increase in both commercial longs (+4.9K) and commercial shorts (+3.3K) — signaling a more balanced positioning. Meanwhile, the USD Index showed a slight pickup in long exposure (+1.5K), hinting at a gradual shift toward USD strength until updated data resumes.
💭 Sentiment
Retail traders are 67% short vs 33% long, a typical contrarian setup where the crowd is selling the pullback. This supports a short-term bullish bounce, but only until the next supply zone is reached.
📈 Seasonality
Historically, November has been a neutral-to-bearish month for EUR/USD (-0.0021 on 20Y average; -0.0063 on 10Y). The pair tends to weaken during the second half of the month, before recovering into December.
📊 Technical Structure (Daily Chart)
Price remains inside a descending channel since late September, recently retesting the upper boundary and supply area at 1.1570–1.1710, where a clean rejection formed.
RSI holds below the midline (~45), confirming weak momentum.
The overall structure stays bearish, with room for continuation toward the 1.1380–1.1400 demand zone, aligning with both channel projection and liquidity targets.
Main Bias: Short continuation
Sell Zone: 1.1570–1.1620 (upper channel + supply)
Target 1: 1.1400
Target 2: 1.1350 (weekly liquidity pool)
Invalidation: Daily close above 1.1715
Summary
📊 COT (last update): EUR still net long → neutral bias until new data
📉 Seasonality: Historically weak November
📈 Sentiment: Retail short → short-term bullish bounce possible
🧭 Technical Bias: Bearish below 1.1715

Home Rate Trends - US30YIf you are htinking about buying a house or refinancing. This is the chart for you.

10/11/25 Weekly OutlookLast weeks high: $110,732.65
Last weeks low: $98,972.09
Midpoint: $104,852.37
Bitcoins price action of last week tells an interesting story. The first trading hour of the week marked the weekly high, a sharp decline towards HTF support at $99,000 marked the weekly bottom, to finish the week a late surge recovered some of the losses to end the week at the range midpoint.
The double bottom at range low is a good sign for the bulls in a must win contested area around the $100,000 mark, not only is it a big even level but a HTF key S/R level too. Should the bulls lose this weekly low it opens the door to a $92,000 retest.
For the bulls should this rebound persist a flip of $108,000 is key but there is certainly a lack of spark in the markets at the moment.
I don't see the bulls making any significant ground until the US Government shutdown is announced to be coming to an end. This announcement could happen at any time and so this week that's what I am making plans for, how will the market react, volatility on announcement etc...
Good luck this week everybody!

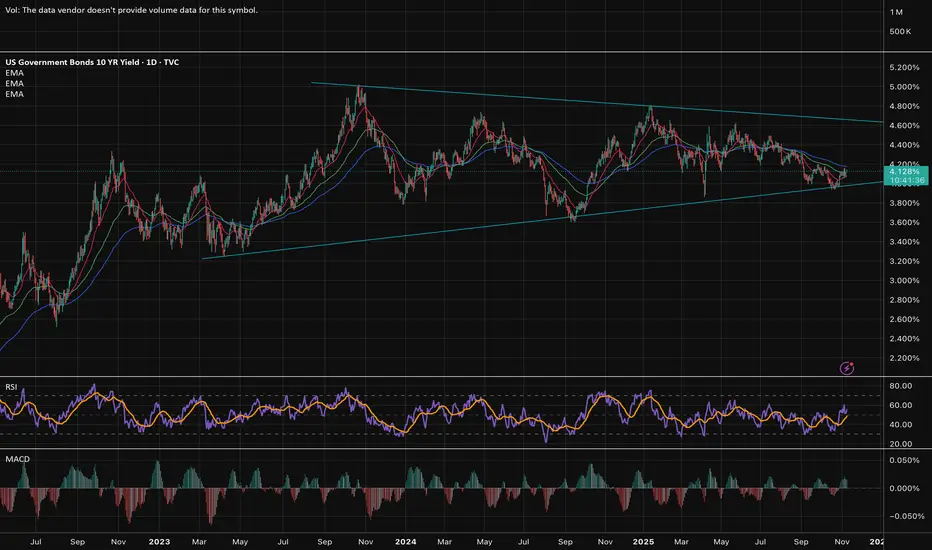
US10YThe market still can't figure out what to make of COVID. Continuing to coin in this 3 year long consolidation phase.
The Real DealWhile global markets fixate on AI and the Fed’s next move, a quieter but equally powerful story is unfolding in Brazil. The real is back in the spotlight, underpinned by some of the highest real yields globally, resilient fundamentals, and a shifting trade order that could reshape currency flows in the quarters ahead.
Figure 1: BRLUSD
BRL recently broke above the neckline of a multi-month ascending triangle but has since recovered, trading back within the pattern. A more decisive break above could signal renewed BRL strength. The COVID-19 era saw the BRL fall to historic lows as Brazil faced a fiscal and health crisis, only partially recovering as global liquidity loosened in 2020–2021. More recently, BRLUSD hit record lows again, breaching 0.1600, before stabilizing as the policy backdrop shifted.
Figure 2: BCB’s Rate Hike
Amid resurgent inflation, BRL depreciation, and fiscal expansion, the Central Bank of Brazil (BCB) raised rates aggressively through the second half of 2024, adding 450 basis points in total.
Figure 3: Persistent Inflation
Strong domestic demand, supported by fiscal spending, wage growth, and a tight labor market, reignited inflation in 2024. With the added risk of higher import prices from tariffs, both headline and core inflation remain above the bank’s 3.0% target and the upper tolerance band of 4.5%. In the latest meeting, the BCB maintained its headline inflation forecasts for 2025 and 2026 at 4.8% and 3.6%, respectively.
Figure 4: Modest Growth
Tight monetary conditions have weighed on sentiment. The Business Confidence Index has been trending lower since early 2025, while the Leading Economic Index, which is commonly used to predict future economic turning points, has been negative since May. GDP growth remains resilient for the first half of 2025, but data from the IBC-BR Economic Activity Index, which is widely used as a preview of the GDP figures, suggest moderation is underway.
Figure 5: A Robust Labor Market
With unemployment at a historic low of 5.6%, and strong wage growth, consumer spending remains a key engine of growth. However, rising inflation has eroded purchasing power, limiting real wage gains.
Figure 6: Central Bank Rates
The BCB has stated it will keep the Selic rate at its current restrictive level “for a very long period” to guide inflation back to target and is ready to hike again if needed. This stance has widened interest rate differentials between Brazil and most developed markets. Meanwhile, the Fed’s first rate cut of the year has reinforced this divergence, as it shifts toward balancing labor market risks with persistent inflation while staying data dependent.
Figure 7: Silver Lining in the Current Trade Climate
On April 2, U.S. President Donald Trump declared “Liberation Day” as he announced sweeping tariffs. In August, a 50% tariff was imposed on Brazilian goods (an additional 40% on top of the existing 10%). Despite the apparent threat, Brazil’s trade balance remains in surplus, with exports continuing to grow. Since only 12% of its exports went to the U.S. in 2024, Brazil appears to be relatively insulated from the worst effects.
Recent diplomatic signals between Trump and President Lula have been positive,, while shifting global trade flows present structural opportunities for Brazil. As countries diversify away from the U.S., Brazil has solidified its standing as a key supplier to China and is well-positioned to deepen regional integration and potentially accelerate trade agreements with partners like the European Union.
Putting the Pieces Together
While the market has been focusing on AI-tech, cryptocurrency and precious metals, the high real interest rates, resilient domestic demand, and a shifting trade landscape have brought renewed attention to the BRL. While inflation remains elevated, Brazil’s tight monetary stance makes the currency attractive from a carry perspective, particularly against currencies from easing central banks. At the same time, evolving trade relationships could support structural demand for BRL as exports diversify and deepen. With these forces in play, the BRL stands at the centre of emerging-market FX strategies.
B3 FX Market
Unlike most major currencies, BRL price discovery occurs primarily in B3’s futures market, not the spot market. B3’s dollar futures consistently see some of the highest FX volumes globally, making it the key venue for hedging and speculation.
For Asian participants, however, time zone differences and operational hurdles can limit direct access.
Introducing the BRLUSD Futures on SGX
To address Asian trading frictions, SGX, in collaboration with B3, has launched the BRLUSD futures contract, giving global traders direct access to BRL exposure during Asian market hours. This listing marks an important milestone, complementing B3’s onshore market and extending the BRL liquidity cycle well beyond Latin American and U.S. sessions.
Key advantages of the SGX BRLUSD futures contract:
Asia-hour liquidity: Trade BRLUSD in real time as global macro headlines break overnight. B3’s trading hours overlap with SGX’s night session, further enhancing offshore liquidity.
Hedging flexibility: Particularly useful for global portfolio managers who need to hedge BRL exposure while settling in USD.
Operational simplicity for clients that are already SGX clients.
Cost efficiency comparing to OTC market: Competitive clearing fees and typically tighter bid–ask spreads make execution more efficient.
Cross-margining benefits: Margin offsets are available for inter-commodity spreads, allowing traders to pair BRL with other SGX currency or commodity futures to optimize capital usage.
Putting into Practice
Figure 8: Carry Trade Strategy with BRLUSD
With the Selic rate expected to remain elevated through at least Q1 2026, the wide rate differential between Brazil and major developed markets continues to create opportunities for carry strategies. Fundamentally, the BRL tends to appreciate in a carry environment as demand for BRL-denominated assets rises; driven by investors seeking to capture Brazil’s high interest rates. Moreover, with an already constructive view on the BRL, a carry trade strategy offers a twofold benefit: currency appreciation alongside the positive carry derived from Brazil’s elevated yield advantage. This backdrop supports a long position on BRL.
Since the futures contract listed on SGX is quoted BRLUSD, to express this view, we could directly take a long position in the BRLUSD futures contract (BRLX5) at the current price level of 0.1820. We would set the stop loss at the lower support level of the descending triangle at 0.1790, a hypothetical maximum loss of 0.1820 – 0.1790 = 0.0030 points. While a classic carry trade can simply involve holding the position to benefit from the interest rate differential over time without a predefined take-profit, in this example we set a target at the post-COVID multi-year resistance of 0.2130, for a hypothetical gain of 0.2130 – 0.1820 points.
Furthermore, pairing BRL against low-yielding currencies such as JPY allows traders to capture attractive interest rate differentials while leveraging the inter-commodity margin offsets to enhance capital efficiency. Beyond carry opportunities, portfolio managers in Asia can also use the contract to hedge large BRL exposures, taking advantage of the liquidity outside B3 hours.
Conclusion
With monetary policy set to remain tight, inflation gradually converging, and Brazil carving out a stronger role in global trade, the BRL stands at the intersection of cyclical carry opportunities and structural shifts in capital flows. Whether expressed through directional longs or cross-currency strategies, the BRL offers traders a differentiated play in a market searching for new narratives beyond tech and tariffs.

NZD/USD: A Trap for Early Buyers? Retail 90% Long1️⃣ Technical Context
NZD/USD is trading around 0.5630, within a descending channel that started in mid-July. After testing the lower boundary of the channel and the demand zone between 0.5570–0.5620, price reacted with a mild technical bounce — yet without any structural reversal confirmation.
The daily RSI shows a bullish divergence and remains above 30, signaling a possible short-term rebound toward 0.5750–0.5800 before a potential continuation lower.
Key Levels
Resistance: 0.5750 / 0.5820 (upper channel + prior supply)
Support: 0.5570 / 0.5500 (demand + channel bottom)
Technical Bias: bearish while below 0.5820, but short-term corrective potential toward the upper channel remains.
2️⃣ COT Data (latest available report)
NZD Futures (CME):
Non-commercial: Long +3,044 | Short +6,160 → rising net short exposure.
Commercial: Long +2,869 | Short -286 → commercials remain hedged, confirming structural weakness in NZD.
USD Index: Non-commercials remain net short but are reducing exposure, signaling gradual USD strength.
→ Interpretation: COT data confirms a pro-USD, bearish bias on NZD, consistent with the broader technical trend.
3️⃣ Seasonality
Historically, November is slightly positive for NZD/USD, especially in shorter time frames (5–2 years).
20 years: -0.001
10 years: -0.003
5 years: +0.004
2 years: +0.005
→ Suggesting a short-term recovery phase in early November, followed by renewed weakness later in the month.
4️⃣ Retail Sentiment
Long: 90%
Short: 10%
Average long price: 0.5766
→ The overwhelming long positioning suggests many retail traders are trying to catch a bottom, which raises the risk of further downside pressure in the short term (potential liquidity sweep below 0.56).
5️⃣ Trading Outlook
Overall Bias: bearish with a short-term corrective potential.
Main Scenario:
→ Pullback toward 0.5750–0.5800 (upper supply zone), then likely continuation lower toward 0.5550–0.5500.
Alternative Scenario:
→ A daily close above 0.5820 would invalidate the bearish setup and open room toward 0.5950.
Confluences:
✅ RSI bullish divergence
✅ Short-term positive seasonality
⚠️ Retail extremely long
⚠️ COT bearish for NZD
