GBP/USD — The Trap Above 1.32 Before the Real Drop BeginsGBP/USD continues its bearish momentum after rejecting the major supply zone around 1.3450–1.3600.
From a structural perspective, price has formed a clear series of lower highs and lower lows, confirming the bearish continuation setup.
📉 Macro Context:
COT data (delayed due to the U.S. government shutdown) still shows a fragile Pound: non-commercial traders are almost balanced but with a slight reduction in shorts, while commercials remain heavily short. Meanwhile, the Dollar Index COT reveals a growing long positioning — a clear sign of renewed USD strength.
Sentiment: 82% of retail traders are long on GBP/USD → a strong contrarian signal.
Seasonality: November is historically weak for GBP/USD, showing a negative tendency in 10- and 15-year averages.
🔎 Technical Setup:
After a failed attempt to reclaim the 1.33–1.34 range, the pair dropped aggressively.
A short retracement toward 1.3150–1.3200 could serve as a liquidity grab before further downside continuation.
As long as price remains below 1.3270, the bearish bias remains intact.
🎯 Key Levels:
Resistance: 1.3150 – 1.3200
Support: 1.3000, 1.2850, then 1.2750
Invalidation: Daily close above 1.3270
🧩 Bias: Bearish continuation
Fed

Gold pauses below resistance — correction before next leg higherGold’s recent rally above 4,300 USD per ounce has stalled as U.S. yields remain elevated and the dollar sustains moderate strength. The slowdown in Core PCE (2.6%) and Q3 GDP (2.2%) revived expectations for a Fed rate cut in early 2026, yet Powell’s message of caution kept the greenback supported.
Meanwhile, real rates remain positive, limiting gold’s upside momentum in the short term. On the geopolitical front, safe-haven flows have softened after last week’s easing in Middle East tensions, prompting some profit-taking from speculative longs. However, persistent macro uncertainty and expectations of a gradual Fed pivot maintain gold’s medium-term bullish foundation.
COT (Commitment of Traders)
The COT reports remain frozen due to the ongoing U.S. government shutdown.
The latest available data (Sept 23) showed:
• Non-commercial longs: 332,808 (+6,030)
• Non-commercial shorts: 66,059 (+5,691)
This reflected an accumulation phase with a moderate increase in both sides, but a clear net-long bias from institutional players.
⚠️ Since the data is outdated by over a month, institutional positioning may have shifted following the recent volatility — interpret with caution.
Retail Sentiment
📊 58% long / 42% short → contrarian bearish bias
Retail traders remain moderately long on gold, suggesting room for a short-term pullback before any renewed institutional accumulation phase.
Seasonality
Historically, November tends to show a slightly negative seasonal bias for gold:
•Average change: between –0.4% and –7.5% depending on sample length.
•The pattern often shows a mid-month dip followed by strength into December.
📆 Seasonal view: short-term correction likely in early November before a year-end rally resumes.
Technical Outlook
After a sharp rally in October, XAU/USD has entered a consolidation/distribution phase just below the 4,250–4,300 resistance area.
Scenario principale:
A short-term continuation lower toward 3,950–3,900 remains likely as price retests the daily demand zone.
From there, buyers could re-enter in line with the seasonal recovery expected later in November.
Invalidation: Daily close below 3,850 would invalidate the bullish medium-term structure.
Trading Bias
•Short-term: Bearish → correction toward 3,950–3,900
•Medium-term: Neutral → awaiting confirmation of support reaction
•Long-term: Bullish → supported by macro uncertainty and dovish Fed outlook into 2026
✅ Final View:
Gold is likely to correct further toward 3,950–3,900 before resuming its broader uptrend into December.
Momentum is cooling, but the long-term bullish narrative remains intact as Fed easing expectations build.

USDJPY | Liquidity Sweep Before Year-End RallyUSD/JPY remains structurally bullish within a broad ascending channel that has defined price action since mid-2024. Despite recent pullbacks, momentum remains positive while price trades above the 151.50–152.00 structural support, aligning with the broader macro bias of USD strength and JPY weakness.
1️⃣ Seasonal Bias
Historical data from Market Bulls shows that November tends to favor USD/JPY upside, with an average gain between +0.8% and +1.2% across the 10- to 20-year datasets. This month’s seasonal strength often follows October consolidations, suggesting continuation potential toward year-end highs.
2️⃣ COT Positioning (Commitment of Traders)
USD Index: Non-commercials increased net longs by +1,541, confirming a persistent bullish bias on the USD side.
JPY Futures: Non-commercial traders added a significant +14,727 long positions, but commercial hedging remains heavily long, indicating that institutional demand is more protective than speculative.
The divergence implies temporary JPY strength, but the overall positioning still favors USD dominance in the medium term.
3️⃣ Sentiment Data
Retail traders remain 60% short vs 40% long on USD/JPY, providing a contrarian bullish signal. Historically, retail positioning against trend continuation adds conviction to a potential bullish extension.
4️⃣ Technical Structure (Daily Chart)
Price is consolidating near 153.40, just below the upper boundary of the ascending channel. A short-term pullback toward 152.00–151.50 could act as the liquidity grab zone before continuation.
Support Zone: 152.00 → 151.50
Key Demand Area: 150.50 (aligned with prior daily gap and mid-channel support)
Resistance Zone: 155.50 → 156.00 (upper trendline projection)
RSI: Currently neutral (~52), suggesting there’s still room for upside momentum before reaching overbought conditions.
The market may engineer liquidity below 152 before a bullish reaction targeting 155.50 and potentially the 156.80 macro extension zone by mid-November.
5️⃣ Confluence Summary
✅ Seasonality: Bullish
✅ COT: USD stronger bias vs JPY
✅ Retail Sentiment: Contrarian bullish
✅ Structure: Bullish continuation pattern within channel
⚠️ Short-term Risk: Liquidity sweep below 152

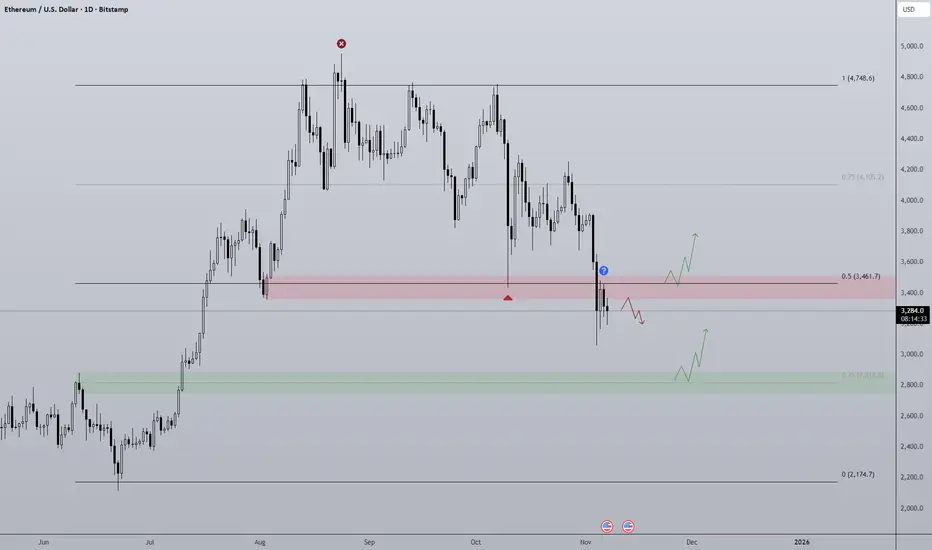
ETH Losing Range Midpoint? Similarly to Bitcoin, Ethereum finds itself around the midpoint of the high time frame range, only ETH has already lost the level and has rejected when retesting. Such a lack of strength is concerning for the project as well as the broader altcoin market.
So there are a few actionable moves I'm looking out for:
Bullish scenario is we maybe chop for a while around/under the midpoint then with high volume the midpoint gets flipped with conviction. That would open the door for the top half of the range to be accessible again. I think this scenario relies on the US Government shutdown coming to an end and QT also ending. Right now there just isn't the liquidity needed to prop up prices hence the slow bleed.
Bearish scenario is a simple continuation of the local bearish trend where 0.25 ($2,800) is the target. This area signaled the break in structure responsible for the previous rally and so I believe it will provide support but is also the target for the bears to reach.
Markets Looking SOFT at highs - Correction Underway (Key Levels)October 10th candle is a very important low for all US Markets
-S&P
-Nasdaq
-Dow
-Russell
The rally from that Oct 10 candle low (Friday) was met with aggressive
support but was only showing rallies in Mag 7 and AI related plays
Earnings for the most part are coming in meeting or exceeding expectations, but
price action is certainly looking soft with the market making lower highs and lower
lows for now
We have plenty of technical support, but given the longest US Government Shutdown
in history with dot.com like valuations (there is bubble and non-bubble evidence),
sentiment and elevated volatility are taking their toll and dragging the markets lower
I've closed a lot of open positions and de-risked the portfolio pretty severely this week
with the intention of finding ways to participate in a cautiously bullish environment. As I mention in the video, markets tend to V bottom, but round out the tops so the longer we
stall at these highs and the more "rounded" look we have near these highs, the more
fragile and support can be if we eventually see a break lower - TBD
Day to day, we continue to do good work carving out short-term winners and properly
position for what is next - good or bad
Thanks for watching. See you in the live markets
-Chris

Why is Bitcoin falling?At the center of everything lies the Federal Reserve’s restrictive monetary policy.
The fight against inflation—keeping interest rates higher for longer than the market expected—has created a powerful phenomenon: the rise of real interest rates (nominal rate minus expected inflation).
When real rates rise:
Money becomes “expensive.” Fixed-income investments (like U.S. Treasuries) become attractive without taking on risk. The opportunity cost of holding volatile, risk assets like Bitcoin increases.
Liquidity contracts. Less “cheap money” circulating in the economy means less fuel for speculative investments.
Connecting the Dots: The Domino Effect in the System
1 – High Real Interest Rates: The Primary Cause.
The Fed keeps rates high to fight inflation.
➡️ Direct downward pressure. Higher opportunity cost; risk assets become less appealing.
2 – CRE (Commercial Real Estate) Crisis: The Consequence.
Loans issued at low rates are maturing and can’t be refinanced at current, much higher rates. Defaults and losses emerge across the banking system.
➡️ Indirect systemic risk. Banks facing stress become reluctant to lend, tightening credit further and triggering “flight to safety” into dollars and Treasuries.
3 – Frozen Housing Market: The Symptom.
The rate lock-in effect (homeowners stuck with 3% mortgages) has paralyzed the real estate market. It’s clear evidence that high rates are “working,” but destructively for the real economy.
➡️ Sign of economic slowdown. A cooling economy reduces appetite for risk assets like Bitcoin.
4 – Unrealized Bank Losses: Systemic Vulnerability.
Banks still hold low-yield bonds that have lost value. If they’re forced to sell to meet withdrawals (as seen in the SVB crisis in March 2023), they realize those losses, amplifying systemic stress.
➡️ Fear of a banking liquidity crisis. In such moments, investors liquidate assets to raise cash—Bitcoin, viewed as high-risk, is often the first to go.
5 – Elevated TGA (Treasury General Account): Active Liquidity Drain.
When the U.S. Treasury raises the balance in its TGA, it’s effectively pulling dollars out of the financial system and parking them at the Fed. That reduces bank reserves and overall liquidity.
➡️ Immediate downward pressure. Fewer dollars in the system = less money to buy assets. It’s like draining water from a pool—every boat (stocks, Bitcoin, etc.) sinks a bit.
6 – Fed’s Emergency Liquidity Injections: The Reaction.
The Fed is injecting liquidity (through emergency loans or repo operations) precisely because liquidity is drying up (due to the high TGA and banking stress). It’s a temporary oxygen mask, not a stimulus.
➡️ Temporary relief, but a red flag. These injections prevent collapse but confirm a severe liquidity issue. They don’t reverse the tightening trend.
The Direct Link to Bitcoin’s Recent Decline
Bitcoin is falling because
It’s a risk-on asset. In a high-rate, low-liquidity environment, investors cut exposure to risk assets. Capital flows toward “safe” havens (Treasuries, the dollar). The underperformance versus the Magnificent 7 happens because, despite being tech, those firms generate real cash flow and are viewed as “safe havens” within equities amid the AI boom.
Liquidity is its fuel. Bitcoin’s 2020–2021 boom was fueled by massive liquidity injections from central banks. The opposite is happening now—liquidity drainage (via QT and a high TGA) removes that fuel.
Systemic fear. The combination of a commercial real estate crisis and fragile banks amplifies fears of a larger credit event. In panic, investors sell what they can, not what they want.
Summary
This combination creates a toxic environment for risk assets. Bitcoin, being among the riskiest and most liquidity-sensitive assets, suffers directly—underperforming versus “growth narrative” assets like AI stocks and entering a downtrend.
The Fed’s liquidity injections are just band-aids to avoid widespread bank failures—they don’t reverse the macro tightening backdrop.
The Light at the End of the Tunnel: Future Liquidity Catalysts
QT (Quantitative Tightening) Pause: Stopping the automatic $95B/month liquidity drain is itself a massive stimulus. Once QT pauses, liquidity stops shrinking. The annualized $1.1 trillion comparison measures the potential “relief” effect.
The PBOC Factor: If China’s central bank begins its own QE—even modestly—it signals global concern over dollar scarcity. It could set a precedent for other central banks to follow.
Who’s Selling?
Recent tactical sales by funds, some whales taking profits, leveraged traders being liquidated, and weak hands capitulating under macro pressure.
We’re in a painful transition phase.
The market is searching for balance between short-term liquidity stress and medium-term liquidity relief. Until that tug-of-war is resolved, Bitcoin will remain volatile and hypersensitive to any Fed or Treasury signals.
The most logical view: selling pressure may persist until a clear, practical policy shift appears—such as the actual start of a QT pause (expected around December).
When that signal comes, Bitcoin—already being quietly accumulated—will be positioned for a significant trend reversal.
The light at the end of the tunnel is real. But we’re still in the tunnel. The journey requires patience and conviction.

Could reduced Fed rate-cut expectations keep the dollar strong?
The dollar index extended its gains as the Fed’s increasingly cautious stance on additional rate cuts strengthened sentiment.
Dallas Fed President Logan noted that without clear evidence of inflation falling or a sharp cooling in the labor market, another rate cut in December would be difficult to justify. Similarly, Cleveland Fed President Hammack emphasized the need to maintain a degree of tightening to bring inflation back to target.
Meanwhile, the federal government shutdown reached its 35th day, tying the record from Trump’s first term. The CBO estimated that the shutdown has already shaved about 1% off Q4 GDP, with the impact potentially widening to 2% by the end of November if it continues.
DXY extended its uptrend, briefly testing the resistance at 100.20. Diverging bullish EMAs indicate a potential extension of bullish momentum. If DXY breaches above 100.20, the index may advance toward the following resistance at 100.50. Conversely, if DXY breaks below 100.00, the index could retreat toward the next support at 99.50.

GOLD: If Fed On Pause Then Gold Is On Pause TooAs you may have noticed, gold has seen a sharp reversal in recent weeks, and many traders and investors are now wondering whether this correction will be quick and shallow or last longer.
From an Elliott Wave perspective gold seems like it may try to complete an extended wave three, and put wave four pause in play. But what can trigger a retracement?
Well we need to consider US monetary policy. Powell didn’t convince markets last week about further cuts in December, so if rates stay on hold for the next few months or even longer, gold may continue to pause. The metal usually rallies more easily when expectations for rate cuts rise, not fall. So, both from a macro and wave perspective, this likely fits as a higher-degree fourth-wave correction. Overall, this correction could last longer, and once deeper prices flush out late buyers and weaker positions — possibly in the coming months — that’s when we’ll likely be more confident calling for the next major leg higher, ideally early in 2026.
So looking to buy? Patience!
Grega

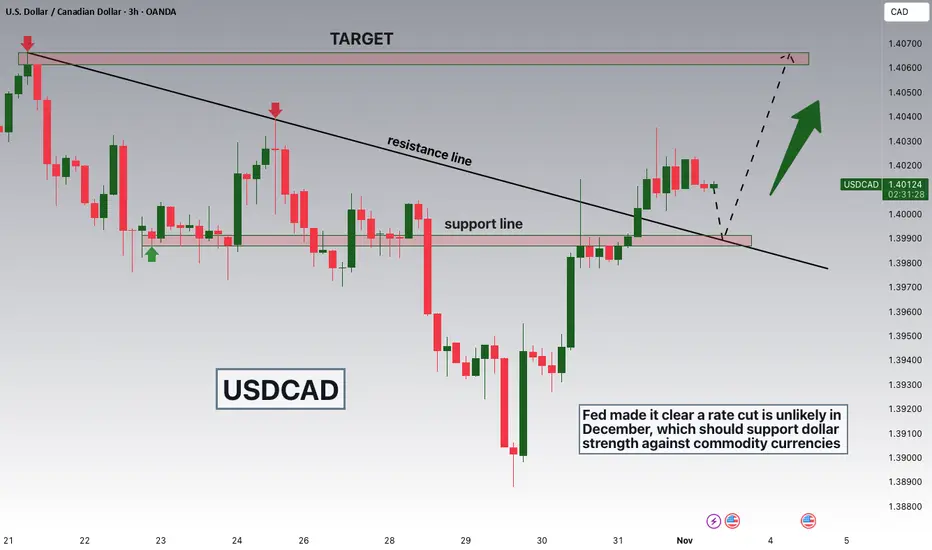
USDCAD Breakout and Potential RetraceHey Traders, in today's trading session we are monitoring USDCAD for a buying opportunity around 1.39900 zone, USDCAD was trading in a downtrend and successfully managed to break it out. Currently is in a correction phase in which it is approaching the retrace area at 1.39900 support and resistance area.
Fundamentally fed made it clear that a rate cut is unlikely in December which should strengthen the dollar against commodity currency!
Trade safe, Joe.
03/11/25 Weekly OutlookLast weeks high: $116,415.75
Last weeks low: $106,320.38
Midpoint: $111,368.06
This week will be the third week in a row where ~$116,000 is acting as weekly high and a major resistance level. Last weeks price action was clear, the bulls are incapable of flipping that level and making it new support. As a result the bulls retreated back towards strong support at weekly low ~106,000 completing the SFP. Also this pattern is a mirror image of the previous weekly outlooks price action. No clear trend bias at all here but what is obvious is bull market momentum is dying out.
Bitcoin has always been hyper sensitive to liquidity, as always month end window dressing by the banks have a negative effect on liquidity, it usually takes a few days to get over this and resume normal levels again. The Government shutdown in the US does not help this as spending from the Treasury General Account has stopped with approximately $150Bn coming out of the market in October alone as a result.
Should Bitcoin push higher it can only do so once Government operations resume IMO. FOMC resulted in a 25bps cut and QT (Quantitative tightening) is ending on 1st December, all bullish signs for the future but currently and for this week I think chop/ gradual drawdown continues.
Good luck this week everybody!

NZDUSD Faces Pressure as Hawkish Fed Supports Dollar Strength!!!Hey Traders, in tomorrow’s trading session we are monitoring NZDUSD for a selling opportunity around the 0.57450 zone. The pair is trading within a broader downtrend and is currently in a correction phase, approaching the trendline and resistance area at 0.57450.
From a fundamental perspective, the Federal Reserve’s recent hawkish remarks—hinting that rate cuts in December are unlikely—have provided renewed support for the U.S. Dollar, adding downside pressure to risk-linked currencies like the NZD.
If the pair rejects the 0.57450 zone with strong bearish momentum, further continuation toward recent lows could be expected.
Trade safe,
Joe

EUR/USD – Bears in Control but Demand Zone Could Spark a Rebound🔹 EUR/USD – Weekly Outlook (1–7 November 2025)
Bears remain in control, but a key demand zone is now in play.
The euro continues to trade under pressure as macro divergences between the U.S. and Eurozone persist.
In the U.S., the latest data confirmed a clear cooldown in growth and inflation, with Core PCE slowing to 2.6% YoY and GDP Q3 printing 2.2% vs. 3.0% expected. This fueled market expectations for a Fed rate cut in Q1 2026, yet Chair Powell reiterated that “progress on inflation remains incomplete,” keeping a neutral–hawkish tone. The U.S. dollar therefore preserved its defensive bid, supported by ongoing safe-haven demand amid geopolitical tension and weaker European data.
Across the Eurozone, inflation continues to decelerate (headline 2.5%, core 2.8%), while PMIs remain below 50, indicating a stagnant industrial sector. Market participants now expect the ECB to lean more dovish into early 2026, potentially preparing the ground for a rate cut once disinflation stabilizes. This narrative has weighed on the euro, pushing EUR/USD back below 1.16.
COT (Commitment of Traders)
COT data remain frozen due to the CFTC shutdown, with the last update dated September 23.
At that time, non-commercials held a strong net long on EUR (+114K), reflecting broad bearishness on the USD. However, the latest price action clearly suggests a partial unwinding of long exposure, consistent with the recent downside retracement.
⚠️ These figures are now outdated and must be interpreted with caution — institutional flows may have shifted significantly since late September.
Retail Sentiment
📊 59% long / 41% short → contrarian bearish bias.
Retail traders remain predominantly long, implying a higher probability of continued downside in the short term, especially while macro data favor the dollar.
Seasonality
Seasonal statistics for November are mildly positive over 10–20Y composites, but recent 5-year data suggest a sluggish start to the month, often followed by a technical rebound in the second half.
📅 Seasonal conclusion: short-term weakness likely persists into mid-November, with recovery potential toward month-end once markets price in softer U.S. CPI or dovish Fed expectations.
Technical Outlook
EUR/USD continues to move within a descending channel since late August.
After a clean rejection from the 1.1700–1.1750 supply zone, the pair broke recent lows and is now consolidating within the 1.1530–1.1550 demand area, aligned with the summer support base.
Key technical levels:
Resistance: 1.1650–1.1700
Immediate support: 1.1530–1.1500
Next demand zone: 1.1380–1.1420
RSI: below 50, yet showing early signs of bullish divergence, hinting at a potential rebound if 1.15 holds.
🎯 Primary Scenario:
Price may extend the corrective leg toward 1.1450–1.1420, where a structural swing low could form. From there, any USD weakness following U.S. CPI data could fuel a technical rebound targeting 1.1650–1.1700.
⚙️ Invalidation: Daily close above 1.1730, which would break the descending structure and shift the bias neutral-to-bullish.
Summary
Macro: Euro pressured by softer inflation and weak PMI; USD supported by cautious Fed and geopolitical flows.
Sentiment: Retail still long — contrarian signal for more downside.
Technical: Channel intact; demand zone at 1.1530–1.1500 under test.
Outlook: Expect another leg lower before possible late-month rebound.

AUD/USD – Waiting for the Pullback Before the Next Bullish Leg?After rebounding strongly from October lows, AUD/USD is testing the 0.6580–0.6620 supply zone while staying above the key support area at 0.6520–0.6550.
On the macro side, the RBA remains data-dependent after pausing its rate cuts, citing sticky services inflation and resilient labor markets. Meanwhile, the USD has been capped by softer growth data and growing expectations for further Fed easing into early 2026 — a mix that keeps AUD/USD in recovery mode, at least short term.
COT positioning (last valid as of September 23, due to the CFTC shutdown) still reflected heavy speculative shorts on the Aussie — a structure that supported the recent bullish correction but is now outdated.
Retail sentiment shows 77% of traders short, suggesting a strong contrarian upside bias, consistent with the technical picture.
Seasonality data points to a mildly positive bias in October–November, typically followed by neutral behavior in December.
Technical structure:
Price has broken out of the descending channel and is building a short-term higher-low structure.
Support (demand zone): 0.6520–0.6550
Resistance (supply zone): 0.6580–0.6620 → breakout could extend toward 0.6680–0.6720
RSI: mid-range, indicating room for another impulse higher.
🎯 Trading Plan
Base scenario: Look for a pullback into 0.6520–0.6550 to rejoin the bullish leg targeting 0.6680–0.6720.
Alternative: A rejection from 0.6600–0.6620 could trigger a short-term correction toward 0.6500 before buyers return.
Invalidation: Daily close below 0.6475 (loss of structure).
⚙️ Bias: Short-term bullish, medium-term neutral-to-bullish.
🕒 Focus: RBA tone, Chinese PMIs, and U.S. ISM/labor data — all key for the next leg of AUD/USD.

USD/CAD: Short-Term Correction 🔹 COT (Commitment of Traders)
(Last update: September 23, 2025 – data not refreshed due to the U.S. government shutdown)
USD Index (ICE Futures)
Non-commercial longs: 14,032 (+1,541)
Non-commercial shorts: 24,376 (−1,009)
→ Institutional traders were closing shorts and adding longs, signaling early signs of bullish bias on the USD before the shutdown halted updates.
Canadian Dollar (CME Futures)
Non-commercial longs: 18,035 (−2,940)
Non-commercial shorts: 132,841 (+4,689)
→ Heavy short build-up on CAD alongside long reduction — a bearish institutional sentiment for the Canadian Dollar.
Even with outdated data, the COT positioning remains USD bullish / CAD bearish, supporting a medium-term upside bias on USD/CAD.
🔹 FX Sentiment (Retail Positioning)
56% short / 44% long
📌 Retail traders are slightly net short, providing a contrarian bullish signal for USD/CAD — aligning with institutional positioning.
🔹 Seasonality
Historically, October shows mild positive bias for USD/CAD on long-term averages (15–20 years), but the 5-year tendency is slightly negative.
Neutral-to-mildly bullish for late October, with stronger USD seasonality emerging in November–December.
🔹 Price Action
The pair remains within a rising parallel channel from July lows, recently rejecting the upper boundary near 1.4100 and showing early signs of structural fatigue.
Price is now consolidating between 1.4000–1.3900, with bearish momentum slowly building up.
Technical Levels:
Resistance: 1.4050–1.4100
Support zone 1: 1.3900
Support zone 2 (major): 1.3700
RSI: showing divergence with lower highs, signaling potential corrective leg ahead.
🎯 Main Scenario:
A short-term retracement toward 1.3850–1.3800 remains likely if 1.3900 breaks, while the broader bullish trend remains intact unless price closes below 1.3700.
Bias for now → Short-term corrective, medium-term bullish.
Invalidation: daily close below 1.3700 (trendline + demand break).

GOLD Short-Term Pullback 🔹 COT (Commitment of Traders)
(Last update: September 23, 2025 – data not refreshed due to the CFTC shutdown)
Gold (COMEX)
Non-commercial longs: 332,808 (+6,030)
Non-commercial shorts: 66,059 (+5,691)
→ The latest available data (outdated) showed an increase in both positions, with a stronger rise on the long side — indicating institutional accumulation in late September ahead of the October rally.
Although outdated, the COT report still reflects a mildly bullish structure, but no longer captures the current market dynamics after recent volatility.
🔹 FX Sentiment (Retail Positioning)
58% long / 42% short
📌 Retail traders remain moderately long on gold. This supports a short-term contrarian bearish bias, aligning with the ongoing corrective move in price.
🔹 Seasonality
Historically, October and November tend to be statistically bullish months for gold, with average gains between +2% and +4% over 10–20-year periods.
📌 Seasonal conclusion: the context remains bullish on a seasonal basis, with potential for recovery once the current correction stabilizes.
🔹 Price Action
After the strong bullish impulse that pushed XAU/USD into the 4,350–4,400 area, price entered a phase of consolidation/distribution.
Current structure shows:
Key resistance: 4,250–4,300
Main demand zone: 3,950–3,900
RSI remains neutral but continues to lose momentum, consistent with a possible minor bearish leg before a new bullish wave.
🎯 Main Scenario:
Expecting a continuation of the corrective phase toward 3,950–3,900, aligning with the daily demand area and a likely institutional reaccumulation zone.
From there, a potential bullish resumption could emerge within November’s seasonal strength.
⚙️ Invalidation: daily close below 3,850, which would compromise the medium-term bullish structure.

USDJPY Eyes 153.20 Support as Fed Signals Patience on Rate CutsHey Traders,
In today’s trading session, we’re monitoring USDJPY for a buying opportunity around the 153.200 zone. The pair remains in a broader uptrend and is currently in a correction phase, approaching a key support and resistance area aligned with the ascending trendline.
Structure: USDJPY continues to print higher highs and higher lows, maintaining strong bullish momentum. The 153.200 level serves as a critical zone of confluence where buyers have historically stepped in.
Fundamentals:
Recent Fed commentary emphasized patience before cutting rates, citing the need for more evidence of cooling inflation. This reinforces a hawkish tone, supporting the Dollar
Trade safe, Joe.

ZEC/USDT spot sellNow we'll see bearish candles, or we'll rise slightly until we reach a strong order block, but I'm not interested in this weak rise that will be followed by a drop. Therefore, I think it's better to exit now until we see if the news about the PCE comes out or not. If it does, it's a good boost for the markets, and if the expectations are positive, the boost will be even bigger. If the result is weaker than expected, the price will fall, and if the result is better than expected, we'll continue with a very strong upward trend. However, if the report doesn't come out due to the government shutdown, it will be very negative again, just like what happened with the GDP news.
Be wary of the fluctuations that will occur from now on, as there may be a surprise positive or negative announcement.

Bitcoin-Gold Ratio Versus Monetary Policy
Chart shows:
—Bitcoin/Gold
—20-Week SMA
—SMA Slope Z-Scores*
—Fed Funds
—QE & QT
Bitcoin/Gold broke support of its 20W SMA for the 6th time in Bitcoin's history while the SMA slope normalizer* value reached zero (the long SMA rolled over), the Fed enters a rate-cutting cycle, and QT is ending.
These could represent increased bearish probabilities for the Btc/Gold ratio on medium and long timeframes.
*Slope Normalizer: The differentiated (positive and negative values are separated before subsequent calculations are made with the data) normalized z-scores (z-scores below 1 are muted while z-scores above 1 are not muted, in order to emphasize unusual values.)
When used with the SMA as an input, this essentially shows the normalized values of the rates of change of the SMA (on this chart, it is showing the normalized slope of the long-term simple moving average.)

BTCUSDT – Hawkish Fed Sends Bitcoin to Test Its 200‑Day LineBitcoin extended losses this week as Fed Chair Jerome Powell’s hawkish tone cooled expectations for another rate cut. The move left traders torn between short-term risk-off signals and long-term technical support.
The Fed’s second straight 25-basis-point cut was widely expected, but Powell’s comments hinted that the central bank may pause before easing further. That shift strengthened the dollar and Treasury yields, weighing on crypto and risk assets. Bitcoin slipped around 3% to below $108 000 before finding temporary footing.
🔹 Macro & Sentiment
Powell’s message was clear: the committee remains divided, and caution may prevail into year-end. That triggered profit-taking across risk markets. Meanwhile, Trump’s “amazing” meeting with Xi Jinping and a new trade truce added volatility, but digital assets lagged the optimism seen in equities — a sign of hesitation among crypto traders.
🔹 Chart & Levels
BTC is now testing its 200-day moving average near $110 000, a level that has defined the broader uptrend since summer. Below that, key support sits at $107 000 and $100 000. Resistance remains around $120 000–$127 000. A clean bounce from the 200-day line could restore bullish momentum, while a break beneath it would expose the lower range.
As long as $110 k holds, bias stays cautiously bullish toward $120 k+. Below $110 k, the outlook turns more corrective.
🧾 The Takeaway
Fed caution has slowed Bitcoin’s momentum but not yet reversed its trend. The next major move depends on whether the 200-day line can hold under the pressure of a stronger dollar and shifting rate expectations.
Off to you: Will Bitcoin COINBASE:BTCUSD defend its 200-day support or roll over for a deeper correction?

Gold peaks once the Fed's cutting cycle is over...As the cutting cycle ends and rates remain relatively low, that is when the gold price tends to peak. This suggests that we are not yet near a gold price top, as the cutting cycle has not been ended by Chairman Powell. With poor economy or jobs data, or via a dovish Trump candidate for Fed Chair next year, rates will drop further. History tells us that once the cutting is over, the gold price will stall.

Today's Market Wrap: Fed, Gold, and Earnings – 29/10/2025The Federal Reserve cut interest rates by 25 basis points, marking the lowest level since 2022. However, Fed Chair Jerome Powell hinted at a possible pause in further rate cuts for the rest of the year. Still, the S&P 500 gained 0.2%, and the Nasdaq gained 1%, both hitting fresh record highs.
Gold remained flat at $3,950 an ounce after Powell warned that a December rate cut is not guaranteed. Potential progress on the US-China trade framework has also reduced some safe-haven demand.
In corporate earnings, Microsoft beat expectations but saw a ~2.5% drop in after-hours trading due to a slight miss in cloud revenue. Meta posted strong results but fell ~8% after hours, driven by concerns over capital expenditure. Alphabet exceeded earnings and revenue forecasts, with strong performance across Search, YouTube, and Cloud, sending shares up ~5% in after-hours trading.

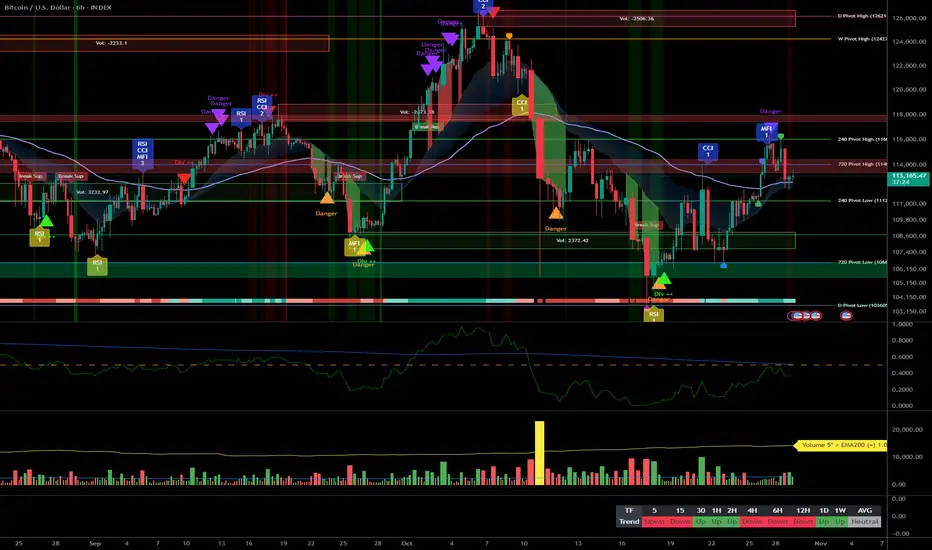
BTC pinned below 116k: FOMC to break the range__________________________________________________________________________________
Market Overview
__________________________________________________________________________________
BTC is coiling into the FOMC: capped at 115–116k and defended at 112.7k, with volatility set to expand on the trigger.
Momentum: Range with a tactical bearish tilt 📉 — compression below 115–116k, dip buyers active at 112.7k.
Key levels:
Resistances (HTF) : 114.9–115.1k (1D/4H), 116.0k (1D/12H), 117.9k (1D extension).
Supports (HTF) : 112.7k (1D/12H), 111.7k (HTF), 109.05–109.07k (2H/6H/1D cluster).
Volumes: Moderate on 1D; “normal” intraday; “very high” on 30m during impulses.
Multi-timeframe signals: 12H Down while 1D is Up — transitional range; a confirmed break above 115–116k would align TFs, otherwise risk of a 112.7k → 109k sweep.
Risk On / Risk Off Indicator: NEUTRAL SELL — validates caution and counters any sustained push until 115–116k is reclaimed; favors edge trading.
__________________________________________________________________________________
Trading Playbook
__________________________________________________________________________________
Strategy: event‑driven range with a risk‑off tilt — trade the edges with confirmation.
Global bias: NEUTRAL SELL below 115.1–116k; bias invalidated on daily close > 116k .
Opportunities:
- Breakout buy: Reclaim/close above 115.1–116k with volume, target 121–122k.
- Buy the dip: Confirmed (≥2H) bullish rejection at 109.05–109.07k, back to 112.7k then 114.9–115.1k.
- Tactical sell: Clear 114.9–116k rejection (2H/4H bearish close), aim 113.0k then 112.7k, runner 111.7k.
Risk zones / invalidations: A close < 111.7k opens the 109k cluster; a ≥2H close < 109k invalidates dip‑buys.
Macro catalysts (Twitter, Perplexity, news): FOMC cut (25 bps) with possible QT changes; options crowding = whipsaw risk; spot ETF inflows = mild cushion.
Action plan:
Entry: confirmed post‑breakout retest 116,050–116,200.
Stop: below 114,900.
TP1: 117,900; TP2: 121,000–122,000; TP3: let it run if extends.
R/R: approximately 1:2 to 1:3 depending on fill.
__________________________________________________________________________________
Multi-Timeframe Insights
__________________________________________________________________________________
Overall, 1D remains constructive but intraday groups lean NEUTRAL SELL, keeping price in an event‑driven range.
12H/6H/4H/2H/1H/30m: NEUTRAL SELL with lower highs below 115–116k; supports at 112.7k then 111.7k; highest‑quality demand at 109.05–109.07k, deeper near ~107k.
1D: Still constructive while 109k holds; a 1D close above 116k would align TFs and open 121–122k (potential squeeze).
Major divergence: 12H Down vs 1D Up — a transitional signal; 115–116k is the decision band for trend alignment or a rotation toward 109k.
__________________________________________________________________________________
Macro & On-Chain Drivers
__________________________________________________________________________________
FOMC‑led macro should decide the range resolution and drive the next volatility expansion.
Macro events: 25 bps cut expected with QT end/slowdown discussed — direct risk‑on/off catalyst; options are crowded long → whipsaw risk; equities at highs keep the tone constructive but fragile around the event.
Bitcoin analysis: US spot ETF inflows add a small downside cushion; corporate bids and stablecoin mints help demand; technically, >116k unlocks 121–122k, losing 111k ups odds of a 109k flush.
On-chain data: Modest whale prints; stablecoin mints increasing; no clear systemic distribution — tactical support rather than a trigger.
Expected impact: Technical bias stays NEUTRAL SELL until 115–116k is reclaimed; the post‑FOMC reaction should confirm either a squeeze to 121–122k or a liquidity hunt toward 109k.
__________________________________________________________________________________
Key Takeaways
__________________________________________________________________________________
BTC is in a catalyst‑driven range under a major resistance shelf.
- Overall trend: neutral with a bearish tilt while 115–116k caps.
- Most relevant setup: confirmed breakout above 116k toward 121–122k; alternative is a confirmed dip‑buy at 109.05–109.07k.
- One macro factor: FOMC decision and QT guidance can flip risk tone quickly.
Stay nimble: trade confirmation, not guesses — let the reaction lead.
XAUUSD: How Will Gold Prices Move Next?Fundamental approach:
- Trade Talks and Gold Sentiment:
Gold experienced a sharp correction after reaching record highs, primarily due to improving risk sentiment as optimism grew around US-China trade negotiations. Reports indicate that both nations have reached a preliminary framework agreement on export controls and tariffs, which is expected to ease geopolitical tensions and reduce demand for safe-haven assets, such as gold.
- Other Pressures: Fed Policy and the US Dollar:
The gold market is also reacting to expectations of a Fed rate cut. While a rate cut typically supports gold, the move is largely priced into the market. Recent steadiness in the US dollar, as well as the possibility of a less dovish stance from the Fed, has added further pressure. With traders focusing on upcoming policy signals and macroeconomic data, a "cut and pause" approach from the Fed could prompt continued profit-taking in gold.
- Outlook:
As long as US-China relations remain stable and central banks, especially the Fed, avoid surprising markets with additional dovish measures, XAUUSD may remain under pressure.
Technical approach:
- XAUUSD significantly declined to the support area of 3890-3950. The price is between both EMAs, indicating a shift to sideways movement.
- If XAUUSD breaches the support area, the price may decline to the next support level at 3720, which is confluenced with the 61.8% Fibonacci Extension.
- Conversely, remaining above the support area may prompt a retest of the next resistance at 4054.
Analysis by: Dat Tong, Senior Financial Markets Strategist at Exness
